Transcription
DRAFT – subject to revisionAPPENDIX X. LABORATORY TEST OF BAT DETECTORS AND BAT DATALOGGERS’ ABILITY TO CAPTUREULTRASOINC SIGNALSI. INTRODUCTIONDuring the evaluation of the data generated from the winter deployment, it became obvious that thedifferent devices did not record ultrasonic signals equally. Even a casual examination of a minute-byminute comparison of the number of files generated (and the number of calls recorded) reveals widediscrepancies, not only between detectors and data loggers, but also between the detectors themselves.We conducted a review of the literature relative to comparisons of bat detectors signal detecting abilityand discovered that this has been reported by others. Several investigators of the earlier bat detectormodels reported that detectors had different sensitivities that can lead to differences in signal detectioncone, angular range of detection, and maximum detection distances (Downes 1982; Forbes andNewhook 1990; Waters and Walsh 1994).More recent evaluations of newer models of bat detectors are provided by Solick et al (2011) and Adamset al (2012). Solick et al (2011) performed a side-by-side comparison of selected bat detectors (AnaBat’sSD1, Wildlife Acoustics’ SM2, Pettersson’s D500x, and Binary Acoustics AR125) that confirmed differentdevices generate different bat activity rates due to the differences in the devices’ microphone quality,sensitivity settings, and information processing strategy.Adams et al (2012) compared the detection of echolocation calls (both synthetic and free-flying bats)among five commonly used bat detectors (AnaBat SD2, Avisoft UltraSound Gate, Batcorder 2, Batlogger,and Wildlife Acoustic’s SM2BAT). In general, signal detection was most affected by the frequencydominating the signal and the distance from the source. The effect of angle was less apparent.Given the discrepancy we observed in the signal detecting ability among devices used in our fielddeployments, we decided to verify this phenomenon by testing the signal detecting abilities of thedetectors and data loggers under laboratory (controlled) conditions.II. OBJECTIVEThe intent of this study was to document the ultrasonic signal detecting abilities of the devicesevaluated in this study under controlled conditions through the use of known ultrasonic frequencies, atknown amplitudes, and at various angles to the microphone. The devices tested were: SM2Bat batdetector, D500x bat detector, AnaBat Roost Logger, and the Bat Logger II. (See the main report for adescription of these devices.)Appendix X, page 1last revised: Nov 2014
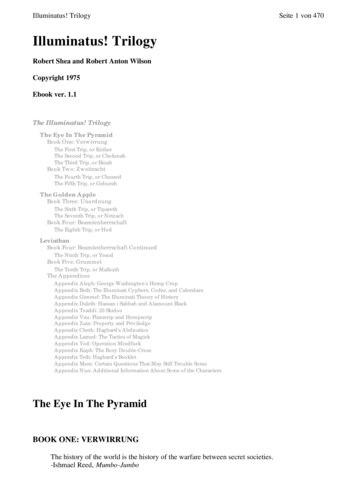
DRAFT – subject to revisionIII. MATERIALS & METHODSDave Plummer (Electronics Technician) and Ted Etter (Electronics Engineer) performed the laboratorytest (discussed below) at the Missoula Technology & Development Center.In order to test each device under identical conditions we created a circuit and software for generatingand controlling ultrasound signals. In the remainder of this report, we refer to this equipment as theUltrasonic Signal Source Equipment (Fig. 1 and 2). The frequencies that we used in the test ranged fromapproximately 25kHz to 80kHz in 5kHz increments.The materials used in perform the laboratory test are discussed in section III.A; the method used to testthe devices is presented in section III.B.A. MaterialsUltrasonic Signal Source EquipmentFor the transducer of the Ultrasonic Signal Source, we chose the SensComp’s Series 600 model.Characterizing its output amplitude over the range of frequencies being generated was the first task.This was done so that similar signal amplitudes could be produced over a range of frequencies. Thetransducer was biased with 200VDC and signals of specific frequencies and amplitudes were capacitivelyintroduced from a function generator (BK Precision 4070A). The ultrasonic signal was received onanother Series 600 transducer also biased at 200VDC. Both the introduced signal from the functiongenerator and the received signal were observed with an oscilloscope (Tektronix MSO 3014) (Fig. 2).The separation between the transducers for this test was 24 inches. The resulting frequency responsecurve compared well with that provided by the manufacturer. Based on that data, we determined gainsfor specific frequencies that would result in nearly equal output amplitudes for all of the frequencies.Fig. 1. Illustration of the components involved in the Detector/Logger test.Appendix X, page 2last revised: Nov 2014
DRAFT – subject to revisionFig. 2. Circuit board for the Ultrasonic Signal Source(top). Function generator and oscilloscope used togenerate and view ultrasonic signals of specificfrequencies and amplitudes (bottom).Controller Circuit descriptionThe Ultrasonic Signal Source Equipment’s controller circuit is centered on a Microchip PIC18F2523. Thismicrocontroller’s main functions are to: 1) create pulses by controlling the signal from the functiongenerator, 2) enable the appropriate amplitude gain of the signal at each frequency, 3) provide DCvoltage to control the frequency output of the function generator. These functions allow themicrocontroller to set the duration, amplitude, and frequency of an ultrasound signal. Sequences of tenpulses at each of the 12 frequencies (i.e., 25, 30, 35 80 kHz) are generated by software.Once the 25kHz to 80kHz sine wave signal from the function generator is brought onto the circuit boardit must pass through a switch, controlled by the microcontroller, before passing through an amplifierand out to the transducer. To set the duration of each pulse an analog switch is software controlled togate the function generator’s output through to the remainder of the signal’s circuit path. Pulses ofultrasound frequency sine waves, and periods of no signal, are controlled by the software.Appendix X, page 3last revised: Nov 2014
DRAFT – subject to revisionAfter passing through the switch the ultrasound signal’s amplitude is adjusted by an operationalamplifier before it goes out to the transducer (Fig. 3). The microcontroller uses a multiplexer to set thegain of the amplifier by switching in different values of feedback resistors, depending upon thefrequency being generated. The switch, amplifier, and multiplexer are sourced with plus and minus15VDC, from a CUI Inc PYB30-Q24-T515-U power supply, to drive the transducer.Fig. 3. Transducer – front (left) and back (right).The microcontroller has built in pulse-width modulation (PWM) modules, one of which is used to controlthe frequency output of the function generator, which has a voltage controlled frequency sweepcapability. A control signal of zero to five volts was used to sweep the output of the function generatorfrom 25kHz to 80kHz. The signal-averaged duty cycle of the PWM signal determines the outputfrequency of the function generator.A 12V 80Ah AGM battery was used to power the circuitry. The 200VDC bias voltage for the transducerwas generated using a pre-existing circuit designed for another project.To allow for the duration of pulses and the time between them to be changed, we incorporated a seriesof switches. A pushbutton tied to one of the microcontroller’s inputs was used to start the sequence ofpulsesSoftware Flow DescriptionThe software program that operates the Ultrasonic Signal Source Equipment cycles in an idle loop,flashing an LED to indicate the microcontroller’s operation, until the pushbutton start switch is closed.While the program is producing ultrasound signals the LED does not flash.Once the start switch has closed, the software scans the switch setting that sets the pulse width andtime between pulses. Throughout the test the duration of the pulses was set at 16mS and the timebetween pulses was 50mS.The microcontroller outputs a PWM signal which causes the function generator to produce a 25kHz sinewave. The gain of the operational amplifier is then set by the microcontroller using outputs to theAppendix X, page 4last revised: Nov 2014
DRAFT – subject to revisionmultiplexer. After a two second pause the microcontroller allows ten pulses to pass from the functiongenerator, through the analog switch and the operational amplifier, to the ultrasound transducer. Afteranother two second pause, a half second long pulse at the same frequency is output, and then a onesecond pause (Fig. 4). The purpose for this long pulse was to behave as a separator between pulsesequences of different frequencies.The processes (described above) then repeats, with the only differences being that the PWM signalchanges to cause the function generator to increase its frequency output by approximately 5kHz, andthe gain will change to maintain a relatively constant transducer output amplitude for the newfrequency.The software continues to produce ten 16mS pulses and a half second pulse, at each 5kHz stepfrequency, until stopping after producing output at 80kHz. The software then returns to an idle loop,flashing the LED and scanning for a pushbutton closure.Frequency Sensitivity Test TimelineStart Button10 Pulses @ 30kHz10 Pulses @ 25kHz30kHz Tone25kHz Tone2S2S .5S3S2S .5S10 Pulses @ 35kHz10 Pulses @ 80kHz80kHz Tone3S2S .5STime AxisFig. 4. Timeline of events of one test at a given amplitude.We changed the microcontroller’s software for the testing of the Bat Logger II. We used the switches todirect the code to the proper subroutine for the single frequency being tested. The pulse and intervaldurations were set in code, and were maintained at 16mS and 50mS respectively.Device ConfigurationThe devices were configured as follows:SM2Bat : Sample Rate 384000; Channels- Mono-L; File Format- WAC0; Gain left- 0.0 dB; Gainright- 0.0 dB. Schedule (advanced): Time set to just before midnight prior to each test, thentest initiated after device indicated it was recording.D500x: f 500; PRE OFF; LEN 1.0; Input Gain 45; Trig Lev 80; Interval 0.Appendix X, page 5last revised: Nov 2014
DRAFT – subject to revisionAnaBat Roost Logger: Set to sample continuously; battery capacity entered as 1300AH.Bat Logger II: Sensitivity potentiometer in middle position. Data logger scaling: 0.0119 0.0;0.35897 15.0.Laboratory EnvironmentWe conducted the lab test in the photography studio at the Forest Service’s Missoula Technology andDevelopment Center. The studio has foam acoustic panels on much of its wall surfaces. In order tofurther isolate the devices being tested, we placed the devices in a four sided (three sides and a ceiling)interview booth lined with acoustic foam panels. The device under test (DUT) was placed on a stand infront of the rear wall of the booth. We placed the ultrasonic signal source at the same elevation as, andfour and a half feet in front of, the DUT (Fig 5).The ultrasound signal control circuitry, instruments, power supplies, computer, and technician werelocated on the other side of one of the walls of the interview booth. Approximately five feet of longtwisted pair wires made the connections for the transducer’s power, drive signal, and their returns.B. MethodsTest of the devices’ ultrasonic signal detecting abilityWith the exception of the Bat Logger II, we tested all the devices in the same manner. We placed asingle device in the booth directly facing the transducer (zero degrees orientation), powered up ready torecord (Fig. 5). Since the SM2Bat and D500x both have external microphones, they were aligned ontheir long axis (i.e., microphone in front/handle behind) for this orientation.Appendix X, page 6last revised: Nov 2014
DRAFT – subject to revisionFig. 5. Lab setup for testing of ultrasonic sensitivity of the device.We set the output of the function generator for 2 Volts peak-to-peak (Vpp). This was used to generatethe highest amplitude ultrasonic signals. The start pushbutton on the ultrasound signal controller wasused to initiate a subroutine in the program on the microcontroller. The circuitry then generated tenpulses at 25kHz followed by a half second continuous tone of the same frequency. After a pause thesame was done at 30khz, then 35 kHz, and so on until 80kHz, at which point the software exits thesubroutine and goes into an idle loop. This constituted one test segment, and the DUT was accessed,the file(s) downloaded and stored to a directory (e.g. P 2Vpp 0deg). (Note: Only one test segment wasrun for each device.)To generate the next amplitude, we set the output of the function generator to 600mVpp and anothertest segment was run, then the same was done for 200mVpp. We then rotated the DUT 45 degrees toone side and another three segment runs were conducted. (For the devices with external microphones,the microphones were rotated.) Then the DUT was rotated another 45 degrees, thereby positioning it 90degrees to the signal source, and another three segment runs conclude the testing for a given device.This resulted in nine test segment runs for each device. (See Table 1 for an example of how test wereperformed.)Appendix X, page 7last revised: Nov 2014
DRAFT – subject to revisionTable 1. Method used to test devices’ ultrasonic signal detecting ability (sensitivity) at variousfrequencies and wave amplitudes (intensities). Ten ultrasonic signals of knownfrequency and intensity were pulsed to all devices at various angles of incidences. Thenumber of signals (pulses) that the tested device actually detected was verified.Transducer at a 0o angle* from Device A**.Signal intensity:Voltage used to generate wave amplitude(Volts tudeAmplitudeAmplitude(kHZ)(2 Vpp)(0.6 Vpp)(0.2 Vpp)2510 pulses10 pulses10 pulses3010 pulses10 pulses10 pulses3510 pulses10 pulses10 pulses 8010 pulses10 pulses10 pulses*Angles of incidences were 0, 45, and 90 degrees.**All 4 devices were tested.We suspended the external microphones for the SM2Bat and the D550x in a rubber band ‘cradle’ inorder to isolate them from interference. (Also, it should be noted that the SM2bat was the only devicethat had an omnidirectional microphone.)The Bat Logger II counts ultrasound events and outputs a voltage based on that count to an Onset HOBOdata logger. That voltage is scaled to an Activity Level number representing the number of eventsrecorded. (See a more detailed discussion of the Bat Logger II in the main report [section XXXX]) Thethree other devices are able to represent the frequencies recorded, but the Bat Logger II does not. Inorder to determine its sensitivity at different frequencies the software on the Ultrasound Signal SourceEquipment’s signal controller was modified to output ten pulses at a given frequency based on switchsettings.The Bat Logger II was powered up, then using Onset HOBOware Pro software the integrated data loggerwas launched with a 10 second sampling interval. Promptly after launch, the Ultrasound Signal SourceEquipment’s program was initiated, generating 10 pulses at 25kHz after a five second pause. The datalogger (of the Bat Logger II) was then downloaded when more than 10 seconds had passed sincelaunching, ensuring that the count acquired by the Bat Logger II had been sampled by its data logger(Fig. 6).Appendix X, page 8last revised: Nov 2014
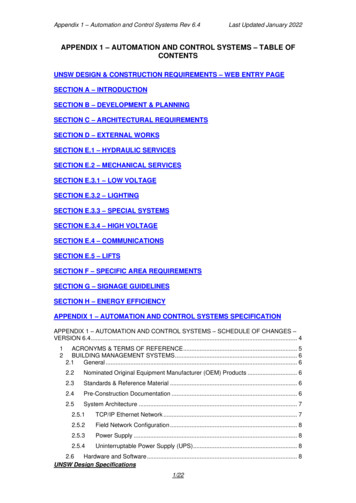
DRAFT – subject to revisionBat Logger II Frequency Sensitivity Test TimelineBat Logger II Power UpHOBO LaunchUltrasound Signal Source Equipment Start10 Pulses at Freq. XHOBO SampleHOBO Readout5 Seconds10 SecondsTime AxisFig. 6. Timeline of events during test of Bat Logger II at one frequency.After a change in switch settings on the controller circuit, the logger was then launched again, testingthe Bat Logger II’s ability to log pulses at 30kHz. This was repeated at 5kHz intervals up to 80kHz. Thesame intensity and orientation changes were made as had been done with the other devices. Thisresulted in 108 files.We manually reviewed the WAVE files of the SM2Bat and D500x devices using Cornell University’s Labof Ornithology sound analysis software, Raven Lite 1.0. We reviewed the AnaBat Roost Logger files onAnalookW software. The Bat Logger II device is designed to use Onset’s HOBOware Pro software forreporting ultrasonic activity.We recorded (counted) the number of pulses (as observed on the sound analysis software) at eachfrequency, intensity, and orientation.IV. RESULTSThe results of the laboratory test of the signal detecting ability of the devices are summarized below.More detailed data and graphs are presented at the end of the Appendix.Bat DetectorsThe graphs presented Figure 1 show how the two bat detectors were able to record/log signals pulsedover the range of frequencies (i.e., 25, 30, 35 80 kHz), at different ultrasound intensities (i.e., high,medium, and low), and at different orientations (angle of incidences between the device and the signalsource).At high signal intensities, the omnidirectional microphone of the SM2Bat detected signals in alldirections (except the 80 kHz signals delivered at a 90o angle).Appendix X, page 9last revised: Nov 2014
DRAFT – subject to revisionThe D500x has a directional microphone and detected high intensity signals at 0o and 45o, but detectedno signals delivered at right angles. Also, the D500x consistently missed the first 3 of the 10 signalsdelivered, regardless of angle or intensity.Neither detector performed well at capturing low intensity signals (200mVpp). Neither detector pickedup any low intensity signals delivered at 90o. The D500x detected no low intensity signals emitted at45o.Signals of medium intensity yielded intermediate detecting abilities from both detectors.Appendix X, page 10last revised: Nov 2014
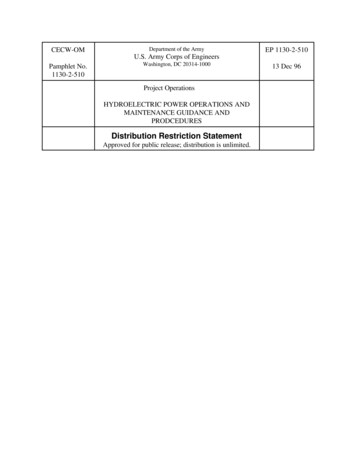
DRAFT – subject to revisionSM2Bat (by Wildlife Acoustics)D500x (by Pettersson Elektronik)Fig. 1. Signal detecting ability of the 2 bat detectors (left: SM2Bat ; right: D500x) ofsignals with varying: frequencies, angles of incidences, and intensities. (More graphs anddata of the lab results are provided at the end of this Appendix.)Bat Data LoggersAs discussed in the main report (see section XXX ), the Bat Logger II device records activity in“levels” or “steps”. Since we delivered 10 pulses to the device, the Bat Logger II should have been ableto detect (and log) signals at either the 3rd step (5-10 pulses) or 4th step (10-20 pulses).Appendix X, page 11last revised: Nov 2014
DRAFT – subject to revisionFigure 2 shows the results of the two data loggers’ signal detecting abilities. The data loggers were ableto detected many high intensity frequencies when the device and transducer were in direct alignment(i.e., 0o angle of incidence). Increasing the angle of incidence or decreasing the signals’ intensitydramatically lessens both data loggers’ signal detection. This results in almost all low intensity signalsgoing undetected, especially if the signals were at an angle to the device.AnaBat Roost Logger (by Titley Scientific)Bat Logger II (by Messina)Fig. 2. Signal detecting ability of the 2 bat data loggers (left: Roost Logger; right: BatLogger II) of signals with varying: frequencies, angles of incidences, and intensities.(More graphs and data of the results are provided at the end of this Appendix.)Detectors verses Data LoggersFigure 3 shows how all of the devices compared against one another. A top down viewing of the matrixhighlights how the devices’ signal detecting abilities compare relative to the intensity of the signals. AAppendix X, page 12last revised: Nov 2014
DRAFT – subject to revisionhorizontal view (i.e., across) focuses on the devices’ differing detecting abilities due to the angle ofincidence.Low Intensity Signals(200 mVpp)Angle of Incidence (0o/ 45o/ 90o)High Intensity Signals(2 Vpp)Signal Intensity (High/Medium/Low)Medium Intensity Signals(600mVpp)Fig. 3. Comparison of all devices showing frequencies detected at various intensities (top down view) anddifferent angle of incidences (across view). SM2 SM2Bat ; RL1 Anabat Roost Logger; BL II Bat LoggerII.V. DISCUSSION/CONCLUSIONDiscussionAs mentioned in the Introduction (section I), we observed that the number of files that each devicegenerated (during the winter 2013 deployment) were markedly different. To further investigate this weperformed this laboratory test to document the devices’ signal detecting abilities by delivering synthetic,known ultrasonic frequencies to the devices at varying angle of incidences and intensities. For thislaboratory test, we used the same settings that the devices had during the field deployment.Appendix X, page 13last revised: Nov 2014
DRAFT – subject to revisionThe two detectors showed distinct differences in their ability to capture the ultrasound signals directedat them (Fig. 1). In large part this is likely due to differences in microphone type and differences indevice configuration.A notable observation regarding the D500X was that it consistently recorded only the trailing sevenpulses, completely missing the initial three. Based upon the settings used each detector showed that atthe highest intensity sound level, and when aligned (i.e., zero degrees) to the sound source, both wereable to record all frequencies tested. At moderate signal intensities (600mVpp), the D500x recorded atall frequencies, whereas the SM2Bat stopped recording frequencies higher than 65kHz. The SM2Bat ’somnidirectional microphone clearly shows an advantage at off axis recording. The D500X showed thatoff axis and at middle intensity level it would record lower frequencies. Throughout the test, of the twodetectors tested, the SM2Bat showed the best ability to record a broad range of frequencies.Both detectors only sparsely detected low intensity signals. It is noteworthy that neither detectorcaptured low intensity signals that were at right angles of the device.The two data loggers tested also showed obvious differences (Fig. 2). The AnaBat Roost Logger loggedall high intensity frequencies (except 25kHz) when aligned (0o angle) to the device. At medium andlower intensities and off axis its range of frequencies narrowed and centered around 40kHz. The BatLogger II microphone apparently has resonance issues around both 30kHz and 50kHz, since no pulseswere logged at these frequencies. Although no pulses higher than 60kHz were logged, it did showreception of a broader range of frequencies than the AnaBat Roost Logger at lower intensities and offaxis.ConclusionBased on these data, it is clear that in the field each device will have different results based on callintensity and orientation of the microphone relative to the bat. The obvious implication of the data isthat different bat detector brands should not be expected to perform similarly and bat data loggers donot mimic bat detectors. As such, any detector or data logger based surveys must make an effort tostandardize the brand of the device used. Switching devices and/or using non-standardized equipment(especially in a large scale sampling effort) will likely result in widely differing results of bat activity.(Also see conclusions in Waters and Walsh 1994:219.)This laboratory study illustrates that the different devices have strengths and weakness that theindividual user must carefully consider in order to use these tools for gathering reliable, valid bat activitydata.Appendix X, page 14last revised: Nov 2014
DRAFT – subject to revisionVI. LITERATURE CITEDAdams, A.M., M.K. Jantzen, R.M. Hamilton, and M.B. Fenton. 2012. Do you hear what I hear?Implications of detector selection for acoustic monitoring of bats. Methods in Ecol. & Evol.3:992-998.Downes, C.M. 1982. A comparison of sensitivities of three bat detectors. J. Mammal. 62: 343-345.Forbes, B. and W. M. Newhook. 1990. A comparison of the performances of three models of batdetectors. Jour. Mammal. 71:108–110Solick, D., C. Nations., and J. Gruver. 2011. Activity rates and call quality by different bat detectors.Western EcoSystems Technology (WEST), Inc. Power Point presentation made at the 41stAnnual Symposium of the North American Society for Bat Research (NASBR), Toronto, Ontario.26-29 October 2011. Presentation obtained from Solick (dsolick@west-inc.com) in Sept. 2013.Waters, D. A. and A. L. Walsh. 1994. The influence of bat detector brand on the quantitative estimationof bat activity. Bioacoustics 5:205–221.Appendix X, page 15last revised: Nov 2014
DRAFT – subject to revisionSUMMARY OF DATACHARTS & TABLESOFLABRATORY TEST OF BAT DETECTORS AND BAT DATALOGGERS’ABILITY TO CAPTURE ULTRASOINC SIGNALSSee Lab Test – Charts & TablesAppendix X, page 16last revised: Nov 2014
More recent evaluations of newer models of bat detectors are provided by Solick et al (2011) and Adams et al (2012). Solick et al (2011) performed a side-by-side comparison of selected bat detectors (AnaBat's SD1, Wildlife Acoustics' SM2, Petterss on's D500x, and Binary Acoustics AR125) that confirmed different