Transcription
Owens CorningPositioned for GrowthQ3 2014This presentation shared at the following event:09/22/2014Owens Corning Roadshow – Milwaukee/ChicagoThierry Denis, Director IR09/19/2014Zelman Housing Summit – Tysons Corner, VAMike Thaman, Chief Executive Officer09/09/2014OC Roadshow hosted by Bank of America – BostonMike Thaman, Chief Executive Officer
Forward-Looking Statementsand Non-GAAP MeasuresThis presentation consists of this slide deck and the associated remarks and comments, all of which are integrally related and are intendedto be presented and understood together.This presentation contains forward-looking statements within the meaning of the Private Securities Litigation Reform Act of 1995. Forwardlooking statements can be identified by words such as “believe,” “anticipate,” “appear,” “may,” “will,” “should,” “intend,” “plan,” “estimate,”“expect,” “assume,” “seek,” “forecast,” and similar reference to future periods. We caution you against relying on these statements as theyinvolve risks and uncertainties that are difficult to predict and the Company’s actual results may differ materially from those projected inthese statements. Our future performance may be affected by risks and uncertainties including, without limitation, economic and politicalconditions, including; levels of residential and commercial construction activity; competitive factors; levels of global industrial production;relationships with key customers; industry and economic conditions that affect the market and operating conditions of our customers,suppliers or lenders; availability and cost of credit; our level of indebtedness; weather conditions; pricing factors; availability and cost ofenergy and raw materials; difficulties managing production capacity; issues involving implementation of new business systems; newlegislation or other governmental actions; labor disputes and litigation; our ability to use our net operating loss carry-forwards; research anddevelopment activities; foreign exchange fluctuations; interest rate movements; labor disputes; issues related to acquisitions, divestituresand joint ventures; uninsured losses; achievement of expected synergies, cost reductions and/or productivity improvements; defined benefitplan funding obligations; and, factors detailed from time to time in the company’s Securities and Exchange Commission filings.For purposes of this presentation, any discussion referring to “year to date” or last twelve months (“LTM”) refers to the period ended on thelast calendar day of the quarter preceding the date of the investor event referred to on the first page of this document. Otherwise theinformation in this presentation speaks as of the date of the investor event, and is subject to change. The Company does not undertake anyobligation to update or revise forward-looking statements beyond what is required under applicable securities laws. Any distribution of thispresentation after the date of the investor event is not intended and should not be construed as updating or confirming such information.This presentation contains references to certain "non-GAAP financial measures" as defined by the SEC. Management uses non-GAAPmeasures for various purposes, including reporting results of operations to the Board of Directors, analysis of performance and relatedemployee compensation measures. Although management believes these measures, and exclusions from GAAP therein, provide a usefulrepresentation of performance, non-GAAP measures should not be considered in isolation or as a substitute for GAAP measures. Areconciliation of these non-GAAP financial measures to their most directly comparable financial measures calculated and presented inaccordance with generally accepted accounting principles can be found in Appendix A. Adjusted EBIT is earnings before interest, taxes andother items that management does not allocate to our segment results because it believes they are not a result of the Company’s currentoperations.2
Owens Corning at a Glance Founded in 1938, an industry leader in glassfiber insulation, roofing and glass fiberreinforcements 2013 net sales: 5.3 billion 15,000 employees in 27 countries Fortune 500 company for 60 consecutiveyears Component of Dow Jones SustainabilityWorld Index for five consecutive years3
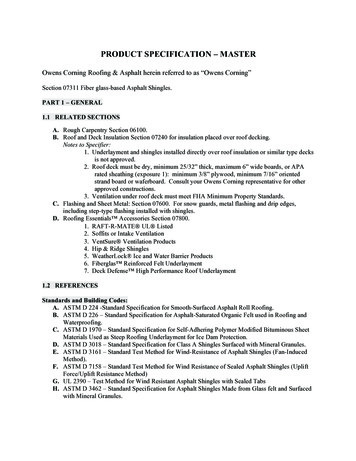
Investment HighlightsCompositesRoofingMarket-leading businesswith improving economicconditions and higherutilization ratesStrong businessperformance in arecovering U.S. housingmarketInsulationProgress supportsconfidence in return tohistorical profitabilityThree Market-Leading Businesses4
Outlook and Highlights Continued to focus on building a safer workplace; year-to-datesafety performance consistent with prior year Delivered adjusted EBIT of 96 million Insulation grew EBIT by 14 million, marking the 12thconsecutive quarter of performance improvement Composites delivered EBIT of 37 million on improved pricing,operating performance, and volumes Roofing volume weakness continued; market share improvedversus first quarter but still below historical levels5
Strong PortfolioPositioned for 2 ’13InsulationRoofingCompositesMargin 10%0% Margin 10%Margin 0%Sources: Owens Corning’s SEC filings since 2006 . For comparability purposes, prior years have been provided based on Owens Corning’s SEC filings, internal managementreports, and management estimates.6
Insulation BusinessQ2 2014 Highlights (in millions)Q2 2014Q2 20131H 20141H 2013Net sales* 447 415 802 745EBIT 18 4 19 (17)EBIT as % ofsales4%1%2%(2)%D&A 26 27 51 5312thDeliveredconsecutive quarter of EBITimprovement Improved EBIT by 14 million on higher pricingand volume growth Expect 2014 results to benefit from growth in U.S.new construction, pricing and operating leverage* before inter-segment eliminationsFive-Year Financial Performance2013 Revenue by End Market*U.S. & CanadaCommercial& Industrial24%U.S .& CanadaResidential Repair& Remodeling20%U.S. & CanadaNew ResidentialConstruction40%International16%*Owens Corning management estimates; estimated error margin below 5%Source: Owens Corning management estimates and Owens Corning SEC filings; comparability may differ over time 2,00010% 1,5005% 1,0000% 500-5% 0-10%20102011Sales*20122013LTMEBIT as % of sales*In millions7
Owens Corning InsulationEBIT ProgressQ1Q2Q3Q439 40EBIT in Millions of Dollars1818 20413 0- 20-16-21-34- 40- 60- 8090-12-38-472011 Actual2012 Actual2013 Actual2014 ActualConsistent Quarterly EBIT Progression Since 2011Source: Owens Corning quarterly and annual SEC filings8
Owens Corning InsulationWell Positioned to Return to Historical Margins30%EBIT MarginAvg EBIT Margin '85-'08 (15%)20%10%0%-10%'84 '86 '88 '90 '92 '94 '96 '98 '00 '02 '04 '06 '08 '10 '12 '14LTMHistorically Delivered 15% EBIT Margins at 1.5 Million Housing StartsSource: Owens Corning management estimates and Owens Corning SEC filings, comparability may differ over time;9
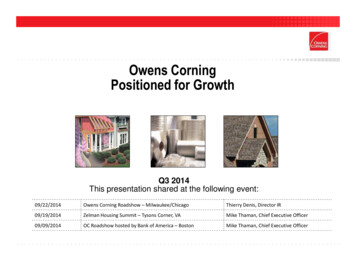
Insulation IndustryNorth American Fiberglass100%2014 Industry Capacity Utilization80%75%90%65%60%40%20%0%Total CapacityOperating PlantsOperating LinesCapacity Utilization Tightening as U.S. Housing RecoversSource: Owens Corning management estimates as of February 2014 rounded to nearest 5%. Products sold primarily to North American residential market. Excludes heavy density andloosefill products. Based on 2014 estimate of 1.1MM unlagged U.S. housing starts and other macro assumptions.10
Owens Corning InsulationNorth American Fiberglass NetworkEdmontonCandiacTorontoDelmarSanta ClaraNephiKansas CityMt. VernonNewarkEloy2014 Estimated Average Utilization:Near full capacityBelow full capacityNot in operationWaxahachieFairburnLakelandContinued Discipline in OC Capacity ManagementCapacity utilization based as on estimated average 2014 total insulation production using melter capacitySource: Owens Corning management estimates11
Positioned to Grow with Our MarketsInsulation End-UseMarkets% of Full-Year 2013 RevenueU.S. and CanadaResidential New Construction40%U.S. and CanadaRepair and Remodel20%U.S. and CanadaCommercial and Industrial24%Latin Americaand Asia Pacific16%Expected MarketGrowth DriversRevenue CAGR2013 – 2015 Housing starts Building energy code adoption Household formation10-25% Aging housing stock Energy efficiency policies0-10% Code and “green”specification driven Owner/operator focus5-10% Growing middle class Infrastructure improvements Urbanization of China0-10%Continued Double-Digit Revenue Growth as Market RecoversSource: Owens Corning management estimates.CAGRs as of September 2013; estimated error margin of end-use market revenue below 5%12
Roofing BusinessQ2 2014 Highlights (in millions) Revenue down 14% primarily on weak shipments Delivered 14% EBIT margins on lower volumeleverage, lower prices, and higher asphalt costs Expect full-year market to be flat to slightly downfrom 2013Q2 2014Q2 20131H 20141H 2013Net sales* 437 508 934 1,115EBIT 62 116 142 235EBIT as % ofsales14%23%15%21%D&A 10 9 19 19* before inter-segment eliminationsFive-Year Financial Performance2013 Revenue by End Market*U.S. & CanadaResidential Repair& Remodeling74%U.S. & CanadaCommercial& Industrial15%U.S. & CanadaNew ResidentialConstruction10%International1%*Owens Corning management estimates; estimated error margin below 5%Source: Owens Corning management estimates and Owens Corning SEC filings; comparability may differ over time 2,40030% 2,00025% 1,60020% 1,20015% 80010% 4005% 00%20102011Sales*20122013LTMEBIT as % of sales*In millions13
U.S. Asphalt Shingle CERTAINTEEDTAMKOCELOTEXMANVILLEIKOBIRDATLASGEORGIA EEDTAMKOCELOTEXMANVILLEIKOBIRDATLASGEORGIA IKOATLASGEORGIA PACIFICGS ROOFINGLUNDAY THAGARDCUSTOM ROOFINGBIG CHIEFBEARPHILIP CAREYPABCOMALARKEYLUNDAY THAGARDCUSTOM COMALARKEYGLOBEPABCOMALARKEYTop 90%1613104Total2117138Favorable Industry Structure for the FutureSource: Owens Corning management estimates and various industry sources and publications14
U.S. Asphalt Shingle MarketMajor StormsMM Sq.MMRe-roof Demand180188New l7.5873Total Existing Home urce: Asphalt Roofing Manufacturers Association, Summary of Asphalt Roofing Industry Shipments. National Association of Realtors existing home sales and Owens Corning management estimates15
Great Business in Well-Structured Industry Track record of strong financial performance– Delivered average operating margins in excess of 20% during2009-2013 period Re-roof demand over the last few years has been sluggish– Housing activity forecasts support some demand growth– Glass fiber mat and laminate advancements in the 1980s and1990s could be extending replacement cycle Confidence in average operating margins of mid-teens orbetter over the mid term16
Composites SegmentQ2 2014 Highlights (in millions)Delivered EBIT of 37 million on improved pricing,operating performance, and volumes Planned furnace rebuilds under way; anticipaterebuild costs to peak in Q3 Progress in pricing supports outlook for full-yearimprovement at the top end of 20 million to 30million rangeQ2 2014Q2 20131H 20141H 2013Net sales* 505 472 982 931EBIT 37 32 64 41EBIT as % ofsales7%7%7%4%D&A 34 34 68 66* before inter-segment eliminationsFive-Year Financial Performance2013 Revenue by End Market*U.S. & CanadaCommercial& Industrial27%U.S. & CanadaResidential Repair& Remodeling10%U.S. & CanadaNew ResidentialConstruction3% 2,40015% 1,80010% 1,2005% 6000%International60% 0-5%2010*Owens Corning management estimates; estimated error margin below 5%Source: Owens Corning management estimates and Owens Corning SEC filings; comparability may differ over time2011Sales*20122013LTMEBIT as % of sales*In millions17
Glass FiberA 7 Billion Global Market Appliances Electronics Recreation Residential Commercial Water transportation& 4%Transportation28% Factories Mining Offshore platforms Cars Trucks, buses, trains MarineA Key Material Enabling Solutions Essential to Everyday LifeGlass reinforcements market defined as glass fiber reinforcements and direct conversion products as consumed, excluding yarnsSource: Owens Corning management estimates as of Feb 201418
Owens Corning CompositesPositioned to Win#1 PositionEmerging Position#1 Position#1 PositionOC glass fiber manufacturing siteOC downstream fabrication siteLeading Market Positions and an Unrivaled Supply NetworkSources: Owens Corning management estimates% Market Revenue market revenue in region as % of 2013 global market size% OC Revenue OC revenue in region as % of OC Composites global 2013 salesGlass reinforcements market defined as glass fiber reinforcements and direct conversion products as consumed, excluding yarns19
Glass Fiber Market Demand5,000Glass Fiber Demand Has Grown at 1.6 Multipleof Industrial Production GrowthGlass Fiber K ical Glass Fiber Market Growth Averaging 5%Glass fiber market demand excludes E-glass yarnsSources: Fiber Economics Bureau, Glass Fiber Europe, Global Trade Information Services, Inc. and Owens Corning management estimates20
Glass Fiber Industry PhasesSigns of a New ityOverbuildExcessInventoryImprovedReturns2005 – 20092010 – 20122013 – 2016High Utilization Rates and Reinvestment EconomicsSupport Higher Returns21
Glass Fiber IndustryEstimated Capacity2004200620082010201220142016100%Estimated Capacity Utilization1.7SupplyTension90%90% Threshold1.180%Change in globaldemand (MM T)0.9Change in globalcapacity (MM T)70%0.50.50.4(high probabilityadditions)60%0.1/ yr0.3/ yr0.4/ yr0.1/ yr0.2/ yr0.1/ yr50%2005-092010-122013-16Tighter Capacity Environment Expected in the Near TermGlass fiber market demand excludes E-glass yarnsSources: Fiber Economics Bureau, Glass Fiber Europe, Global Trade Information Services, Inc. and Owens Corning management estimates as of September 201422
Price Realization2007 – 200820092010 – 20112012 – 2013EBITMarginIndustryCapacityUtilization Historical highsin China Global 30-yearlows Widespread idleand curtailedfactories China delaysstartups Global tightness Sharp recoverycauses supplyshock Demand outpacesrestart of idlecapacity China capacity alloperational Europe negative;slower global growth Large inventorybuildsOC Pricing 100MM gain 50MM loss 100MM gain 30MM loss(all in 2012)Margin: 10% Margin: 0% - 10%Margin: 0%Tight Industry Capacity has ProvidedSignificant Pricing Opportunity in the Recent PastSources: Owens Corning’s SEC filings since 2006. For comparability purposes, prior years have been provided based on Owens Corning’s SEC filings, internal managementreports, and management estimates.23
Owens Corning Composites Global megatrends, continuedgrowth in industrial production,and material substitution supportglass fiber market growth at a5-7% CAGRStrategic focus on core buildingmaterial markets withsustainable solutionsCost LeadershipPrice RealizationProduct LeadershipCapital EfficiencyClear agenda to deliverimproved returnsLeader in an Industry Entering a Phase of Supply TensionSource: Owens Corning management estimates as of February 201424
Sustaining a Strong Balance Sheet Maintaining investment-grade financial strength is a pillar ofOwens Corning’s strategyMaintained investment-grade credit ratings from Standard &Poor's and Fitch 800 million revolving credit facility maturing in 2018 250 million accounts receivable facility, which maturesin 2016 1.8 billion senior notes outstanding with 2016, 2019, 2022and 2036 maturitiesSustaining ample liquidity to support growth Capital markets remain open to Owens Corning 25
Tax Position is a Significant Asset Benefit from 2.1 billion NOL with estimated present value ofapproximately 5 per share Delivering cash tax savings of about 60 million per year Expect long-term book tax rate of 28% to 30% basedon geographic mix of earnings and tax planning Cash tax rate of 10% to 12% over the next few yearsSource: Owens Corning management estimates26
Disciplined Capital Allocation Strategy Drive shareholder returns by enabling organic and inorganicgrowth and supporting the balance sheet– Maintain investment grade Capital allocation strategy– Investing in attractive organic growth– Returning excess cash to shareholders– Pursuing value-creating acquisitions Quarterly dividend initiated in 2014 conveys confidence inlong-term financial outlook and cash flow generation As of June 30, 2014, 7.7 million shares remain available forrepurchase under existing authorization27
Key Financial Data( in millions, except per share data)Q2 2014Q2 20131H 20141H 2013 1,355 1,347 2,633 2,697 21 49 141 71 0.18 0.41 1.19 0.59Earnings before interest and taxes (EBIT) 73 118 181 175Adjusted EBIT 96 124 173 201Adjusted Earnings 45 68 80 103 0.38 0.56 0.68 0.867%9%7%7%Marketing and administrative expenses 130 134 262 267Depreciation and amortization 78 79 154 157Cash flow from (used for) operating activities 155 164 (117) (15)Total debt (excluding rate swap), net of cash 2,194 2,180 2,194 2,180Net salesNet earnings attributable to Owens CorningDiluted earnings per share attributable to OwensCorning common stockholdersAdjusted EPS (diluted)Adjusted EBIT as a % of sales28
Appendix ANon-GAAP Reconciliations29
Appendix ANon-GAAP Reconciliations30
Source: Owens Corning management estimates and Owens Corning SEC filings, comparability may differ over time; 9 Historically Delivered 15% EBIT Margins at 1.5 Million Housing Starts 2014 Industry Capacity Utilization 65% 75% 90% 60% 80% 100% Insulation Industry North American Fiberglass 0% 20% 40% Total Capacity Operating Plants Operating Lines 10