Transcription
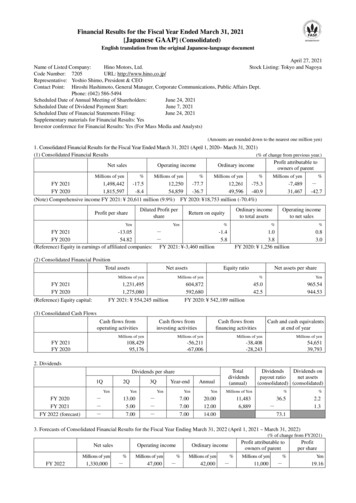
Financial Results for the Fiscal Year Ended March 31, 2021[Japanese GAAP] (Consolidated)English translation from the original Japanese-language documentApril 27, 2021Name of Listed Company:Hino Motors, Ltd.Stock Listing: Tokyo and NagoyaCode Number: 7205URL: http://www.hino.co.jp/Representative: Yoshio Shimo, President & CEOContact Point: Hiroshi Hashimoto, General Manager, Corporate Communications, Public Affairs Dept.Phone: (042) 586-5494Scheduled Date of Annual Meeting of Shareholders:June 24, 2021Scheduled Date of Dividend Payment Start:June 7, 2021Scheduled Date of Financial Statements Filing:June 24, 2021Supplementary materials for Financial Results: YesInvestor conference for Financial Results: Yes (For Mass Media and Analysts)(Amounts are rounded down to the nearest one million yen)1. Consolidated Financial Results for the Fiscal Year Ended March 31, 2021 (April 1, 2020– March 31, 2021)(1) Consolidated Financial Results(% of change from previous year.)Profit attributable toNet salesOperating incomeOrdinary incomeowners of parent%Millions of yen%FY 20211,498,442-17.512,250-77.712,261-75.3FY 20201,815,597-8.454,859-36.749,596-40.9(Note) Comprehensive income FY 2021: 20,611 million (9.9%) FY 2020: 18,753 million (-70.4%)Millions of yen%Millions of yen%-7,48931,467--42.7Diluted Profit pershareProfit per shareYenMillions of yenOrdinary incometo total assetsReturn on equityYen%Operating incometo net sales%FY 2021-13.05--1.4FY 202054.82-5.8(Reference) Equity in earnings of affiliated companies: FY 2021: -3,460 million%1.03.8FY 2020: 1,256 million0.83.0(2) Consolidated Financial PositionTotal assetsNet assetsMillions of yenFY 2021FY 2020(Reference) Equity capital:Equity ratioNet assets per shareMillions of yen1,231,4951,275,080FY 2021: 554,245 million604,872592,680FY 2020: 542,189 million%Yen45.042.5965.54944.53(3) Consolidated Cash FlowsCash flows fromoperating activitiesCash flows frominvesting activitiesCash flows fromfinancing activitiesCash and cash equivalentsat end of yearMillions of yenMillions of yenMillions of yenMillions of 39,793FY 2021FY 20202. DividendsDividends per share1Q2QYenFY 2020FY 2021FY 2022 al)DividendsDividends onpayout rationet assets(consolidated) (consolidated)Millions of Yen20.0012.0014.0011,4836,889%%36.52.21.3-73.13. Forecasts of Consolidated Financial Results for the Fiscal Year Ending March 31, 2022 (April 1, 2021 – March 31, 2022)(% of change from FY2021)Net salesMillions of yenFY 20221,330,000Operating income%-Millions of yen47,000Profit attributable toowners of parentOrdinary income%-Millions of yen42,000%-Millions of yen11,000%-Profitper shareYen19.16
(Note) Accounting Standard for Revenue Recognition (ASBJ Statement No. 29, March 30, 2018) will be applied at the beginning ofFY ending March 2022. The forecast above reflects application of the standard, so % of change from FY2021 is not stated.*Notes(1) Changes in significant subsidiaries (changes of specified subsidiaries resulting in changes in scope of consolidation) during thecurrent term: None(2) Changes in accounting policies, accounting estimates and restatements:1) Changes in accounting policies due to revisions of accounting standards:2) Changes in accounting policies due to reasons other than above 1):3) Changes in accounting estimates:4) Restatements:(3) Number of outstanding shares (common stock)1) Number of outstanding shares (including treasurystock) at end of term2) Number of treasury stock at end of term3) Average number of sharesNoneNoneNoneNoneFY 2021574,580,850 sharesFY 2020574,580,850 sharesFY 2021552,655 sharesFY 2020551,510 sharesFY 2021574,028,861 sharesFY 2020574,017,067 shares(Reference) Overview of Non-Consolidated Financial Results1. Non-Consolidated Financial Results for the Fiscal Year Ended March 31, 2021 (April 1, 2020 – March 31, 2021)(1) Non-Consolidated Financial Results(% of change from previous year.)Net salesOperating incomeOrdinary incomeProfitFY 2021FY 2020Millions of yen%Millions of yen%Millions of yen%Millions of d Profitper shareProfit per shareYenFY 2021FY 2020(2) Non-Consolidated Financial PositionTotal assetsFY 2021FY 2020(Reference) Equity capital:Yen--4.9348.54Net assetsEquity ratioNet assets per shareMillions of yenMillions of yen%Yen809,768421,43652.0734.01412,393FY 2020: 412,393 million50.7718.26813,852FY 2021: 421,436 million Reasons for the difference in non-consolidated results from the previous fiscal year In FY2021, Net sales fell below the previous year's results due to a decrease in domestic and export volume.Profit also decreased year on year due to a decrease in sales and Expenditure related to transactions in North America described inAdditional Information on page 13 of the [Attachment].* Summary of financial results is out of scope of audit by Certified Public Accountants or Audit companies.* Statement regarding the proper use of financial forecasts and other remarksDescriptions regarding the future, including the financial projections contained in this report, are based on certain assumptionscurrently available to the Company, which are, at the discretion of the Company, deemed reasonable, and the Company gives noguarantees that it will achieve these results. In addition, actual financial results may significantly vary due to various factors. Forassumptions used in forecasting financial results and precautions in using the financial projections, please refer to Appendix onPage 3, “1. Business Performance Overview; (4) Future Outlook.”
Hino Motors, Ltd. (7205) Financial Results for the Fiscal Year Ended March 31, 2021AppendixTable of contents of the appendix1 Operating Results Overview . 2(1) Operating Results Overview for Current Term . 2(2) Financial Position Overview for Current Term . 2(3) Cash Flow Overview for Current Term . 2(4) Forecasts for the Fiscal Year Ending March 31, 2022 . 3(5) Basic Policy on Profit Distribution and Dividends for FY2021 and FY2022 . 32 Basic Policy on Selection of Accounting Standards . 33 Consolidated Financial Statements . 4(1) Consolidated Balance Sheets . 4(2) Consolidated Statements of Income and Consolidated Statements of Comprehensive Income . 6(3) Consolidated Statements of Changes in Net Assets . 9(4) Consolidated Statements of Cash Flows . 11(5) Notes to Consolidated Financial Statements . 13(Notes on Going Concern Assumption) . 13(Additional information) . 13(Contingent liabilities) . 13(Segment Information) . 13(Per Share Information) . 15(Significant Subsequent Events) . 154 Other . 16(1) Actual Production (Consolidated) . 16(2) Actual Sales (Consolidated) . 16-1-
Hino Motors, Ltd. (7205) Financial Results for the Fiscal Year Ended March 31, 20211. Operating Results Overview(1) Operating Results Overview for Current TermAs for the Japanese domestic truck market in this consolidated fiscal year, due to the impact of COVID-19, the totaldemand for heavy- and medium-duty trucks was 85.9 thousand units, a decrease of 6.0 thousand units (-6.5%)compared to the previous year, and total demand for light-duty truck was 86.0 thousand units, a decrease of 17.3thousand units (-16.8%) compared to the previous year. However, the market share of light-, medium-, and heavy-dutytrucks in Japan was 33.6%, following the record high in fiscal 2018, thanks to the steady sales. As for Japanesedomestic sales, due to the aforementioned decrease in demand, the total sales volume of heavy-, medium-, and lightduty trucks and buses was 59.6 thousand units, a decrease of 6.9 thousand units (-10.4%) compared to the previous year.As for overseas sales, sales volume declined due to COVID-19, and the company conducted inventory adjustment, sosales volume was 73.6 thousand units, a decrease of 34.1 thousand units (-31.7%) compared to the previous year.As a result of the above, total unit sales of Hino Brand trucks and buses decreased to 133.2 thousand units by 41.0thousand units (23.6%) from the previous fiscal year.As for the volume of sales to Toyota Motor Corporation, because the sales of SUV and light-duty truck decreased,total sales volume decreased to 108.7 thousand units by 30.6 thousand units (-22.0%) from the previous fiscal year.As a result of the above, consolidated net sales were 1,498,442 million, which is a decrease of 317,155 million (17.5%) as compared to the previous fiscal year. As for profits, due to a decrease in the quantity sold of trucks and buses,etc., consolidated operating income was 12,250 million which is a decrease of 42,609 million (-77.7%) as comparedto the previous fiscal year. Ordinary income was 12,261 million which is a decrease of 37,335 million (-75.3%) ascompared to the previous fiscal year. In addition, loss attributable to owners of the parent was 7,489 million yen (profitattributable to owners of the parent amounting to 31,467 million yen in the previous consolidated fiscal year), as anextraordinary loss of 14,556 million yen was posted as expenditure related to transactions in North America.(2) Financial Position Overview for Current TermTotal assets as of the end of this fiscal year decreased to 1,231,495 million by 43,584 million compared to the endof the previous fiscal year. This is mainly because inventories decreased by 61,391 million, while investment securitiesincreased by 15,725 million.Liabilities decreased to 626,622 million by 55,776 million from the end of the previous fiscal year. This is mainlybecause interest-bearing debt decreased by 32,585 million and notes and accounts payable - trade decreased by 9,902million.Net assets increased to 604,872 million by 12,192 million compared to the end of the previous fiscal year. This ismainly because valuation difference on available-for-sale securities increased by 14,257 million and foreign currencytranslation adjustment increased by 5,730 million, while loss attributable to owners of parent of 7,489 million wasrecorded and dividends from retained earnings of 6,889 million were paid.(3) Cash Flow Overview for Current TermCash flows for this fiscal year are as follows.Cash provided by operating activities was 108,429 million. This was mainly due to posting depreciation andamortization of 54,754 million and inventories decreased by 60,232 million.Cash used in investing activities was 56,211 million. This was mainly due to the expenditure of 50,410 million onpurchase of non-current assets centering on production facilities.Cash used in financing activities was 38,408 million. This was mainly due to net decrease in short-term loanspayable of 20,088 million and repayments of long-term loans payable of 13,972 million.As a result, cash and cash equivalents at the end of this fiscal year increased to 54,651 million by 14,858 millioncompared to the end of the previous fiscal year.-2-
Hino Motors, Ltd. (7205) Financial Results for the Fiscal Year Ended March 31, 2021(4) Forecasts for the Fiscal Year Ending March 31, 2022In fiscal 2021, the global economy is expected to recover, thanks to the acceleration of vaccination for COVID-19and the injection of enormous public funds, but the impact of the pandemic is still lingering, and the outlook remainsuncertain, due to various factors, including geopolitical risk and trade friction. Accordingly, we estimate that therecovery of the domestic and overseas markets of trucks and buses will be gentle.Under these circumstances, we re-realized the necessity to accelerate the establishment of a business structure thatwill not be easily affected by market fluctuations, and started structural reform for fortifying our business base andcompetitiveness for achieving sustainable growth last year. From now on, we will accelerate it further and strive toenhance our earning capacity.In addition, our corporate group will keep an eye on the domestic and overseas situations while taking measures tocurb the spread of COVID-19, continue our endeavor to actualize CASE and the carbon neutral actively and steadilyfrom the viewpoint of SDGs, and strive to realize “an affluent, comfortable, sustainable society” set in our mid/longterm management strategy “Challenge 2025.”Accordingly, the earnings forecast for the next term is as follows.(Consolidated Earnings Forecast for the Full Fiscal Year)Net sales . 1,330,000 millionOperating income . 47,000 millionJapan unit sales of trucks and buses .61.0 thousand unitsOverseas unit sales of trucks and buses .89.0 thousand unitsUnit sales of Toyota brand vehicles .118.5 thousand units* The above forecasts are created based on the information available to the company and on certain assumptionsdeemed reasonable, and are not guaranteed to be achieved.(5) Basic Policy on Profit Distribution and Dividends for FY2021 and FY2022Our company will strive to achieve a consolidated payout ratio of 30% stably and continuously, while fortifying itsfinancial standing and considering its business performance, new investments, etc. in each term.As for the term-end dividend for the current term, the board of directors resolved to pay 7 per share and set the dateof payment start at June 7, 2021, at their meeting held on April 27, 2021, while comprehensively considering the abovebasic policy, the business environment surrounding our company, etc. Accordingly, the annual dividend will become 12 per share (down 8 per share from the previous term), as the already-paid interim dividend of 5 per share is added.As for the dividends for the next term, our company plans to pay an annual dividend of 14 per share, which will becomposed of an interim dividend of 7 per share and a term-end dividend of 7 per share2. Basic Policy on Selection of Accounting StandardsAs the Group is not listed on overseas markets, and for ease of comparison with other companies, Japanese standardsare used, and regarding the selection of IFRS (International Financial Reporting Standards), the accounting standardsused by other companies domestically will be considered as we continue to gather information and discuss the issuewith experts, and the decision will be made carefully.-3-
Hino Motors, Ltd. (7205) Financial Results for the Fiscal Year Ended March 31, 20213. Consolidated Financial Statements(1) Consolidated Balance Sheets(Millions of yen)FY 2020(As of March 31, 2020)AssetsCurrent assetsCash and depositsNotes and accounts receivable - tradeLease receivablesMerchandise and finished goodsWork in processRaw materials and suppliesOtherAllowance for doubtful accountsTotal current assetsNon-current assetsProperty, plant and equipmentBuildings and structures, netMachinery, equipment and vehicles, netTools, furniture and fixtures, netLandLeased assets, netConstruction in progressAssets for rent, netTotal property, plant and equipmentIntangible assetsSoftwareLeased assetsOtherTotal intangible assetsInvestments and other assetsInvestment securitiesRetirement benefit assetDeferred tax assetsOtherAllowance for doubtful accountsTotal investments and other assetsTotal non-current assetsTotal assets-4-FY 2021(As of March 31, ,30780119,65716,096-3,005160,857622,8621,231,495
Hino Motors, Ltd. (7205) Financial Results for the Fiscal Year Ended March 31, 2021(Millions of yen)FY 2020(As of March 31, 2020)LiabilitiesCurrent liabilitiesNotes and accounts payable - tradeShort-term borrowingsCurrent portion of long-term borrowingsLease obligationsAccounts payable - otherIncome taxes payableProvision for bonusesProvision for bonuses for directors (and otherofficers)Provision for product warrantiesOtherTotal current liabilitiesNon-current liabilitiesLong-term borrowingsLease obligationsDeferred tax liabilitiesDeferred tax liabilities for land revaluationRetirement benefit liabilityProvision for retirement benefits for directors(and other officers)Asset retirement obligationsOtherTotal non-current liabilitiesTotal liabilitiesNet assetsShareholders' equityShare capitalCapital surplusRetained earningsTreasury sharesTotal shareholders' equityAccumulated other comprehensive incomeValuation difference on available-for-salesecuritiesDeferred gains or losses on hedgesRevaluation reserve for landForeign currency translation adjustmentRemeasurements of defined benefit plansTotal accumulated other comprehensiveincomeNon-controlling interestsTotal net assetsTotal liabilities and net assets-5-FY 2021(As of March 31, 721,231,495
Hino Motors, Ltd. (7205) Financial Results for the Fiscal Year Ended March 31, 2021(2) Consolidated Statements of Income and Consolidated Statements of Comprehensive Income[Consolidated Statements of Income](Millions of yen)FY 2020(From April 1, 2019to March 31, 2020)Net salesCost of salesGross profitSelling, general and administrative expensesSales commissionTransportation and storage costsProvision for product warrantiesAdvertising expensesSalaries and allowancesProvision for bonusesProvision for bonuses for directors (and other officers)Retirement benefit expensesProvision for retirement benefits for directors (andother officers)Rent expensesOtherTotal selling, general and administrative expensesOperating profitNon-operating incomeInterest incomeDividend incomeRental incomeForeign exchange gainsShare of profit of entities accounted for using equitymethodMiscellaneous incomeTotal non-operating incomeNon-operating expensesInterest expensesForeign exchange lossesShare of loss of entities accounted for using equitymethodMiscellaneous expensesTotal non-operating expensesOrdinary profit-6-FY 2021(From April 1, 2020to March 31, 2,44910,01712,261
Hino Motors, Ltd. (7205) Financial Results for the Fiscal Year Ended March 31, 2021(Millions of yen)FY 2020(From April 1, 2019to March 31, 2020)Extraordinary incomeGain on sale of non-current assetsGain on sale of investment securitiesOtherTotal extraordinary incomeExtraordinary lossesLoss on sale and retirement of non-current assetsImpairment lossesExpenditure related to transactions in North AmericaOtherTotal extraordinary lossesProfit (loss) before income taxesIncome taxes - currentIncome taxes - deferredTotal income taxesProfit (loss)Profit attributable to non-controlling interestsProfit (loss) attributable to owners of parent-7-FY 2021(From April 1, 2020to March 31, ,489
Hino Motors, Ltd. (7205) Financial Results for the Fiscal Year Ended March 31, 2021[Consolidated Statements of Comprehensive Income](Millions of yen)FY 2020(From April 1, 2019to March 31, 2020)Profit (loss)Other comprehensive incomeValuation difference on available-for-sale securitiesDeferred gains or losses on hedgesForeign currency translation adjustmentRemeasurements of defined benefit plans, net of taxShare of other comprehensive income of entitiesaccounted for using equity methodTotal other comprehensive incomeComprehensive incomeComprehensive income attributable toComprehensive income attributable to owners ofparentComprehensive income attributable to non-controllinginterestsFY 2021(From April 1, 2020to March 31, ,0021,7102,609
Hino Motors, Ltd. (7205) Financial Results for the Fiscal Year Ended March 31, 2021(3) Consolidated Statements of Changes in Net AssetsPrevious Fiscal Year (From April 1, 2019 to March 31, 2020)Shareholders' equityShare capitalBalance at beginning of period72,717Capital surplus66,275RetainedearningsTreasury illions of yen)Accumulated othercomprehensive incomeValuationDeferred gainsdifference onor losses onavailable-forhedgessale securities42,899-64-5,2462837,653-36Changes during period-16,075Dividends of surplusProfit attributable to owners ofparent-16,07531,46731,467-0Purchase of treasury sharesDisposal of treasury shares24Change in ownership interest ofparent due to transactions withnon-controlling interests-Total changes during periodBalance at end of period19-1,470Net changes in items other thanshareholders' 0,781-196528,132-5,246Accumulated other comprehensive ionreserve forlandBalance at beginning of period2,325Changes during periodRemeasurements of definedbenefit erestsothercomprehensiveincome28,48253,809Profit attributable to owners ofparent31,467-0Purchase of treasury sharesDisposal of treasury shares44Change in ownership interest ofparent due to transactions withnon-controlling interests-1,470Net changes in items other thanshareholders' equityBalance at end of period596,459-16,075Dividends of surplusTotal changes during periodTotal net 5-3,318-3,77828
Hino Motors, Ltd. (7205) Financial Results for the Fiscal Year Ended March 31, 2021Current Fiscal Year (From April 1, 2020 to March 31, 2021)Shareholders' equityShare capitalBalance at beginning of period72,717Capital surplus64,830RetainedearningsTreasury illions of yen)Accumulated othercomprehensive incomeValuationDeferred gainsdifference onor losses onavailable-forhedgessale securities37,653-3614,257-139Changes during period-6,889Dividends of surplusLoss attributable to owners ofparent-6,889-7,489Purchase of treasury sharesChange in ownership interest ofparent due to transactions withnon-controlling interests-1944-7,489-1944Net changes in items other thanshareholders' equity-94472,71765,775Total changes during periodBalance at end of 11Accumulated other comprehensive ionreserve forlandBalance at beginning of period2,325Changes during period-14,601Remeasurements of definedbenefit sothercomprehensiveincome14,05750,491Loss attributable to owners ofparent-7,489-1Purchase of treasury sharesChange in ownership interest ofparent due to transactions withnon-controlling interests944Net changes in items other thanshareholders' equityBalance at end of period592,680-6,889Dividends of surplusTotal changes during periodTotal net 139-175
Hino Motors, Ltd. (7205) Financial Results for the Fiscal Year Ended March 31, 2021(4) Consolidated Statements of Cash Flows(Millions of yen)FY 2020(From April 1, 2019to March 31, 2020)Cash flows from operating activitiesProfit (loss) before income taxesDepreciationImpairment lossesIncrease (decrease) in allowance for doubtfulaccountsIncrease (decrease) in provision for productwarrantiesIncrease (decrease) in retirement benefit liabilityInterest and dividend incomeInterest expensesForeign exchange losses (gains)Share of loss (profit) of entities accounted forusing equity methodLoss (gain) on sale of investment securitiesLoss (gain) on sale and retirement of non-currentassetsDecrease (increase) in trade receivablesDecrease (increase) in lease receivablesDecrease (increase) in inventoriesIncrease (decrease) in trade payablesDecrease (increase) in other current assetsIncrease (decrease) in other current liabilitiesOther, netSubtotalInterest and dividends receivedProceeds from insurance incomeInterest paidIncome taxes refund (paid)Net cash provided by (used in) operatingactivitiesCash flows from investing activitiesPayments into time depositsProceeds from withdrawal of time depositsPurchase of property, plant and equipmentProceeds from sale of property, plant andequipmentPurchase of intangible assetsPurchase of investment securitiesProceeds from sale of investment securitiesLong-term loan advancesProceeds from collection of long-term loansreceivablePurchase of shares of subsidiaries resulting inchange in scope of consolidationOther, netNet cash provided by (used in) investingactivitiesFY 2021(From April 1, 2020to March 31, 8944,107-37748108,4291,2241,32110
Hino Motors, Ltd. (7205) Financial Results for the Fiscal Year Ended March 31, 2021(Millions of yen)FY 2020(From April 1, 2019to March 31, 2020)Cash flows from financing activitiesNet increase (decrease) in short-term borrowingsProceeds from long-term borrowingsRepayments of long-term borrowingsProceeds from share issuance to non-controllingshareholdersDividends paidDividends paid to non-controlling interestsPurchase of shares of subsidiaries not resulting inchange in scope of consolidationPayments from changes in investments in capitalin subsidiaries that do not result in change inscope of consolidationOther, netNet cash provided by (used in) financingactivitiesEffect of exchange rate change on cash and cashequivalentsNet increase (decrease) in cash and cash equivalentsCash and cash equivalents at beginning of periodCash and cash equivalents at end of periodFY 2021(From April 1, 2020to March 31, 12-1,2821,048
Hino Motors, Ltd. (7205) Financial Results for the Fiscal Year Ended March 31, 2021(5) Notes to Consolidated Financial Statements(Notes on Going Concern Assumption)There is no related information.(Additional information)1. Accounting estimates considering the effects of COVID-19Our corporate group assumes that the effects of COVID-19 will linger throughout the following consolidated fiscalyear, and estimates that the economic recovery will be gentle in both domestic and overseas markets
As for the Japanese domestic truck market in this consolidated fiscal year, due to the impact of COVID-19, the total demand for heavy- and medium-duty trucks was thousand un85.9 its, a decrease of thousand units 6.0 (-6.5%) compared to the previous year, and total demand for light-duty truck was thousand units, a decrease of 86.0 17.3