Transcription
Original ArticleEvaluation of trade-offs betweenworkflow escalation strategiesConcurrent Engineering: Researchand Applications2014, Vol. 22(1) 77–88Ó The Author(s) 2013Reprints and OI: 10.1177/1063293X13516965cer.sagepub.comYain-Whar Si1, Marlon Dumas2 and Ka-Leong Chan1AbstractWorkflows in the service industry are subject to exceptional circumstances that affect the ability to complete work in atimely manner. For instance, workflows may need to deal with sudden spikes in customer demand due to a variety ofevents such as promotional deals, product launches, major news, or natural disasters. Escalation strategies can be incorporated into the design of a workflow so that it can cope with sudden spikes in the number of service requests whilemitigating the effects of missed deadlines. In this article, we propose a method for evaluating escalation strategies usingsimulation technology. The effectiveness of the proposed method is demonstrated on a workflow from an insurancecompany.KeywordsEscalation strategy, workflow management, simulation, key performance indicatorsIntroductionBusiness processes in the service industry are vulnerableto sudden increase in demand due to exceptional circumstances. For example, in the insurance industry,severe flooding caused by heavy rain may lead to sudden spikes in insurance claims. In order to cope withsuch spikes, insurers need to rapidly adapt their operations, for example, by incorporating escalation strategies into their workflows.In the context of workflow management, an escalation is an action performed when a workflow executionis delayed to the extent that it is not on track to meet itsdeadline (Van der Aalst et al., 2007). For example, inan insurance claim workflow, an escalation is to redeploy staff from other departments into the call centersor to require less information from callers when lodginginsurance claims so that more claims can be recorded.The decision on whether or not to escalate, and how,needs to consider the cost of missing the deadline (e.g.lower customer services standards) and the cost of escalating (e.g. additional staff costs).Several escalation strategies have been proposed inthe literature (Panagos and Rabinovich, 1996, 1998;Van der Aalst et al., 2007), each one with its owntrade-offs. In a previous work (Chan et al., 2009), asimulation-based method for evaluating four deadlineescalation strategies proposed in the literature(Panagos and Rabinovich, 1996, 1998; Van der Aalstet al., 2007) was presented as follows:S1: Alternative path selection (Van der Aalst et al.,2007). An alternative execution path is taken to accelerate the execution in order to meet a deadline (at thedetriment of additional cost or reduced quality).S2: Resource redeployment (Van der Aalst et al., 2007).Resources (workers) are moved from one resource poolto another in order to accelerate certain tasks that maycause some workflow cases to run late.S3: Data degradation (Van der Aalst et al., 2007). Dataentry or data checking steps are performed in a minimalistic manner or postponed to a late stage in orderto meet a deadline.S4: Early escalation (Panagos and Rabinovich, 1996,1998). Continuous monitoring and prediction algorithms are employed to detect deadline violations asearly as possible. When it is detected that a deadline1Department of Computer and Information Science, University of Macau,Macau, China2Institute of Computer Science, University of Tartu, Tartu, EstoniaCorresponding author:Yain-Whar Si, Department of Computer and Information Science,University of Macau, Av. Padre Tomás Pereira, Taipa, Macau, China.Email: fstasp@umac.mo
78Concurrent Engineering: Research and Applications 22(1)Table 1. Escalation strategies analyzed in Van der Aalst et al. (2007) and Panagos and Rabinovich (1996, 1998).StrategyS1S2S3S4S5S6S7S8S9S10S11Alternative path selection (Van der Aalst et al., 2007)Resource redeployment (Van der Aalst et al., 2007)Data degradation (Van der Aalst et al., 2007)Early escalation (Panagos and Rabinovich, 1996, 1998)Escalation subprocess (Van der Aalst et al., 2007)Task pre-dispatching (Van der Aalst et al., 2007)Overlapping (Van der Aalst et al., 2007)Prioritization (Van der Aalst et al., 2007)Batching (Van der Aalst et al., 2007)Splitting (Van der Aalst et al., 2007)Deferred data gathering (Van der Aalst et al., 2007)may be missed, a task is triggered to inform a designated actor about the potential deadline violation.In this article, we extend the simulation-basedmethod presented in Chan et al. (2009) to deal withseven additional escalation strategies proposed in Vander Aalst et al. (2007), namely, escalation subprocess,task pre-dispatching, overlapping, prioritization, batching, splitting, and deferred data gathering. These strategies are applied to a case study from the insuranceindustry. Using this case study, we show how to designsimulation experiments to evaluate the impact of escalation strategies on key performance indicators (KPIs).In doing so, we illustrate trade-offs involved whenselecting escalation strategies and provide guidelines todeal with these trade-offs.This article is structured as follows. In section‘‘Background and related work,’’ we discuss relatedwork on escalation and time management in workflows. In section ‘‘Escalation strategies,’’ we introducethe escalation strategies. In sections ‘‘Escalation strategy evaluation method,’’‘‘Introducing escalations,’’ and‘‘Experimental results,’’ we describe the simulationmethod and illustrate it via a case study. Finally, weconclude in section ‘‘Conclusion.’’Background and related workPanagos and Rabinovich (1996, 1998) proposed‘‘Dynamic Deadline Adjustment’’ and ‘‘EarlyEscalation’’ as complementary strategies to minimizethe number of escalations needed during workflow execution and to mitigate their associated costs. DynamicDeadline Adjustment aims at minimizing the numberof escalations by attaching an ‘‘expected executiontask’’ to each task, and by continuously monitoringeach workflow execution in order to detect delays assoon as possible. When a task takes less than expectedto complete, the difference between the expected andWorkflow timeEscalation costCost (task, 33333actual execution time is accumulated into a slack timevariable. When the slack time is negative, it means thatthe workflow execution is delayed. This is where a second strategy, namely, Early Escalation, kicks in. In theEarly Escalation strategy, an algorithm is used to predict whether a case is going to miss a deadline. When apotential deadline violation is detected, the case is escalated. Escalations are defined as actions executed inparallel to the normal workflow in order to reduce therisk of a deadline violation. Panagos and Rabinovich(1996, 1998) evaluate their strategies using simulationtechnology, but only from a temporal perspective(without considering resource costs).Van der Aalst et al. (2007) analyze deadline escalation strategies using a so-called 3D approach (Detect,Decide and Do). In this approach, potential deadlineviolations are first detected and suitable escalation strategies are selected and applied. Van der Aalst et al.(2007) evaluate the effectiveness of some sample escalation strategies using simulation experiments. The strategies considered in their study are alternative pathselection (performing an alternative task when the execution is delayed), resource redeployment (bringing inmore resources into the workflow execution), datadegradation (requiring less data input in order to movefaster), escalation subprocess, task pre-dispatching,overlapping, prioritization, batching, splitting, anddeferred data gathering. Similar to Panagos andRabinovich (1996, 1998), Van der Aalst et al. (2007)only evaluate escalation strategies from the time perspective. In contrast, in this article, we propose asimulation-based method that takes into account thecost of task execution, the cost of resources, and compensation cost. The escalation strategies analyzed inVan der Aalst et al. (2007) and Panagos andRabinovich (1996, 1998) are summarized in Table 1. Inthis article, we focus on strategies S5–S11 as the firstfour strategies are analyzed in our previous work(Chan et al., 2009).
Si et al.Other work in the field of workflow escalationincludes that of Georgakopoulos et al. (2000), who outline an approach to support dynamic changes in workflows in crisis situations (e.g. for rescue operationsduring natural disasters). Their focus is on enablingdecision makers to escalate at runtime by changing thecourse of the workflow execution as required, whileretaining some level of control. In contrast, our workfocuses on analyzing the effectiveness and costs of different escalation strategies at design time.A related topic is that of specifying and analyzingtime constraints in workflows. Eder et al. (1999) propose Program Evaluation and Review Technique(PERT)-like techniques for analyzing time constraintsattached to workflows. Bettini et al. (2002) proposealgorithms for checking time constraint satisfiability atdesign time, while Chen and Yang (2008) propose techniques for efficiently checking time constraints at runtime. Finally, Rhee et al. (2004) propose a PERT-basedtechnique to calculate critical paths and slack time anda guide to help workers prioritize tasks in order to optimize throughput. These and similar related studies arecomplementary to ours since we do not deal withchecking time constraints or optimizing the overall execution of the workflow, but we focus on evaluatingescalation strategies to deal with workflow cases thatare likely to miss their deadlines.Previous work also addresses the issue of determining the (minimum) amount of resources needed in aworkflow in order to ensure that temporal constraintsare met with a certain probability (Son and Kim,2001). The reverse analysis is done in Li et al. (2004),where based on the available resources, estimates ofaverage execution time per workflow instance arederived. This work is complementary to ours: the estimates obtained using such techniques can be used toimplement escalation strategies based on resourceredeployment.Escalation strategiesA case is an execution of a workflow model (also calledprocess model). For example, in an insurance claimprocess, a case is the set of activities performed in orderto handle a given insurance claim. An escalation strategy describes actions to be taken when a case or a setof cases are predicted to miss the deadline. In this article, we consider the following escalation strategies.S5: Escalation subprocess. When a case is predicted tomiss a deadline or the case has already missed thedeadline but is still active, a special subprocess isinstantiated. The subprocess is intended to performactions specifically related to the deadline violation,79such as renegotiating a new deadline or performingcompensation actions and canceling the case.S6: Task pre-dispatching. The idea of task predispatching is to ‘‘pipeline’’ the execution of upcomingtasks in the case in order to accelerate the case. Inother words, a lookahead is performed to find outwhich tasks will need to be executed, and whereverpossible, preparations for these tasks are triggered, forexample, by putting these upcoming tasks on the worklists of the corresponding workers so that they areaware that they will need to perform the task withurgency once it is ready for execution. In the casewhere the execution of an upcoming task is conditional(e.g. only if a certain branch in the workflow is taken),it may happen that the preparatory actions for thistask need to be undone. This means that this strategymight create additional work that may become laterunnecessary (thus cost is increased). In this article, weexamine the case where only upcoming tasks that definitely need to be performed (as opposed to conditionally) are pre-dispatched.S7: Overlapping. The main idea is to make two sequential activities execute in parallel as much as possible.This strategy decreases the workflow time by creatingconcurrency, along the lines of task pre-dispatching.However, the trade-off is that this strategy increasesthe coordination overhead between tasks and thereforeinvolves additional costs. It also involves allocatingresources earlier, and this may have an impact on othercases.S8: Prioritization. By assigning higher priority to casesthat are running late, this strategy allows these cases tobe accelerated at the expense of other cases competingfor the same resources. The assignment of priority canbe driven by various parameters such as the cost of thecase and waiting time. The priority value is used torank work items that are waiting to be assigned to agiven resource (i.e. work items corresponding to caseswith higher priority are given precedence). This strategy will make some cases with low priority have longerworkflow time because they will spend more time inthe waiting queues. In this article, the compensationcost is used as the priority value of a case: the higherthe compensation cost of a case is, the higher the priority of work items associated to this case.S9: Batching. Group tasks or cases together andassigns them to one resource or a group of resources.This strategy reduces the workflow time by eliminatingsetup times and handover time, but it also entails thatsome cases will be waiting for others before beingtreated in batch.S10: Splitting. In this escalation strategy, a taskassigned to a resource or group of resources is split intosmaller tasks that are performed in parallel andassigned to separate resources. Because of parallelism,
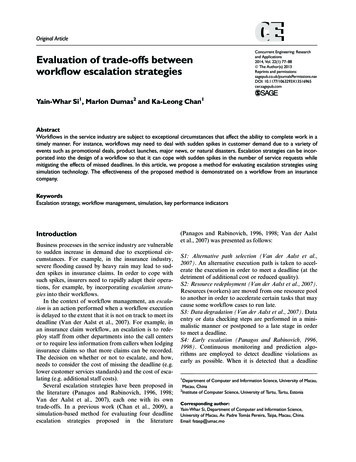
80Concurrent Engineering: Research and Applications 22(1)this strategy can reduce the workflow time. The tradeoff is the additional setup time, handover time, setupcost, handover cost, and cost of consolidating the outputs of smaller tasks.S11: Deferred data gathering. The idea of this strategyis not to gather data until the point when these dataare actually needed. The idea here is that some workflows have tasks early on during the workflow that aremeant to gather data from the user or other stakeholders. However, some of these data are not neededstraight but only later in the workflow. Accordingly,data gathering tasks may be accelerated by requiringless data to be gathered, thus speeding up the workflowexecution. When data are actually needed, they aregathered by the task that needs the data.In the back office, there are 150 legal experts, 150claim handlers, and 5 tasks: (1) determine likelihood ofclaim, (2) assess claim, (3) initiate payment, (4) adviseclaimant on reimbursement, and (5) close claim. Aninsurance claim will be rejected in call centers or inback office if the claim is not qualified for reimbursement. Similar to call centers, each case in back office ishandled by identical resources. In task ‘‘determine likelihood of claim,’’ three data items are required as input.In task ‘‘access claim,’’ one data item is required asinput.We extend the insurance claim scenario from Vander Aalst et al. (2007) byEscalation strategy evaluation method In this section, we present the simulation-based methodfor evaluating escalation strategies. The method consists of the following steps: (1) annotate the processmodel, (2) define normal and escalated scenarios, (3)simulate scenarios and estimate escalation needs, (4)introduce escalations by ‘‘perturbing’’ the workflowmodels, (5) simulate the workflow model with escalations, and (6) analyze simulation results.To illustrate the method, we will make reference toan insurance claims handling process model takenfrom Van der Aalst et al. (2007). The process model isdepicted in Figure 1 in the form of an Event-DrivenProcess Chain (EPC). In the EPC notation, a processmodel is represented as a directed graph consisting offunctions (rounded rectangles) representing tasks;events (hexagons) representing, for example, outcomes of decisions; connectors (circles) representing,for example, points of choice; and resource types(ellipses).1The EPC model in Figure 1 captures a process in alarge Australian insurance company for handlinginbound phone calls for lodging different types ofinsurance claims. Three subprocesses are involved inthis process: the back-office subprocess, the Brisbanecall center subprocess, and the Sydney call center subprocess. There are three tasks in each call center:‘‘check if sufficient information is available,’’ ‘‘classifythe kind of claim,’’ and ‘‘register claim.’’ Call centeragents handle all tasks in each call center. Each casemust be handled by a single resource. There are 90 callcenter agents assigned to each call center, respectively.In task ‘‘register claim,’’ one data item is required asinput. In normal conditions, approximately 9000 callsare received in each call center. Once the informationgathering process in the call center has been completed, a claim moves into the back-office process. Including an additional task ‘‘classify the kind ofclaim’’ and a new data item for the task ‘‘registerclaim’’ for both call centers;Introducing three new data items for the task‘‘determine the likelihood of claim’’ and a newresource called ‘‘legal experts’’ for the first twotasks in the back office.In the first step of the method, the modeler gathersdata to annotate the process model with attributes.These attributes are classified into four dimensions:task, case, resource, and data as discussed below. Theproblem of assigning values to simulation attributeshas been widely studied in the field of business processsimulation (Greasley, 2004; Tan and Takakuwa, 2007).Complementary techniques to this problem include thefollowing:1.2.3.4.5.Domain expertise derived via interviews or otherqualitative data gathering methods (e.g. wide-bandDelphi) with domain experts.Sampling experiments, wherein simulation attributevalues are derived from observations made on asample of cases in the workflow during a giventime window.Industry benchmarks such as Supply-ChainOperations Reference (SCOR) and AmericanProductivity and Quality Centre (APQC) that provide reference values for KPIs of typical processesin a variety of domains.Input analysis, wherein simulation attributes arederived from past execution data, such as, forexample, analyzing records of task execution timesin order to determine the probability distributionof the duration of each task.Sensitivity analysis, wherein a given assignment ofvalues to simulation attributes—obtained via oneof the above methods—is tested against reality byrunning simulations with the assigned attribute values and comparing the simulation results with theobserved performance of the ‘‘As Is’’ process.
Si et al.81Call Centre Brisbane9,000 calls per weekCall Centre SydneyPhone callreceivedTB1:30.00 Second(s)Phone callreceived9,000 calls per weekTS1:Resource1:Call centreAgentCheck if sufficientinformation isavailable30.00 Second(s)Resource1:Call centreAgentCheck if sufficientinformation isavailable900.90sufficientinformationis available0.90sufficientinformation isnot availableXORsufficientinformationis available320.00 Second(s)200.00 Second(s)TB2:Resource1:Call centreAgent900.10Claimis classifiedClassify the kindof claim0.10sufficientinformation isnot availableXOR320.00 Second(s)200.00 Second(s)TS2:Resource1:Call centreAgentTB3:Register Claim90Classify the kind ofclaimTS3:Claimis classifiedRegister Claim90Data1:Information1Data1:Information1Claim isregisteredClaim isregisteredResource1:Call centreAgentResource1:Call econd(s)20.00 Second(s)To1:30.00d(s)seconInsuredcould notbe liableData4:Information3150Determine thelikelihood urce2:Legal ExpertData1:Information1660.00 Second(s)Insuredcould beliable0.85To2:150Resource3:Claims handler150Resource2:Legal ExpertAssess Claim0.80Claims havebeen acceptedResource3:Claims handlerXOR1500.20Claims havebeen rejectedResource3:Claims handler150Claim hasbeen closedTo5:Close claimPayment hasbeen initiated30.00 Second(s)To3:Initiate PaymentTo4:Advise claimant onreimbursement120.00 Second(s)Claimant hasbeen advised180.00 Second(s)Figure 1. The base model.In the case study at hand, attribute values werederived from the case study data provided in Van derAalst et al. (2007), which were themselves derived frominterviews with domain experts. In the case of ‘‘dataattributes,’’ values were chosen in a way that is consistent with the data in Van der Aalst et al. (2007), thoughnot directly taken from Van der Aalst et al. (2007).options: execution cost, average completion time, andlatest completion time. Latest completion time isdefined as 1.8 times of average completion time.Exponential distribution is used in the simulation forthe execution time of every activity. In Table 2, we giveinitial attribute values for each task in the runningexample.Attributes of a taskAttributes of a caseEach task is assigned with an average execution time(shown in seconds in Figure 1). In addition, for eachtask, three attributes are required to assess escalationEach case is assigned a unique identifier as well as adeadline, which is calculated based on average execution time of the tasks in the critical path of the
82Concurrent Engineering: Research and Applications 22(1)Table 2. Task attribute values for running example.Task (Ti)Task descriptionExecution cost (CTi)Average completion timeLatest completion timeTB1TB2TB3TS1TS2TS3TO1TO2TO3TO4TO5Check if sufficient information is availableClassify the kind of claimRegister claimCheck if sufficient information is availableClassify the kind of claimRegister claimDetermine likelihood of claimAccess claimsInitiate paymentAdvise claimant on reimbursementClose claimCTB1 10CTB2 10CTB3 10CTS1 10CTS2 10CTS3 10CTO1 20CTO2 30CTO3 17CTO4 10CTO5 8821632454workflow. In addition, a compensation cost (i.e. thecost of missing the deadline) is assigned to each case.The compensation cost can be a fixed amount, or avalue from a certain range, or a function that takes asinput the amount of time by which the deadline ismissed. In the running example, we assume that escalation cost is uniformly drawn from the range (120–170).Attributes of a resourceEach (human) resource has three attributes: (1) role:used to describe the responsibility of an employee inthe workflow; (2) amount: number of resources; and(3) cost: wage of a resource. Three types of resources(Resource 1, Resource 2, and Resource 3) are definedin the running example. The first type of resources iscomposed of 180 call center agents. The second type ofresources includes 150 legal experts. The third type ofresources includes 150 claim handlers. There are 90 callcenter agents assigned to each call center, respectively.Legal experts are assigned to tasks TO1 and TO2 in theback office. Claim handlers are assigned to the remaining tasks TO3, TO4, and TO5 in the back office. Thewage of a call center agent is 4000 (per 2 weeks), andthe wage of a legal expert and claim handler is 6000(per 2 weeks). Resource cost represents the cost of utilizing a specific resource for a case.Data attributesEach association (task, data object) is annotated withan estimated preparation time—the time required toretrieve and prepare the data for the task in question.In the running example, three data objects (Data1,Data2, and Data3) are required for task ‘‘Determinelikelihood of claim.’’ This task can only be executedwhen all three objects are available. In our experiments,the preparation time of Data1, Data2, and Data3 was20, 20, and 30 s, respectively.The second step of the simulation method is todefine the scenarios: one normal scenario and one ormany escalated scenarios. In the running example, weassume that there are two scenarios: (1) a normal scenario with approximately 9000 cases per 2-week periodat each call center and (2) an escalated scenario (stormseason) where the number of calls increases to 20,000cases. Here, we assume a negative exponential distribution, but other distributions can be adopted.The third step of the method is to encode the processmodel and associated attributes for the normal scenariousing a discrete event simulation technique. In this article, we use Colored Petri Nets (CPN; CPN Group,2013), but other techniques/tools could be used instead(e.g. Arena).Once the initial process model and its attributes areencoded, we simulate it under each scenario. Table 3shows the results of simulation in storm season and innormal condition. The results show that the currentmodel is suitable for the normal scenario but not forthe storm season. Thus, escalation is needed. Table 3specifically shows that a bottleneck exists in back officeat task TO1 during storm season.Introducing escalationsThe next step in the simulation method is to perturbthe base process model in order to incorporate differentescalation strategies. Below, we show how this is donefor the escalation strategies previously introduced,using the running example as a basis.S5: Escalation subprocess. To apply this strategy, weintroduce an additional subprocess to speed up theinsurance claim process. Only one escalation task, TS(Compensation-and-cancellation with client), is includedin the subprocess. We define the execution cost andaverage time of TS as 25 and 120, respectively. Duringthe execution of TS, a negotiation is carried out with
Si et al.83Table 3. Initial results in normal condition and in storm season.MeasurementTimeCostAverage workflow timeWaiting time at BrisbaneWaiting time at SydneyWaiting time at back officeAverage workflow cost (per week)Resource cost (per week)Average compensation cost (per week)Total cost (per week)the client to delay his/her claim request. Since the claimis going to be delayed, appropriate compensation isalso offered to the client. We define the compensationcost of TS as 140. After executing TS, the case is considered end.In addition, a new prediction task TP is added todetermine whether the subprocess should be applied.We define the execution cost and average time of TP as0 and 5, respectively. The prediction task TP and escalation task TS are inserted in the locations in the workflow where a case is initially assigned to a resource. InFigure 2, TP and TS are inserted at the beginning ofback office. In this model, all tasks in a call center arehandled by the same call center agent, and all tasks inthe back office are handled by the same claim handler.The workflow after applying Escalation subprocess (S5)is shown in Figure 2.S6: Task pre-dispatching. To apply this strategy, taskTB3 is replaced by TB3P and TB30 , and task TS3 isreplaced with TS3P and TS30 . Tasks TB3P and TB2and tasks TS3P and TS2 are executed simultaneouslyand handled by different resources. Therefore, thisstrategy increases the demand of resources and nearlyno influence to the cost and reliability of these alternative tasks (see Table 4).S7: Overlapping. To apply this strategy, we introducefour tasks TB20 , TS20 , TB30 , and TS30 to replace TB2,TS2, TB3, and TS3, respectively (see Table 4). TasksTB20 and TB30 are executed in parallel and are handledby different resources, and the same holds for tasksTS20 and TS30 . This parallelism leads to higher execution cost when compared to the original tasks, due toadditional coordination efforts.S8: Prioritization. We insert an escalation task, namelyTC, where priorities are assigned to tasks in the backoffice. The execution cost and average time of TC are 0and 10, respectively. During the execution of TC, if thecase is running late, the case is assigned a priorityaccording to its compensation cost. Task TC is insertedas the first task in the back-end part of the workflow.Normal condition(9000 cases per week)Storm season condition(20,000 cases per 59171,740,0002,520,0002,280,0004,020,000S9: Batching. We introduce an additional escalationtask, namely, ‘‘Assign every 10 cases to be handled byone resource’’ (or TA for short) in order to batch thecases. We define the execution cost and average time ofTA as 30 and 10, respectively. TC is designed to batchevery 10 cases to one resource and therefore results theexecution cost for batching cases. Three tasks TO30 ,TO40 , and TO50 are introduced to replace TO3, TO4,and TO5 (see Table 4). These new tasks handle every10 cases by one resource.S10: Splitting. Task TO2 is replaced by three tasksTO21, TO22, and TO23 (cf. Table 4) that are executed by three legal experts in parallel, thus leadingto shorter average completion times for Task Assessclaim compared to the original task. The setup andhandover time of TO21, TO22, and TO23 are set to30. The average completion time of tasks TO21,TO22, and TO23 is longer than the average completion time of task TO2 due to additional setupand handover time. The cost of tasks TO21, TO22,and TO23 is also higher than the cost of task TO2 inthe original model due to setup and handover costsand cost of consolidating the outputs of the smallertasks.S11: Deferred data gathering. We introduce two newalternative tasks TB20 and TS20 to replace TB2 andTS2 (see Table 4). These new tasks are designed toquickly process their job by not gathering information item 1, thus resulting shorter average completiontime compared to the original tasks. In addition, atask TOA (‘‘Gathering information1’’) is added in theback office in order to gather information item 1when this information is needed (the probability thatthis information item is needed is 0.7). The executioncost and average time of TOA is 5 and 120, respectively. Task TOA is performed before task AssessClaim and only if information item 1 is required.Experimental resultsThe final step in the proposed method is to analyze thesimulation results in terms of KPIs. In the current
84Concurrent Engineer
process model). For example, in an insurance claim process, a case is the set of activities performed in order to handle a given insurance claim. An escalation strat-egy describes actions to be taken when a case or a set of cases are predicted to miss the deadline. In this arti-cle, we consider the following escalation strategies.