Transcription
Methodology for EstimatingInfluenza Vaccination CoverageMonitoring the Healthy People 2020 ObjectiveJanuary 2016
Contents1Overview . 22Data Source . 332.1Understanding the MDS . 32.2Using the MDS for analysis . 4Study Population . 73.13.1.1Assessments missing vaccination information . 73.1.2Residents not in the facility during the influenza season . 83.245Constructing the study population . 7Classifying the study population. 83.2.1State. 93.2.2Educational attainment . 93.2.3Age. 103.2.4Sex . 113.2.5Race/ethnicity . 113.2.6Marital status. 12Vaccination Rate Methodology . 134.1Defining the vaccination rate . 134.2Defining non-vaccination reasons . 14Additional Investigations . 165.1Interpreting inconsistent vaccination information . 165.2Investigating alternative definitions of vaccination rate . 165.3Stratifying the vaccination rate by month of exit . 17Acumen, LLC1January 2016
1 OverviewTo help the Centers for Disease Control (CDC) monitor progress toward the Healthy People 2020influenza objective, Acumen estimated the annual seasonal influenza vaccination rates of institutionalizedadults aged 18 years and older in long-term care facilities or nursing homes (NHs) certified by the Centersfor Medicare & Medicaid Services (CMS). This analysis extends across the influenza seasons 2005-06 to2014-15.This report explains the data and methodology used for the analysis: Section 2, Data Source: This section provides background on the data source, the MinimumData Set (MDS), and identifies the specific data elements used to calculate influenzavaccination rates. Section 3, Study Population: This section explains how the study population was constructedand how resident characteristics were categorized. Section 4, Vaccination Rate Methodology: This section defines the numerator and denominatorof the influenza vaccination rate. This section also describes how the project team identifiedreasons for non-vaccination. Section 5, Additional Investigations: This section presents the results of supplementalinvestigations undertaken to support the main analysis and chosen methodology. Specifically,the section discusses inconsistent vaccination information, explores two alternative definitionsof vaccination status, and looks at the vaccination rates by month of exit.Acumen, LLC2January 2016
2 Data SourceThe Healthy People 2020 objective uses the MDS as its primary data source. This section beginswith an overview of the MDS and then further explains the set of items that are particularly relevant to thisproject.2.1Understanding the MDSThe MDS assesses the health and care needs of all residents admitted to Medicare- or Medicaid-certified NHs and Veterans Health Administration Community Living Centers. It was originally introducedas a means of identifying resident characteristics and issues in order to develop individualized care plans.The use of the MDS assessment tool has since expanded to include purposes such as monitoring thequality of care, determining Medicare and Medicaid payment, and providing consumer access to NHinformation.There are two general types of MDS assessments: Omnibus Budget Reconciliation Act (OBRA)assessments and Medicare Prospective Payment System (PPS) assessments. OBRA assessments satisfythe Act’s mandate to conduct comprehensive assessments based on uniform data with the goal of ensuringquality of care. NHs are required to submit OBRA records for all residents in Medicare- or Medicaid-certifiedbeds, regardless of the payer. PPS assessments help determine Medicare payment for Part A beneficiariesin skilled nursing facilities (SNFs), so SNFs submit these assessments only for residents covered under theMedicare Part A SNF benefit.Assessments are conducted at time intervals relative to the date a resident entered a facility: Completed for all nursing home residents: The OBRA requires facilities to fill out assessmentsat the following points in the stay. oAdmission (within the first two weeks)oQuarterly (92 days following the previous OBRA assessment of any type)oAnnually (366 days following the last comprehensive OBRA assessment)oSignificant change in the patient's statusoDischargeCompleted for Medicare SNF PPS residents: The following assessments are required forSNF PPS residents to determine Medicare payment. Assessments can occur any timeduring the range of dates provided in parentheses.Acumen, LLCo5-day assessment (days 1-8)o14-day assessment (days 13-18)3January 2016
o30-day assessment (days 27-33)o60-day assessment (days 57-63)o90-day assessment (days 87-93)oChange in therapy treatment (start of therapy, end of therapy, change in intensity)When OBRA and SNF PPS assessment time frames coincide, one assessment may be used tosatisfy both requirements. Additional information about assessment scheduling may be found in Chapter 2of the MDS Resident Assessment Instrument (RAI) Manual.This project extracts information from all types of MDS assessments—OBRA, PPS, and combinedOBRA/PPS. These assessment requirements result in approximately 4-5 assessments each season perunique resident1 in the study population, as shown in Table 1.Table 1. Average number of assessments per resident in study 05.04.94.92.2Using the MDS for analysisTo answer the Healthy People 2020 objective, Acumen used the influenza vaccination questionsfrom the MDS assessment. These questions changed during the study window of this project, however,which divided the time frame into two periods: MDS Version 2.0 and MDS Version 3.0. The MDS wasupdated from Version 2.0 to 3.0 on October 1, 2010, and the new version of the assessment introducedchanges to the wording, formatting, and submission requirements of the influenza questions, as thefollowing tables show. Accordingly the influenza seasons 2010-11 and after are not directly comparable tothose prior to 2010-11; within a season, though, the data are generated from only one MDS version.Table 2. O0250A & W2A: The question evaluating whether or not the resident received the influenzavaccination was changed slightly in wording and formatting. In MDS 3.0 the season dates are removed in thequestion and RAI manual.MDS 3.0MDS 2.0Did the resident receive the influenza vaccine inthis facility for this year's influenza season?Did the resident receive the Influenza vaccine inthis facility for this year's Influenza season(October 1 through March 31)?0. No -- Skip to O0250C, If Influenza vaccine notreceived, state reason0. No (If No, go to item W2b)1Residents are identified in the assessment data by a unique combination of resident identifier and statecode. As a result, residents who lived in multiple states were included once in each state, while residentswho lived in multiple nursing homes within a state were included only once in that state.Acumen, LLC4January 2016
1. Yes -- Continue to O0250B, Date vaccinereceived1. Yes (If Yes, go to item W3)Table 3. O0250B: This question was added in MDS 3.0.MDS 3.0MDS 2.0Date vaccine received -- Complete date andskip to O0300A, Is the resident's Pneumococcalvaccination up to date?-Table 4. O0250C & W2B: The answers to reasons for non-vaccination changed in wording and formatting.MDS 3.0 adds the last option "None of the above", which also applies to cases in which the reason for nonvaccination is unknown.MDS 3.0MDS 2.0If Influenza vaccine not received, state reason:If Influenza vaccine not received, state reason:1. Resident not in facility during this year's fluseason1. Not in facility during this year's flu season2. Received outside of this facility2. Received outside of this facility3. Not eligible - medical contraindication*3. Not eligible4. Offered and declined4. Offered and declined5. Not offered5. Not offered6. Inability to obtain vaccine due to a declaredshortage6. Inability to obtain vaccine9. None of the above-*Medical contraindications include, but are not limited to; allergic reaction to eggs or other vaccinecomponent(s), previous adverse reaction to influenza vaccine, a physician order not to immunize, moderateto severe illness with or without fever, and/or history of Guillain-Barre Syndrome within 6 weeks of previousinfluenza vaccination.For reference, the full MDS 3.0 and 2.0 questions are displayed below.Acumen, LLC5January 2016
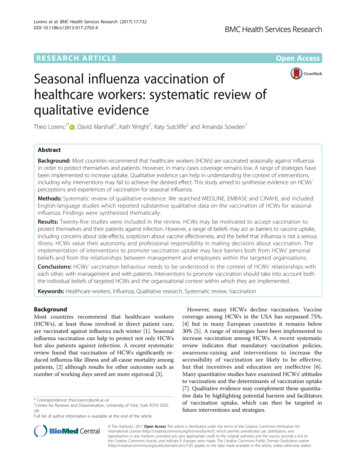
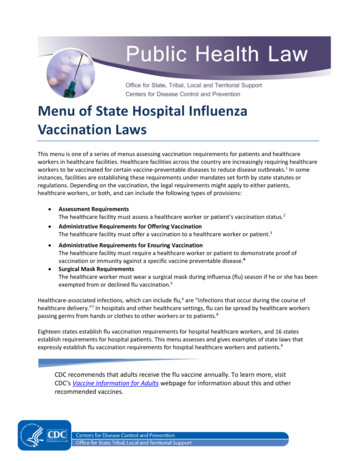
Figure 1. MDS 3.0 influenza vaccination questionsFigure 2. MDS 2.0 influenza vaccination questionsAcumen, LLC6January 2016
3 Study PopulationAcumen created and classified a study population for analysis using information from the MDSassessments. This section first explains how Acumen created a base population of nursing home residentsand implemented restrictions to improve the quality of the data. The section then discusses how the projectteam classified the characteristics of the cleaned resident population.3.1Constructing the study populationThe Healthy People 2020 population objective applies to all institutionalized adults aged 18 yearsand older in NHs certified by CMS. For each influenza season, Acumen identified all residents who had atleast one assessment conducted with a target date between October 1 and March 31.2 Due to the limitationsof the resident identification number, Acumen included residents who lived in multiple states once in eachstate, while residents who lived in multiple nursing homes within a state were included only once in thatstate. Acumen then restricted the population to residents aged 18 years and older to arrive at the basepopulation of institutionalized adults in NHs certified by CMS. After applying the restrictions described inthe subsections below, this population formed the denominator of the vaccination rate.3.1.1 Assessments missing vaccination informationAssessments with missing vaccination information were excluded (see Table 5). While the influenzavaccination fields must be completed for most MDS assessment types, a small number of non-routineassessments are excluded. Assessments from swing bed facilities3 were also excluded from this projectbecause the influenza vaccination questions do not appear on MDS 2.0 swing bed assessments. Lastly,“not assessed/no information” is a valid entry value on all assessments, even if the influenza questions arepart of the required set for that assessment.Table 5. Percentage of assessments with missing vaccination %22.4%31.3%27.5%28.1%28.0%28.5%2While residents must have at least one assessment between October and March to be included in the population fora given season, all assessments from October 1 through June 30 were used to determine their vaccination status.3 Swing beds are beds in acute care hospitals that can be used for patients receiving SNF care. They are morecommonly found in rural areas. The MDS assessments for swing bed residents are different from the assessmentsrequired for residents in NHs.Acumen, LLC7January 2016
Though an individual assessment may be missing vaccination information, a resident's vaccinationstatus can still be determined if he or she received other assessments with non-missing information in theinfluenza season. However, if all assessments for a resident in a single influenza season are missingvaccination information, then the resident was excluded from the population for that season (see Table 6).Table 6. Percentage of residents excluded due to missing %3.8%4.7%4.7%5.0%5.4%3.1.2 Residents not in the facility during the influenza seasonSome residents were excluded from the study population because of a data limitation caused bythe reasons for non-vaccination. An assessment may describe a resident’s reason for non-vaccination as“not present in the facility during influenza season”. Some assessments have this option selected evenwhen the assessment date falls between the start and end dates of the influenza season in October andMarch. When all the assessments in the season for a non-vaccinated resident list this reason for nonvaccination, it cannot be determined whether the resident was actually vaccinated, so the resident wasremoved from the population (see Table 7). Non-vaccinated residents with a different reason for nonvaccination in at least one assessment were kept in the population.Table 7. Percentage of residents excluded due to having all assessments with “Resident not in facility duringinfluenza season” as the reason for %0.0%0.8%1.6%1.6%1.8%1.9%3.2Classifying the study populationThe project team characterized the study population on several dimensions to better understandthe vaccination rates. Acumen used these variables to decompose the national rate into state-specificestimates and to stratify the rate by five demographic factors: educational attainment, age, sex,race/ethnicity, and marital status. The descriptions below describe the MDS 2.0 and 3.0 variables thatidentify each resident demographic characteristic, as well as the variable included in Acumen’s SASprogram calculate influenza rates.sas. When applicable, the description also includes themapping used to account for changes between the two MDS versions.A value of “Inconsistent information” was assigned when two assessments in the same influenzaseason had conflicting values for a demographic variable. The age variable was an exception to thiscategorization, as an increase in a resident’s age may plausibly be captured across assessments during agiven season. To address this possibility, the age from the resident’s first assessment of the season wasAcumen, LLC8January 2016
used. A value of “Missing” was assigned only when all the assessments in the season had missinginformation for the demographic variable.3.2.1 StateMDS 2.0MDS 3.0SAS ProgramSTATE IDSTATE CDSTATE CODEState-specific vaccination rates and reasons for non-vaccination were calculated for all 50 statesand the District of Columbia. This category can take on the following values: Alaska (AK) Kentucky (KY) New York (NY) Alabama (AL) Louisiana (LA) Ohio (OH) Arkansas (AR) Massachusetts (MA) Oklahoma (OK) Arizona (AZ) Maryland (MD) Oregon (OR) California (CA) Maine (ME) Pennsylvania (PA) Colorado (CO) Michigan (MI) Rhode Island (RI) Connecticut (CT) Minnesota (MN) South Carolina (SC) District of Columbia Missouri (MO) South Dakota (SD)(DC) Mississippi (MS) Tennessee (TN) Delaware (DE) Montana (MT) Texas (TX) Florida (FL) North Carolina (NC) Utah (UT) Georgia (GA) North Dakota (ND) Virginia (VA) Hawaii (HI) Nebraska (NE) Vermont (VT) Iowa (IA) New Hampshire Washington (WA) Idaho (ID)(NH) Wisconsin (WI) Illinois (IL) New Jersey (NJ) West Virginia (WV) Indiana (IN) New Mexico (NM) Wyoming (WY) Kansas (KS) Nevada (NV)3.2.2 Educational attainmentMDS 2.0MDS 3.0SAS ProgramAB7 EDUCATION-EDUCATION BINA resident's educational attainment is only available on MDS 2.0 assessments. The values for thiscategory are therefore unavailable starting October 2010, when the MDS 3.0 was implemented. The desiredAcumen, LLC9January 2016
bins for educational attainment differ from the options listed in MDS 2.0. Table 8 describes how Acumenmapped the specific MDS 2.0 values into more general groups. This category can take on the followingvalues: High school High school Technical or trade school Some college 4-year college Advanced degree Inconsistent information (constructed value) Missing (constructed value)Table 8. Educational attainment value mappingCategory AssignmentMDS 2.0 No schooling High school 8th grade/less High school 9-11 grades High school High school High school Technical or trade school Technical or trade school Some college Some college Bachelor's degree 4-year college Graduate degree Advanced degree3.2.3 AgeMDS 2.0MDS 3.0SAS ProgramAA3 BIRTH DT (Birth Date),TRGT DT (Target Date)A0900 BIRTH DT (Birth Date),TRGT DT (Target Date)AGE BIN (Birth Date),TARGET DATE (Target Date)The resident's age was constructed using two variables from the MDS, the resident's birth date andthe assessment target date. This category can take on the following values: 18-24 years 25-44 years 45-54 years 55-64 years 65-74 years 75-84 yearsAcumen, LLC10January 2016
85 years3.2.4 SexMDS 2.0MDS 3.0SAS ProgramAA2 GENDERA0800 GNDR CDSEX BINThe question of gender/sex is consistent across MDS versions. This category can take on thefollowing values: Female Male Inconsistent information (constructed value) Missing (constructed value)3.2.5 Race/ethnicityMDS 2.0MDS 3.0A1000A AMRCN INDN AK NTVCD, A1000B ASN CD,A1000C AFRCN AMRCN CD,A1000D HSPNC CD,A1000E NTV HI PCFC ISLNDR CD, A1000F WHT CDAA4 RACE ETHSAS ProgramRACE ETHNICITY BINThe question of race/ethnicity is inconsistent across MDS versions. Table 9 includes the mappingused between versions. MDS 2.0 combines Asian and Pacific Islander into the same category and doesnot offer the option of selecting multiple races/ethnicities. MDS 3.0 features slight alterations in wording.Table 9. Race/ethnicity value mappingMDS 3.0*MDS 2.0 American Indian/ Alaskan Native Asian/Pacific Islander -- Asian- Native Hawaiian or Other Pacific Islander Black, not of Hispanic origin Black or African American Hispanic Hispanic or Latino White, not of Hispanic origin White Multiple races-Acumen, LLCAmerican Indian or Alaska Native11January 2016
*In MDS 3.0, more than one race category can be selected. For this study, any resident with "Hispanic orLatino" selected was placed in the "Hispanic or Latino" category regardless of the other races selected. Forexample, an individual with "Black" and "Hispanic or Latino" was categorized as "Hispanic or Latino." If multipleraces not including "Hispanic or Latino" were selected, then the resident was classified as "Multiple races".This category can take on the following values (the union of the two columns in Table 9): American Indian or Alaska Native Asian or Pacific Islander Asian Native Hawaiian or Other Pacific Islander Black or African American Hispanic or Latino White Multiple races Inconsistent information (constructed value) Missing (constructed value)3.2.6 Marital statusMDS 2.0MDS 3.0SAS ProgramA5 MARITAL STATUSA1200 MRTL STUS CDMARITAL STATUS BINThe question of marital status is consistent across MDS versions. This category can take on thefollowing values: Never married Married Widowed Separated Divorced Inconsistent information (constructed value) Missing (constructed values)Acumen, LLC12January 2016
4 Vaccination Rate MethodologyThe goal of this analysis is to estimate the influenza vaccination rate and the composition of reasonsfor non-vaccination. This section describes the methodology used to build these estimates from thepopulation described in Section 3. The first subsection presents how the project team defined thevaccination rate. The second subsection defines the reasons for residents failing to receive the influenzavaccination.4.1Defining the vaccination rateThe influenza vaccination numerator includes all those from the denominator population describedin Section 3 who were reported to have received an influenza vaccination in any assessment betweenOctober 1 and June 30. The vaccination status was based on information from the O0250A/O0250C (MDS3.0) and W2a/W2b (MDS 2.0) questions. Residents with a “yes” on an assessment were counted asvaccinated for that influenza season.Numerator: All those who were reported to have received an influenza vaccination in anyassessment between October 1 and June 30.Denominator: All institutionalized adults aged 18 years and older in long-term care facilities or NHscertified by CMS who had resident assessments conducted with a target date between October 1and March 31.Table 10 shows that the “yes” response can take two different forms: (1) A value of 1 in the firstvaccination question, indicating that the resident received the vaccine in the facility, or (2) a value of 0 inthe first question with reason 2 for non-vaccination, which indicates that the resident did not receive thevaccine in the facility, but did receive the vaccine outside of the facility. The question wording can be foundin Section 2.2. Both answer forms were considered equivalent when identifying a resident as vaccinated.Table 10. Vaccination status on the MDS“Yes” on MDS 3.0“Yes” on MDS 2.0O0250A 1orO0250A 0 and O0250C 2W2a 1orW2a 0 and W2b 2Section 5.2 explores two other methods of defining the vaccination rate, applying different levels ofstringency to inconsistent answers. The national and state-specific vaccination rates were stratified by allfive resident characteristics.Acumen, LLC13January 2016
4.2Defining non-vaccination reasonsThe analysis of non-vaccination reasons was conducted at the national and state levels. Theanalysis also looked at non-vaccination reasons by race/ethnicity at the national level. Acumen used twomethodologies to determine a resident’s reason for non-vaccination. The first methodology classified aresident into one of seven reasons for non-vaccination, based on all assessments performed in a giveninfluenza season: Not eligible – medical contraindication Offered & declined Not offered Inability to obtain vaccine (definition limited in MDS Version 3.0*) None of the above Multiple reasons Missing* MDS 3.0 phrasing: "Inability to obtain vaccine due to declared shortage"The first six reasons are derived directly from the MDS questions explained in Section 2.2. If theassessments across the season indicated different reasons for non-vaccination, the resident qualified forthe “Multiple reasons” category. If all assessments in the season for an unvaccinated resident were missingan answer for the non-vaccination question, then the resident fell under the “Missing” category.The second methodology classified a resident into one of six reasons for non-vaccination, basedonly on the last assessment with non-missing vaccination information performed in a season: Not eligible – medical contraindication Offered & declined Not offered Inability to obtain vaccine (definition limited in MDS Version 3.0*) None of the above MissingBecause only one assessment was used for this methodology, a resident could not haveinconsistent reasons for non-vaccination and therefore could not be classified into the “Multiple reasons”category. If all assessments in the season for an unvaccinated resident were missing an answer for thenon-vaccination question, then the resident fell under the “Missing” category.The motivation for using this methodology was that a modification in the reported reason for nonvaccination could reflect an actual change, rather than a data inconsistency. For example, a resident mayAcumen, LLC14January 2016
not have been offered the vaccine at the time of their first assessment, but could have been offered anddeclined it by the time of their last assessment. Using the last assessment with non-missing informationmay provide the ultimate reason why a resident was not vaccinated in the season.Acumen, LLC15January 2016
5 Additional InvestigationsThis project encountered two main data quality concerns: missing vaccination information andinconsistent answers to the vaccination question. Acumen addressed the first concern with a populationrestriction, as Section 3.1 describes. This section explains the second concern—inconsistent vaccinationinformation—and then presents an investigation that explored how inconsistent information affects thenational vaccination rates.5.1Interpreting inconsistent vaccination informationInconsistent information for a given resident is defined as a "yes" for vaccinated on an assessmentand a "no" on a later assessment in that season. This definition is set because the influenza vaccine is onlyadministered to a person once per season; once a resident appears as vaccinated in one assessment, theresident should be counted as vaccinated in all later assessments for that season. Approximately 4-5% ofthe cleaned study population has inconsistent vaccination information. The vaccination rate calculationconsiders these residents vaccinated, placing higher confidence on earlier, positive responses.Table 11. Percentage of residents with inconsistent %4.7%5.1%4.4%4.3%4.2%5.2Investigating alternative definitions of vaccination rateBefore CDC selected the Section 4.1 definition, the project team presented two additional methodsof calculating the vaccination rate. Each method varies in the level of stringency of accounting for residentswith inconsistent answers for the vaccination status. Table 12 summarizes the three methods. The upperbound is the method selected by CDC and defined previously in Section 4.1.Table 12. Methods for defining vaccination rateUpper BoundLower BoundAlternative SampleMotivationThis definition does not accountfor data entry errors. Thisdefinition places greaterconfidence in positive or earlieranswers.This definition places greaterconfidence on negative or lateranswers. This definition yieldsthe low bound for the influenzavaccination rate.This definition accounts forpossible data entry errors byrestricting the population toresidents with consistentvaccination information.Definition of Vaccinated StatusAcumen, LLC16January 2016
Residents with a "yes" on anyassessment within the seasonare counted as vaccinated forthat season regardless of any"no" assessments.Residents with inconsistentanswers on assessments withina season are counted as notvaccinated for that season.Residents with inconsistentanswers on assessments withina season are dropped for thatseason.Full populationIncludes: Residents withinconsistent info. (Table 11).Excludes: Residents with missinginfo. (Table 6 and Table 7).Alternative populationExcludes:- Residents with inconsistentinformation (Table 11).- Residents with missing info.(Table 6 and Table 7).PopulationFull populationIncludes: Residents withinconsistent info. (Table 11).Excludes: Residents with missinginfo. (Table 6 and Table 7).The treatment of inconsistent information affects the estimated rate of vaccination. Table 13 showsthe vaccination rates using each of the three methods.Table 13. Vaccination rates under the three 75.4%74.5%5.3Stratifying the vaccination rate by month of exitThere are no assessments to indicate if a resident was vaccinated after leaving a facility. Residentsleave the facility at different points in the influenza season, which limits the information available todetermine whether they were vaccinated. To investigate the impact of this limitation, vaccination rates werestratified by the month of exit. The month of exit is defined as the month of the resident’s last assessmentin the influenza season. For all influenza seasons, the vaccination rate increased from the beginning to theend of the season. Table 14. shows the vaccination rates for influenza season 2014-15.Table 14. Influenza vaccination rate for 2014-15 season by month of exitMonth of LastAssessment inSeasonAcumen, LLCVaccination Rate# Vaccinated# Not 5,78561,51117January 2016
pril *80.2%356,84688,301May *82.5%370,92678,435June *82.1%453,43698,539* The study population is restricted to residents with at least one assessment between October and March.However, assessment through June are included.Acum
The use of the MDS assessment tool has since expanded to include purposes such as monitoring the . Additional information about assessment scheduling may be found in Chapter 2 of the MDS Resident Assessment Instrument (RAI) Manual. . LLC 6 January 2016 Figure 1. MDS 3.0 influenza vaccination questions Figure 2. MDS 2.0 influenza vaccination .