Transcription
Advancing theFuture of Energy Advancing the Future of EnergyW I T H C A P I T A L D I S C I P L I N E , I N N O V A T I O N With Capital Discipline, Innovation and Unmatched ExecutionA N D U N M AT C H E D E X E C U T I O N.RELIABLEAFFORDABLES U S TA I N A B L E E N E R G YReliable, Affordableand Sustainable EnergyI N V E S T O R P R E S E N TAT I O N J U N E 2 0 2 1
Cautionary StatementThis presentation contains forward-looking statements made by Valero Energy Corporation (“VLO” or “Valero”) within the meaning offederal securities laws. These statements discuss future expectations, contain projections of results of operations or of financial condition orstate other forward-looking information. You can identify forward-looking statements by words such as ”plan,” “should,” “anticipate,”“believe,” “estimate,” “expect,” “could,” “continue,” “focused,” “opportunity,” “scheduled,” “may,” “will,” “targeting,” or other similarexpressions that convey the uncertainty of future events or outcomes. These forward-looking statements are not guarantees of futureperformance and are subject to risks, uncertainties and other factors, some of which are beyond the control of Valero and are difficult topredict including, but not limited to, the effect, impact, potential duration or other implications of the COVID-19 pandemic and variousevents arising therefrom. These statements are often based upon various assumptions, many of which are based, in turn, upon furtherassumptions, including examination of historical operating trends made by the management of Valero. Although Valero believes that theassumptions were reasonable when made, because assumptions are inherently subject to significant uncertainties and contingencies, whichare difficult or impossible to predict and are beyond its control, Valero cannot give assurance that it will achieve or accomplish itsexpectations, beliefs or intentions. When considering these forward-looking statements, you should keep in mind the risk factors and othercautionary statements contained in Valero’s filings with the Securities and Exchange Commission, including Valero’s annual report on Form10-K, quarterly reports on Form 10-Q, and other reports available on Valero’s website at www.valero.com. These risks could cause theactual results of Valero to differ materially from those contained in any forward-looking statement.This presentation includes certain financial measures that are not defined under U.S. Generally Accepted Accounting Principles (GAAP) andare considered to be non-GAAP measures. Valero has defined these non-GAAP measures and believes they are useful to the external usersof its financial statements, including industry analysts, investors, lenders, and rating agencies. Valero believes these measures are useful toassess its ongoing financial performance because, when reconciled to their most comparable U.S. GAAP measures, they provide improvedcomparability between periods after adjusting for certain items that Valero believes are not indicative of its core operating performance andthat may obscure its underlying business results and trends. These non-GAAP measures should not be considered as alternatives to theirmost comparable U.S. GAAP measures nor should they be considered in isolation or as a substitute for an analysis of Valero’s results ofoperations as reported under U.S. GAAP. In addition, these non-GAAP measures may not be comparable to similarly titled measures used byother companies because Valero may define them differently, which diminishes their utility. Valero’s reconciliations of GAAP financialmeasures to non-GAAP financial measures are located at the end of this presentation.I N V E S T O R P R E S E N TAT I O N J U N E 2 0 2 12
REFININGRENEWABLE DIESELETHANOLWORLD’S LARGEST INDEPENDENTREFINERW O R L D ’ S 2 ND L A R G E S T R E N E W A B L E D I E S E LPRODUCERW O R L D ’ S 2 ND L A R G E S T C O R N E T H A N O LPRODUCERGROWTH PROJECTS FOCUSED ON COST CONTROL, OPTIMIZATION AND MARGIN EXPANSIONratable wholesale supply ofmillion barrels per day advantaged refining and logisticslowestof high-complexityassets well positioned for feedstock 1.2 million barrels per day orcostover 50% of our light productsrefineries producerthroughput capacityand product optimizationEXECUTING A VIABLE PATH TO REDUCE AND OFFSET GREENHOUSE GAS EMISSIONS153.2RenewableDieselRefiningEthanolHIGH RETURN PROJECTS WITH PRODUCTS PLACED INTO HIGH GROWTH, LOW CARBON MARKETS290milliongallonsper year1.2expanding tobillion gallonsper yearup tolow carbon intensity renewable dieselproduced from recycled animal fats, usedcooking oil and inedible corn oil80%reductionin GHGemissions100%compatible withexisting enginesand infrastructureCONTINUE TO DEVELOP ADDITIONAL LOW CARBON GROWTH OPPORTUNITIESDIAMOND GREEN DIESEL(DGD)DEVELOPING ECONOMIC PROJECTS TO FURTHER REDUCE CARBON INTENSITY13ethanolplants1.7billion gallons per yearproduction capacityhigh-octane renewablefuel with lower CO2emissionsup to30%reduction inGHG emissionsexisting logistics assets wellpositioned to support r of fuelsand products thatare essential tomodern lifeREDUCING CARBON INTENSITY THROUGH ANNOUNCED CARBON SEQUESTRATION PROJECTI N V E S T O R P R E S E N TAT I O N J U N E 2 0 2 13
Advancing the Future of Energy with Capital Discipline,Innovation and Unmatched ExecutionOperationsExcellenceEarnings GrowthUnmatched Execution with a ProvenHistory of Operations ExcellenceGrowth Through Innovation Safe, reliable, environmentallyresponsible operations have drivenhigher profitability and lowervolatility through multiplecommodity cycles Growth projects focused onoperating cost control, marketexpansion and margin improvement Disciplined capital allocation withsolid free cash flow and returns tostockholders across margin cycles Leveraging our global liquid fuelsplatform to expand our long-termcompetitive advantage withinvestments in economic low-carbonprojects Delivered on our target payout ratioof 40% to 50% every year undercurrent management The lowest cash operating costamong peer group while maintainingfirst quartile operating performance Applying our liquid fuelsmanufacturing expertise to optimizeour renewable diesel businessCapital DisciplineDemonstrated Commitment toStockholders 25% after-tax IRR hurdle rate forprojects 13% average Return on InvestedCapital for the five-years ending2019Steadfast in theexecution of ourstrategy, pursuingexcellence inoperations,investing forearningsgrowthwith lowervolatility andhonoring ourcommitmentto stockholderreturnsComprehensive liquid fuels strategy driving economic growth projects and providinga viable path to reduce and offset Refining GHG emissions by 63% by 2025I N V E S T O R P R E S E N TAT I O N J U N E 2 0 2 1See slides 23-24 for notes regarding this slide. See slides 43-53 for non-GAAP disclosures.Peer group includes PSX, MPC, HFC, and PBF.4
Comprehensive Roadmap to Further Reduce Emissionswith Projects in Execution31.82011 Base Year 2025 Target(Scope 1 & 2) (Scope 1 & 2)4.763%28.7Targeting to reduceand offset RefiningGHG emissions by1.4Million Metric Tons CO2e35.8Absolute Reductions and Offsets through Existing Board Approved Projects20%Metric Tons CO2e / Thousand BOEGHG Emissions IntensityTarget (Scope 1 & 2)5.97.911.9Refining GHGEmissions in2011(Scope 1 & 2)I N V E S T O R P R E S E N TAT I O N J U N E 2 0 2 1Absolute Emissions GHG EmissionsReduction throughOffset byEfficienciesEthanol(Scope 1 & 2)ProductionGHG EmissionsGHG EmissionsRefining GHGOffset byOffset by Global Emissions in 2025Renewable DieselCredits for & after Reductions &ProductionBlending ofOffsetsRenewable Fuels(Scope 1 & 2)See slides 23-24 for notes regarding this slide.63%through investmentsin Board approvedprojects, with thepotential to achieve72%by 2025 withprojects underconsiderationsubject to Boardapproval5
Expanding Our Long-term Competitive Advantage withInvestments in Economic Low-carbon Transportation Fuels 1.2 to 1.6 billion in Annual EBITDA from Growth ProjectsVisibility to Earnings Growth(expected completion / project cost) 10,500 2009: 1,747 MMPro FormaEBITDA 1.2 - 1.6 bnI N V E S T O R P R E S E N TAT I O N J U N E 2 0 2 1Reinvesting capitalwith diversificationinto highergrowth,higherreturn andlowercarbonrenewablefuels Pembroke Cogeneration Unit(3Q21 / 170 MM) Diamond Pipeline Expansion(4Q21 / 100 MM)2020: 778 MM 1.2 to 1.6 billion in Annual EBITDAContribution from Growth ProjectsRenewables ExpansionEBITDA ( in millions)Projects in ExecutionAverage: 6,409 MMProjects in Development2012 – 2019RangeAdjusted EBITDA Attributable to VLO Stockholders( in millions) 8,892 MM 4,660 MMRefining Optimization andMargin ImprovementSt. CharlesAlkylation UnitCompleted 4Q20Port ArthurCoker2023 / 975 MMOther Refiningand LogisticsProjectsDiamond GreenDiesel 24Q21 / 550 MMOtherProjects inExecutionEBITDA fromGrowth ProjectsSee slides 23-24 for notes regarding this slide. See slides 43-53 for non-GAAP disclosures.Joint venture investments, including Diamond Green Diesel, reflect Valero’s ownership interest.6
Global Low-carbon Fuel Policies Driving DemandGrowth for Renewable DieselCalifornia RenewableDiesel Consumption(million gallons)589Active Low-carbonMandatesCarbon Mandatesin Development orGHG Emissions GoalPotentialPoliciesI N V E S T O R P R E S E N TAT I O N J U N E 2 0 2 1202020192018 200 100Source: California Air Resources Board. LCFS creditprice through March 2021.72021 02020 New York continues to evaluate an LCFS in order to meet its goal of reducing emissions 85% by 2050 New Mexico, Minnesota and other Midwest states are exploring renewables mandates(monthly average, per metric ton)2019 LCFS Credit Price2018Clean Fuel Standard (CFS) –Reduce the carbon intensity of transportationenforcement expected 2022fuels by 13%Renewable Energy Directive II Replace 14% of transport fuels with renewable40%Net-zero by 2050(RED II)energyOregon’s Clean Fuels Program requires a 10% carbon intensity reduction by 2025; has proposed a 25% reduction by 2035Washington State’s legislature has passed an LCFS that requires a 20% carbon intensity reduction by 2038British Columbia and Ontario have existing low-carbon fuels policiesSweden currently has a 21% GHG reduction requirement for diesel in 2020, with further reductions proposedFinland aims for 30% of transport fuels to be biofuels by 2030Net-zero by 20502017Reduce the carbon intensity of transportationfuels by at least 20%2017Low Carbon Fuel Standard(LCFS)2016Net-zero by 2045201640%20152030 Liquid Fuels Goal2014Primary Transportation FuelPolicy Mechanism30%EUOther Policiesin PlaceNet-zero GHGEmissions Target2015Canada2030 GHG EmissionsReduction Target2014California113
Renewable Diesel Driving Low Carbon Results in CaliforniaCalifornia LCFS PerformanceLCFS Credit by Fuel Type(% reduction in carbon intensity)(2020)Cost-effectivefuel that can beused withexisting ricity(on-road charging)11%RenewableDiesel30%-10%Historic Compliance TargetsReported % CI ReductionFuture Compliance 202022I N V E S T O R P R E S E N TAT I O N J U N E 2 0 2 Source: California Air Resources Board. Totals may not crossfoot due to rounding.Does notrequireinfrastructureinvestmentsOver 2.5 billiongallonsconsumed inCaliforniasince 20118
Expansion into Low-carbon Renewable Fuels Underpinned byHigher Economic ReturnsRenewable Diesel CapacityRenewable Diesel Realized Cash Flow Profile(million gallons per year)( in millions)1,160 1,326 million cumulative EBITDA 791 million cumulative Capex 1,350 1,135Cumulative EBITDA470DGD 1 Cumulative CapexDGD 2 Cumulative CapexDGD 3 Cumulative CapexNet Cumulative Cash Flow(EBITDA less Capex) 725 MM Capex 920 705 490 275400 60( 155)16011515( 370) 550 MM Capex( 585)( 800)2013201820202021DGD 1DGD 1 ExpansionDGDDGD 2St. CharlesSt. CharlesOptimization St. Charles2023DGD 3Port ArthurI N V E S T O R P R E S E N TAT I O N J U N E 2 0 2 120232011 2012 2013 2014 2015 2016 2017 2018 2019 2020 1Q21See slides 23-24 for notes regarding this slide. See slides 43-53 for non-GAAP disclosures.Diamond Green Diesel EBITDA and Capex reflects Valero’s 50% share.Mix shift torenewablefuels shoulddrive higherReturn onInvestedCapital9
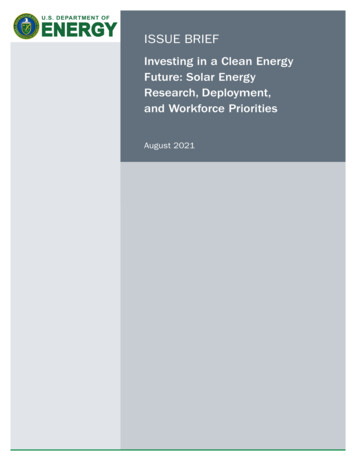
A Vehicle Running on Renewable Diesel EmitsOver 40% Fewer Emissions than an Electric VehicleU.S. Light-Duty Vehicle Life Cycle EmissionsU.S. Heavy-Duty Long-Haul Vehicle Life Cycle EmissionsArgonne National Laboratory (DOE) StudySouthwest Research Institute Studyg CO2/mile400350FuelFeedstockVehicle Manufacturing“Zero emissions”vehicles are notzero emissionsemissionsthan an EV2502001,200Battery Electric VehicleDGD’s800renewable dieselemits even feweremissions60015049% feweremissions thanan EV after1,000,000miles traveledA single heavy-duty long-haulvehicle running on renewablediesel emits 561 tons lesselectric vehicle, an amountequal to planting 8,4821000vehicle, an amount equal toplanting 435 trees*CO2 emissions than an40020050A single light-duty vehiclerunning on renewable dieselemits 29 tons less CO2emissions than an electricDiesel Engine with Renewable Diesel1,00040% fewer300Tons CO2RENEWABLE DIESELA DROP-IN FUELtrees*0Battery ElectricVehicleDiesel Engine with DieselDieselEngineEnginewithwithRenewable Diesel ean-based) (waste(wasteoil-based)oil-based)I N V E S T O R P R E S E N TAT I O N J U N E 2 0 2 1Embedded0 MilesTraveledEmissions(zero miles traveled)500,000 es1,000,000TraveledTraveledSource: Argonne National Laboratory (DOE) and Southwest Research Institute.See slides 23-24 for notes regarding this slide.*Estimated based on EPA’s GHGEquivalencies calculator for urban treeseedlings grown for ten years.10
Our Competitive Advantage withDiamond Green Diesel (DGD)Applying ourliquid fuelsmanufacturingexpertise tooptimize ourrenewabledieselbusinessDGD is Designed to Process Low CarbonFeedstocks for Higher Product Value 1.86 1.68Carbon Intensity (g CO2 e / MJ)LCFS credit value ( per gallon) 1.55 0.871008158202732Used Cooking OilDistillers Corn OilAnimal FatsSoybean OilGrid ElectricityHigher EBITDA Margin 2.25 2.18 2.19Renewable Diesel Peer 1.09 0.93 2.34 2.24 1.62 1.58 1.53 1.13 2.77(adjusted EBITDA per gallon)Valero (DGD)Diesel 0.95 0.47201520162017I N V E S T O R P R E S E N TAT I O N J U N E 2 0 2 12018201920201Q21Source: Company reports and California Air Resources Board.See slides 23-24 for notes regarding this slide. See slides 43-53 for non-GAAP disclosures.11
Developing Economic Paths to Further Reduce the CarbonIntensity of Our Products Partnering with BlackRock and Navigator for a large-scalecarbon capture and storage project 1,200 mile pipeline is expected to span across five Midwest states Valero is expected to be the anchor shipper with eight of its ethanol plantsconnected to the carbon capture pipeline Navigator is expected to lead the construction and operations of the system,with operations anticipated to begin late 2024 Project driven by strong economic returns 45Q Tax Credit of 50 per metric ton of CO2 captured and stored(1) Approximately 50 cents per gallon uplift on the lower carbon intensityethanol in LCFS marketsMap is indicative only. Exact pipeline route subject to change following the conclusion of Open Season.(1) Typical CO production from ethanol plants is 0.003 metric tons per gallon of ethanol produced.2Growth Through Innovation in RenewablesIncreasing RenewableDiesel productionAdvancing RenewableNaphtha productionI N V E S T O R P R E S E N TAT I O N J U N E 2 0 2 1Developing SustainableAviation Fuel (SAF)Developing RenewableHydrogenEvaluating additional CarbonSequestration opportunities12
SIZE, SCALE AND GLOBAL REACHLOWEST COST PRODUCERDISCIPLINED INVESTMENTSEXTENSIVE CONNECTIVITY AND GLOBAL OPTIMIZATIONTOP QUARTILE OPERATIONSGROWTH WITH LOWER VOLATILITYPREMIER REFINING PORTFOLIO THAT IS RESILIENT EVEN IN A CARBON-CONSTRAINED IZE, SCALE AND GLOBAL REACHhigh complexity coastal systemwith extensive connectivity toinland and imported crudesoperational flexibility toprocess a wide range offeedstocksratable wholesale supply of1.2 million barrels per day orover 50% of our light productsglobal operations support optimization ofproduct exportsone of the largest light products importersinto Mexico 2,213LOWEST COST PRODUCER WHILE ACHIEVING TOP QUARTILE OPERATIONSsafety and reliability are imperativefor profitabilitytop quartile mechanical availabilityminimizes unplanned downtime and costsHighestFree Cash Flowwithin PeerGroupaccess to cheap natural gas and a deep poolof skilled labor on the U.S. Gulf CoastINVESTMENTS IN EFFICIENCY, MARKET EXPANSION AND HIGHER MARGIN CAPTUREreducing cost and improving margincapture Wilmington and Pembroke cogens St. Charles and Port Arthur hydrocrackers Port Arthur coker Houston and St. Charles alkylation unitsI N V E S T O R P R E S E N TAT I O N J U N E 2 0 2 1improving feedstock flexibility, cost andcrude quality Diamond, Sunrise and Red River pipelines connectivity in Corpus Christi Line 9 into Quebec Houston and Corpus Christi toppersgrowing market share into higher netbackmarkets Central Texas pipelines and terminals Pasadena terminal expansion into Latin America withinvestments in Mexico and PeruSee slides 23-24 for notes regarding this slide. See slides 43-53 for non-GAAP disclosures.Peer group includes PSX, MPC, HFC, and PBF.Peer RangeAverage Free Cash Flow2012 – 2020 0( in millions)13
Investments inreliability havecontributed tooperationsexcellenceSafety and Reliabilityare Imperative for ProfitabilityIn 2020, we delivered our best year ever on safety performanceand had the lowest number of environmental events in company historyTier 1 Process Safety0.90Valero0.68Industry0.400.23Process Safety EventRateTotal Recordable IncidentRate (TRIR)Personnel Safety2010 2011 2012 2013 2014 2015 2016 2017 2018 2019 2020(three-year rolling averages)0.190.062010 2011 2012 2013 2014 2015 2016 2017 2018 2019 2020Improvement Versus Industry Benchmarks Leads to Greater Margin Capture, LowerOperating Expenses and Better Efficiency1st Quartile2nd Quartile20183rd Quartile20084th QuartilePersonnel IndexI N V E S T O R P R E S E N TAT I O N J U N E 2 0 2 1Maintenance IndexNon-Energy Cash OpexSee slides 23-24 for notes regarding this slide.14
Increased Refinery Availability Has DrivenValero to be the Lowest Cost ProducerImprovement in Mechanical AvailabilityVersus Industry BenchmarksRefining Cash Operating ExpensesPer Barrel of Throughput(excludes turnaround and D&A expenses)Peer Range 7.001st Quartile201820182nd Quartile20083rd Quartile4th Quartile 3.00201020122014201620182020Mechanical AvailabilityI N V E S T O R P R E S E N TAT I O N J U N E 2 0 2 1See slides 23-24 for notes regarding this slide. Peer group includes PSX, MPC, HFC, and PBF.15
Refining Business Generates Significant Cash toSupport Growth and Stockholder ReturnsSources and Uses of Cash – Cumulative Five Years: December 31, 2014 to December 31, 2019( in billions)Sources of Cash 25.8 1.1Uses of Cash 13.1Sustaining capital ( 7.8)Growth capital ( 4.1)Acquisitions ( 1.2) 14.1Dividends ( 6.1)Buybacks ( 8.0) 3.7 2.6( 0.8)Cash and Cash Equivalents Net Cash Provided byDecember 31, 2014Operating ActivitiesOther FinancingActivitiesI N V E S T O R P R E S E N TAT I O N J U N E 2 0 2 1Capital InvestmentsAttributable to ValeroStockholder ReturnsOtherCash and Cash EquivalentsDecember 31, 201916
Disciplined Capital Management is a Constant inOur Strategy1Maintain Strong Balance SheetMaintain investment grade credit rating2Target 20% to 30% net debt-to-cap ratioNon-discretionarySustaining CapexDividend Target approximately 1.5 billion annually Commitment to stockholders Key to safe and reliable operations Targeting a sustainable and growing dividend with a payoutthat is at the high end of our peer group3DiscretionaryGrowth Capex 25% after-tax IRR hurdle rate for projectsAcquisitions Evaluate versus alternative uses of cash Refining projects focused on operating costcontrol, market expansion and marginimprovement Renewable fuels expansionI N V E S T O R P R E S E N TAT I O N J U N E 2 0 2 1Buybacks Targeting an annual payout ratio between40% and 50% of adjusted net cashprovided by operating activities Stock buyback program consists of ratableand opportunistic purchasesSee slides 23-24 for notes regarding this slide.17
Demonstrated Discipline in Capital AllocationAnnual Capital Investments Attributable to Valero( billion) 3.4Sustaining 2.8Estimated Capital Investments Attributable to Valero 2.0 Billion for 2021Growth 2.7 2.660% 2.6 2.2 1.4 0.7 2.0 1.5 0.9 1.0 0.6 2.0 50% 2.0Total Capital InvestmentsAttributable to Valero 0.9 0.9 100% 1.92012RenewablesOther Growth40% 2.4 1.8 1.5SustainingGrowth 1.42013 1.22014 1.52015 1.42016 1.12018portfolioSustaining Capex as a percentage ofDepreciation and Amortization 1.7 1.32017Growth Capital InvestmentsAttributable to ValeroSteadyinvestmentsto maintain a safeand reliableasset base andenhance themargincapability of our20192020Steady investments toimprove portfolio efficiency2021E201276%Over 50% ofgrowth capex isallocated to2019renewablesSustaining includes costs for turnarounds and catalysts and regulatory compliance. Growth includes joint-venture investments but excludes acquisitions. Sustaining and growth excludes 50% of DGD’s sustaining and growthcapex attributable to our joint venture partner and those related to other variable interest entities. Renewables reflects DGD and ethanol. See slides 43-53 for non-GAAP disclosures. Totals may not crossfoot due to rounding.I N V E S T O R P R E S E N TAT I O N J U N E 2 0 2 118
Delivering on Our Commitment of Cash Returns toStockholdersAnnual Dividend Per Share and Weighted AverageShares Outstandingas a Percentage Relative to 2012StockholderReturns556 millionsharesPayout Ratio:11%30%31%54%65%63%56%47%184% 3.7100% 99%S&P 50095%Energy83% 3.180%( billion) 2.4BuybacksDividends 2.8 1.3 1.4 0.8 3.60 3.20 0.2 2.80 2.40 0.9 0.3 0.4 0.5 0.674% 73% 73% 3.92 3.92 1.8 1.3 0.677% 1.7 1.9 1.4407 millionsharesWASODividend/share 2.3 0.8 1.1 1.2 1.4 1.52012 2013 2014 2015 2016 2017 2018 2019 2020 0.85 1.052012 2013 2014 2015 2016 2017 2018 2019 2020 2021(1)4.0%Utilities3.1%Real .6%Health Care1.6%Industrials 1.70 1.6 0.651.4%4.8%90% 2.6Annual DividendYield(2)Delivering cashreturns throughsustainabledividendgrowth anddiscretionarybuybacks1.3%Tech0.9%Cons. Disc.0.8%Comm.Services0.7%Source: Bloomberg as of May 14, 2021. See slides 43-53 for non-GAAP disclosures. Totals may not crossfoot due to rounding.(1) 2021 weighted average shares outstanding through March 31, 2021. Dividend per share annualized based on most recent quarterly dividend.(2) Dividend yield for sectors reflects the Index Yield of the respective SPDR exchange-traded fund (ETF).I N V E S T O R P R E S E N TAT I O N J U N E 2 0 2 119
Demonstrated Lower Volatility in Earnings andFree Cash FlowVolatility2012 – 2020Average Free Cash Flow2012 – 2020S&P 500 Free Cash Flow Volatility and Return Profile2012 – 2020Refining Peer RangeAverage TTM Free Cash Flow as a % of Market Cap10% 2,2138% 00% Millions% of AverageMarket Cap87%Free CashFlowI N V E S T O R P R E S E N TAT I O N J U N E 2 0 2 178%AdjustedEPS56%EBITDABESTValero hasdemonstratedValerolowervolatility inearnings andfree cash onServicesRefining onsumerStaplesMaterialsOil Majors2%Energy0%UtilitiesReal Estatethan otherrefiners,integrated energycompanies andmost S&P 500sectorsWORST-2%0%100%200%300%400%Free Cash Flow VolatilitySource: Bloomberg and company reports.See slides 23-24 for notes regarding this slide. See slides 43-53 for non-GAAP disclosures.20
Valero’s Positioning Relative to the S&P 500 IndexDividend YieldValueGrowthBalance Sheet4.8%VLO3.9%Company 2Company B278%4.8%Company 3Company 43.3%Company 53.3%1st QuartileCompany DCompany ECompany 6( billion)3rd Quartile2nd QuartileA/R Facility 1.04th Quartile3.7%Company CCompany FCash 2.03.0%Compelling Dividend Yield( 3% Annualized dividend yield)Competitive EBITDA Growth( 10% Consensus CAGR for2020A - 2022E)High Stockholder Return( 10% 5-YR Average ROIC &Positive TSR since 2014) 8.0 billionin availableliquidityInvestment GradeCredit Facilities 4.9Large Cap(BBB- / Baa3)(Market cap 10 billion)7.1xConse nsus EBIT DAGrowth 2 020-2022 CAGRDividen d YieldConsensus EBITDA DividendCAGRYield2020A - 2022ES&P 500202 2 EV / E BITDAMultipleEV / 2022EEBITDAValero Liquidity(As of March 31, 2021)I N V E S T O R P R E S E N TAT I O N J U N E 2 0 2 1Premier Refiningportfolio that isresilient even in acarbon-constrainedscenarioLowest cost producerGrowth throughinnovation inRenewablesCommitted toStockholder returnswith a target payoutratio of 40% to 50%Comprehensiveroadmap to reduceemissions throughinvestments in Boardapproved projects500Source Bloomberg as of May 14, 2021.See slides 23-24 for notes regarding this slide. Totals may not crossfoot due to rounding.21
Appendix ContentsTopicSlideNotes23-24VLO GuidanceEnvironmental, Social and Governance (ESG)2526-27Strong Presence in Advantaged U.S. Gulf Coast and Mid-Continent28Crude Supply Advantage in the U.S. Gulf Coast and Mid-Continent29Global Optimization of Operations and Product Exports30-32Ratable Global Wholesale Supply and Growth in Mexico33Valero’s Logistics Assets34Ethanol35Projects in Execution Phase or Recently Completed36-39Refining Capacity and Nelson Complexity40Now vs. Then – A Shift in Valuation41Electric Vehicle (EV) Myth: Zero Emissions42Non-GAAP DisclosuresI N V E S T O R P R E S E N TAT I O N J U N E 2 0 2 143-5322
NotesPayout RatioPayout Ratio is the sum of dividends and stock buybacks divided by adjusted net cash provided by operating activities. Adjusted netcash provided by operating activities excludes changes in working capital and 50% of DGD’s operating cash flow (excluding thechange in its working capital) attributable to our joint venture partner.Light ProductsLight products is the combined volume of gasoline and distillate. Gasoline volume includes blendstocks and distillate volumeincludes ULSD, jet fuel, kerosene, and ULSK.Slide 5Valero’s Sustainable Accounting Standards Board (SASB) Report aligns its performance data with the recommendations of the SASBframework in the Oil and Gas – Refining and Marketing industry standard. A copy of Valero’s SASB report and related disclosurescan be found on Valero’s investor relations website at Investorvalero.com.Slide 6 and Slide 36Amounts shown represent targeted EBITDA growth. Valero is unable to provide a reconciliation of such forward-looking targetsbecause certain information needed to make a reasonable forward-looking estimate is difficult to estimate and dependent onfuture events, which are uncertain or outside of its control, including with respect to unknown financing terms, project timing andcosts, and other potential variables. Accordingly, a reconciliation is not available without unreasonable effort.Slide 10U.S. Light-Duty Vehicle Life Cycle Emissions study conducted by Argonne National Laboratory (DOE) – “Cradle-to-Grave LifecycleAnalysis of U.S. Light-Duty Vehicle-Fuel Pathways: A Greenhouse Gas Emissions and Economic Assessment of Current (2015) andFuture (2025-2030) Technologies.” Study focused on the midsize sedan, assumed 15 year vehicle life, renewable diesel emissionsare based on 100% renewable diesel blend, electricity based on 2014 EIA average mix, no battery replacement for 210 mile rangeelectric vehicle, DGD waste oil feedstock CI’s have at least 40% less emissions than soybean based renewable diesel.U.S. Heavy-Duty Long-Haul Vehicle Life Cycle Emissions study conducted by Southwest Research Institute – “Class 8 Truck Life CycleAnalysis” (2020). Class 8 heavy-duty truck with a one-million mile ( 15 years) lifetime; electric truck with a 500-mile battery range,electricity based on GREET Distributed U.S. Mix Variable 2020-2035, no battery replacement; 15L diesel engine running on 100%renewable diesel, renewable diesel carbon intensity based on CARB’s 2019 LCFS Quarterly Data Summary.Slide 11California LCFS credit values are for 2021, assuming 200 per metric ton carbon price. Renewable diesel peer reflects NesteCorporation.I N V E S T O R P R E S E N TAT I O N J U N E 2 0 2 123
NotesSlide 14Industry Total Recordable Incident Rate (TRIR) from U.S. Bureau of Labor Statistics. Valero TRIR includes refining employee andcontractor data. Tier 1 three-year rolling averages of refining process safety events per 200,000 work hours. Tier 1 defined withinAPI Recommended Practice 754. Industry benchmarking and Valero’s performance statistics from Solomon Associates and Valero.Slide 15Industry benchmarking and Valero’s performance statistics from Solomon Associates and Valero. Valero’s refining operationstypically consume approximately 905,000 MMBtu/day of natural gas, of which 66% is operating expense and the balance is cost ofgoods sold.Slide 17Targeted net debt-to-cap ratio based on total debt reduced by balance sheet cash. Peer group includes PSX, MPC, HFC, and PBF.Payout ratio is the sum of dividends and stock buybacks divided by adjusted net cash provided by operating activities. Adjusted netcash provided by operating activities excludes changes in working capital and 50% of DGD’s operating cash flow (excluding thechange in its working capital) attributable to our joint venture partner.Slide 20Free cash flow is defined as net cash provided by operating act
This presentation contains forward-looking statements made by Valero Energy Corporation ("VLO"or "Valero")within the meaning of federal securities laws. These statements discuss future expectations, contain projections of results of operations or of financial condition or state other forward-looking information.