Transcription
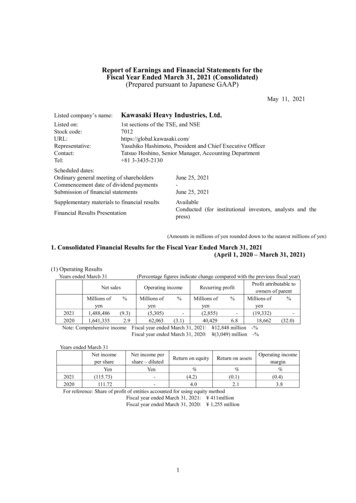
Report of Earnings and Financial Statements for theFiscal Year Ended March 31, 2021 (Consolidated)(Prepared pursuant to Japanese GAAP)May 11, 2021Listed company’s name:Kawasaki Heavy Industries, Ltd.Listed on:Stock code:URL:Representative:Contact:Tel:1st sections of the TSE, and NSE7012https://global.kawasaki.com/Yasuhiko Hashimoto, President and Chief Executive OfficerTatsuo Hoshino, Senior Manager, Accounting Department 81 3-3435-2130Scheduled dates:Ordinary general meeting of shareholdersCommencement date of dividend paymentsSubmission of financial statementsSupplementary materials to financial resultsFinancial Results PresentationJune 25, 2021June 25, 2021AvailableConducted (for institutional investors, analysts and thepress)(Amounts in millions of yen rounded down to the nearest millions of yen)1. Consolidated Financial Results for the Fiscal Year Ended March 31, 2021(April 1, 2020 – March 31, 2021)(1) Operating ResultsYears ended March 31(Percentage figures indicate change compared with the previous fiscal year)Profit attributable toNet salesOperating incomeRecurring profitowners of parentMillions of%Millions of%Millions of%Millions .0)Note: Comprehensive income Fiscal year ended March 31, 2021: 12,848 million -%Fiscal year ended March 31, 2020: (3,049) million -%Years ended March 31Net incomeNet income perReturn on equity Return on assetsper shareshare – 2.1For reference: Share of profit of entities accounted for using equity methodFiscal year ended March 31, 2021: 411millionFiscal year ended March 31, 2020: 1,255 million1Operating incomemargin%(0.4)3.8
(2) Financial ConditionMarch 31Total assetsNet assetsMillions of yen1,963,27620211,957,8452020For reference: Shareholders’ equityEquity ratioMillions of yen482,775471,562March 31, 2021:March 31, 2020:Net assets per share%23.723.3 465,332 million 455,627 millionYen2,785.712,727.59(3) Cash Flow PositionYears ended March 31Cash flows fromoperating activitiesCash flows frominvesting activitiesCash flows fromfinancing activities(Millions of yen)Cash and cash equivalentsat end of 69,401)115,803102,5462. DividendsYears ended/ending March 31Recorddate orterm2020Dividend per share1Q2Q3QYear-endFull aid(annual)Millions ofyen5,846Payout ratio(consolidated)Dividends /Net 0.0029.5(forecast)Note: The Company’s Articles of Incorporation stipulate that the last day of the second quarter and the last dayof the fiscal year are the dates of record for dividends. Dividends forecast for the fiscal year endingMarch 31, 2022 has been prepared for the full fiscal year only. As it is not possible to forecast the interimand year-end dividends separately, only the total annual dividends are presented.3. Forecast of Consolidated Earnings for the Fiscal Year Ending March 31, 2022(April 1, 2021 – March 31, 2022)Net salesFull yearMillions ofyen1,500,000%0.8(Percentage figures indicate change compared with the previous fiscal year)Profit attributable toEarningsOperating incomeRecurring profitowners of parentper shareMillions of%Millions of%Millions of%Yenyenyenyen30,00020,00017,000101.772
Notes1) Changes affecting the status of material subsidiaries (scope of consolidation): None2) Changes in accounting policies, changes in accounting estimates, and correction of errors(1) Changes in accounting policies in accord with revisions to accounting standards: None(2) Changes in accounting policies other than (1): None(3) Changes in accounting estimates: None(4) Correction of errors: None3) Number of shares issued and outstanding (common stock)(1) Number of shares issued as of period-end (including treasury stock)March 31, 2021:167,080,532 sharesMarch 31, 2020:167,080,532 shares(2) Number of shares of treasury stock as of period-endMarch 31, 2021:38,282 sharesMarch 31, 2020:36,587 shares(3) Average number of shares during respective periodsMarch 31, 2021:167,043,192 sharesMarch 31, 2020:167,044,577 shares(Reference) Financial Results of the Company for the Fiscal Year Ended March 31, 2021(April 1, 2020 – March 31, 2021)(1) Operating ResultsYears ended March 31(Percentage figures indicate change compared with the previous fiscal year)Net sales2021202020212020Millions ofyen1,098,6611,250,354Operating income%(12.1)4.6Net incomeper shareYen(214.24)64.78Millions ofyen(50,722)20,463%34.6Recurring profitMillions ofyen(35,544)17,141%80.0Net IncomeMillions ofyen(35,788)10,822%(28.3)Net income pershare – dilutedYen-(2) Financial ConditionMarch 31Total assetsMillions of yen1,630,5711,609,2052020For reference: Shareholders’ equity2021Net assetsEquity ratioMillions of yen287,749323,836March 31, 2021:March 31, 2020:3%17.620.1 287,749 million 323,836 millionNet assets per shareYen1,722.611,938.63
*Report of Earnings and Financial Statements are not subject to audit.*Appropriate Use of Financial Forecasts and Other Important MattersForward-Looking StatementsThese materials contain various forward-looking statements and other forecasts regarding performanceand other matters. Such statements are based on information available at the time of their preparation, anddo not mean that the Company promises to achieve these figures. Actual results may differ from thoseexpressed or implied by forward-looking statements due to a range of factors. For assumptions underlyingearnings forecasts and other information regarding the use of such forecasts, refer to “1. Overview ofoperating results (4) Consolidated earnings outlook” on page 12 in the Accompanying Materials.How to Obtain Supplementary Material on Financial Results and Details of the Financial ResultsThe Company plans to conduct a presentation for institutional investors, analysts and the press onTuesday May 11, 2021, and to post the presentation material on financial results to be used for thepresentation on TDnet and the Company’s website simultaneously with the announcement of financialresults.4
Accompanying Materials – Contents1. Overview of operating results6(1) Consolidated operating results6(2) Consolidated financial condition11(3) Cash flows11(4) Consolidated earnings outlook122. Basic rationale for selecting accounting standards123. Consolidated Financial Statements13(1) Consolidated balance sheets13(2) Consolidated statements of income and comprehensive income15(3) Consolidated statement of changes in net assets17(4) Consolidated statements of cash flows20(5) Notes on financial statements21Notes on the going-concern assumption21Related to consolidated statements of balance sheets21Related to consolidated statements of income21Segment information22Per share data25Material subsequent events254. Supplementary information on earnings forecasts for the fiscal year ending March 31, 2022526
1. Overview of operating results(1) Consolidated operating resultsWith the spread of variants of the virus that causes COVID-19 around the world, the outlook for anend to the pandemic remains uncertain. However, due to the progress of vaccination mainly indeveloped countries, there has been a decrease in the number of new infections in some areas, andthere are also signs of a recovery in demand for short-distance flights and an increase in demand forair freight in the United States and Japan. In addition, there are promising signs that the globaleconomy will recover in the future, such as supporting the economy through fiscal and monetarypolicies of each country and efforts to realize a decarbonized society. As U.S.-China relations remainunimproved, it is necessary to continue to pay close attention to the downside risks of the globaleconomy.Amid such an operating environment, the Group’s orders received in the fiscal year ended March31, 2021, decreased versus the previous fiscal year, in the Aerospace Systems segment and the RollingStock segment despite the increase in the Ship & Offshore Structure and the Precision Machinery &Robot segment. Net sales decreased versus the previous fiscal year overall, due to decrease in theAerospace Systems segment and other segments despite increase in the Precision Machinery & Robotsegment and other segment. Operating income declined, due to deterioration in profitability in theAerospace Systems segment and other factors, despite the improvement in the Motorcycle & Enginesegment. Recurring profit declined due to a decline in operating income despite foreign exchangegains and reversal of the provision for the in-service issues of commercial aircraft. Net incomeattributable to owners of parent decreased due to impairment loss being recorded underextraordinary loss as well as the decline in recurring profit despite decrease in tax expense due torecognition of deferred tax assets.As a result, the Group’s consolidated orders received decreased 111.0 billion versus the sameperiod of the previous fiscal year to 1,402.4 billion, consolidated net sales decreased 152.8 billionyear on year to 1,488.4 billion, operating loss came to 5.3 billion, deteriorating 67.3 billion yearon year, recurring loss totaled 2.8 billion, deteriorating 43.2 billion year on year, and net lossattributable to owners of parent came to 19.3 billion, deteriorating 37.9 billion year on year. ROIC*was 1.0% negative, while ROE was 4.2% negative.* Before-tax ROIC EBIT (earnings before income taxes interest expenses) invested capital(interest-bearing debt shareholders’ equity)The Company has changed the fiscal year-end of its six consolidated subsidiaries from December 31to March 31 or to a provisional fiscal year-end method. As a result, in the fiscal year ended March 31,2021, the accounting period of 6 consolidated subsidiaries is 15 months (January 1, 2020 to March 31,2021).6
Consolidated operating performance in the fiscal year ended March 31, 2021, is summarizedby segment below.Segment InformationSegment net sales, operating income, and orders received (billions of yen)Fiscal year ended March 312020(A)2021(B)Orders receivedChange (B – A)Fiscal year endedMarch geSalesincomeSalesincomeSalesincome(A)(B)(B – 111.0)Energy System& PlantEngineeringPrecisionMachinery &RobotShip & OffshoreStructureRolling StockMotorcycle &AdjustmentsTotalNotes: 1. Net sales include only sales to external customers.2. The Motorcycle & Engine segment’s orders received are equal to its net sales as production is based mainlyon estimated demand.7
Aerospace SystemsRegarding the business environment surrounding the Aerospace Systems segment, there is a certainlevel of demand from the Ministry of Defense in Japan amid the tight defense budget. With respect tocommercial aircraft, global passenger demand has been sluggish due to the COVID-19 pandemic anddemand for commercial aircraft airframes and jet engines has declined.Amid such an operating environment, consolidated orders received decreased 85.4 billion year onyear to 329.5 billion due to decreases in orders for component parts of airframes and jet engines forcommercial aircraft, despite an increase in orders received from the Ministry of Defense in Japan.Consolidated net sales decreased 154.8 billion year on year to 377.7 billion due to decreases incomponent parts of airframes for Ministry of Defense in Japan and commercial aircraft, andcomponent parts of commercial aircraft jet engines.Operating loss came to 31.6 billion, deteriorating 74.4 billion year on year, mainly due to adecrease in sales.Energy System & Plant EngineeringRegarding the business environment surrounding the Energy System & Plant Engineering segment,in Japan, there is ongoing demand for replacing aging facilities for refuse incineration plants, whileover the medium to long term, demand for distributed power sources in Japan and overseas, and forenergy infrastructure development in emerging markets, remains firmly rooted. On the other hand,although there are signs of economic recovery in the Chinese market, where the virus has beensuccessfully contained at a relatively early stage, and in some developed countries where the infectionis showing signs of abating, there are concerns about the impact on some sales and after-sales serviceactivities because restrictions on the movement of people remain significant.Amid such an operating environment, consolidated orders received amounted to 219.0 billion, adecrease of 33.3 billion compared to the same period of the previous year, when the Companyreceived orders for major construction of domestic waste disposal facilities.Consolidated net sales decreased by 2.8 billion to 240.1 billion compared to the same period ofthe previous year, when the Company recorded sales to overseas chemical plants, despite an increasein the volume of work on domestic waste disposal facilities and higher sales of Gas Turbine CombinedCycle (GTCC) power plants in Japan.Operating income decreased 4.1 billion year on year to 13.4 billion due to the decrease in revenue,as well as losses on operations resulting from the effect of COVID-19 pandemic.8
Precision Machinery & RobotRegarding the business environment surrounding the Precision Machinery & Robot segment, in theprecision machinery field, the Chinese construction machinery market recovered quickly from theimpact of the spread of the COVID-19 pandemic and recorded record-high sales of hydraulicexcavators. While construction machinery markets outside China had stagnated, with demanddeclining significantly due to the impact of the pandemic, lately there have been very clear signs of arecovery in demand. In the robot field, while postponements of some general-purpose robots projectsdue to the impact of the COVID-19 pandemic, sales of general industrial robots have been solid in theChinese market where the recovery in sales of such robots was rapid. With respect to robots for thesemiconductor market, performance is strong due to increased capital investment by manufacturers ofsemiconductor manufacturing equipment, and demand is expected to steadily expand over the mediumto long term as well.Amid such an operating environment, consolidated orders received increased 40.5 billion year onyear to 259.4 billion, due to increases in hydraulic components for the construction machinery marketand robots for the semiconductor and vehicle body assembly markets.Consolidated net sales increased by 23.4 billion year on year to 240.8 billion due to increases inhydraulic components for the construction machinery market and robots for the semiconductor andvehicle body assembly markets.Operating income increased 1.8 billion year on year to 14.0 billion due to the increase in revenue.Ship & Offshore StructureRegarding the business environment surrounding the Ship & Offshore Structure segment, despitethe emergence of demand for gas-fueled vessels in conjunction with tighter environmentalregulations taking shape, the situation remains challenging due to the limited number of businesstalks on new projects due to the continued uncertainty of the global economy.Amid such an operating environment, consolidated orders received increased by 41.8 billion to 98.1 billion from the previous fiscal year due to orders for a submarine for Ministry of Defense inJapan.Consolidated net sales increased 7.7 billion year on year to 79.4 billion, mainly due to anincrease in the volume of work of submarines for Ministry of Defense in Japan.Operating loss worsened by 2.4 billion year on year to 3.0 billion mainly due to the posting oflosses from operations, despite the increase in revenue.Rolling StockRegarding the business environment surrounding the Rolling Stock segment, the effect of theCOVID-19 pandemic has led to a review of railway-related investment plans in Japan, and delays inwork processes as well as postponement and cancellation of biddings overseas. In the medium andlong term, however, relatively stable growth is expected around the world due to development of9
urban transportation as an environmental protection measure and to ease congestion in large citiescaused by increasing population concentration, as well as demand for railway infrastructurefollowing economic development in Asian countries.Amid such an operating environment, consolidated orders received amounted to 77.0 billion, adecline of 48.7 billion compared with the previous fiscal year, when the Company received ordersfor large-scale projects in Japan.Consolidated net sales decreased 3.3 billion year on year to 133.2 billion, due to a decrease insales of railcars for the United States.Operating loss worsened by 0.7 billion year on year to 4.5 billion, mainly due to a deteriorationin the profitability of overseas projects caused by the impact of the COVID-19 pandemic in additionto the decrease in revenue.Motorcycle & EngineRegarding the business environment surrounding the Motorcycle & Engine segment, the COVID19 spread in the main markets. In the United States, a major market, demand for off-road models suchas four-wheeled vehicles increased compared with the previous year, and in the European market,although there was a temporary negative impact from the lockdown in various countries in the earlyspring, the level has recovered to the level of the previous year. Meanwhile, Southeast Asian marketscontinued to stagnate.Amid such an operating environment, consolidated net sales decreased 1.0 billion year on year to 336.6 billion, due to decreased sales of motorcycles in Southeast Asian markets and the appreciationof the yen against the U.S. dollar, despite increased sales of off-road models such as four-wheeledvehicles in the North American market.Operating income came to 11.7 billion, improving 13.7 billion year on year, due to reductions infixed costs and promotion expenses.Other OperationsConsolidated net sales decreased 22.0 billion year on year to 80.4 billion.Operating income decreased 0.7 billion year on year to 0.4 billion.In the Group Vision 2030, the Group will focus on three fields; “A Safe and Secure RemotelyConnected Society”, “Near-Future Mobility” and “Energy and Environmental Solutions” and willtransform our business structure into a form which promises faster growth in line with environmentalchanges. The Group is making steady progress in new businesses, such as the development of surgicalsupport robots and automated PCR testing, the development of delivery robots and unmannedtransport helicopters, and the promotion of hydrogen-related projects.(2) Consolidated financial condition10
(i) AssetsCurrent assets were 1,285.4 billion, 26.6 billion increase from the previous fiscal year due to anincrease in inventories.Fixed assets were 677.8 billion, 21.1 billion decrease from the previous fiscal year due to adecrease in depreciation of property, plant and equipment.As a result, total assets were 1,963.2 billion, 5.4 billion increase from the previous fiscal year.(ii) LiabilitiesInterest-bearing debt was 593.3 billion, 25.8 billion increase from the previous fiscal year.Liabilities were 1,480.5 billion, 5.7 billion decrease from the previous fiscal year due to adecrease in notes and accounts payable-trade.(iii) Net assetsConsolidated net assets were 482.7 billion, 11.2 billion increase from the previous fiscal yeardue to an increase in remeasurements of defined benefit plans.(3) Cash flows(i) Cash flows from operating activitiesOperating activities provided net cash of 34.6 billion, 50.0 billion increase from the previousfiscal year, when operating activities used net cash of 15.4 billion. Major sources of operating cashflows included a decrease in notes and accounts receivable-trade of 23.2 billion and Depreciationand amortization of 61.2 billion. Major uses of operating cash flows included expenditure of 26.3billion due to an increase in inventory assets, 16.7 billion due to a decrease in notes and accountspayable-trade.(ii) Cash flows from investing activitiesInvesting activities used net cash of 37.3 billion which is 32.0 billion less than in the previousfiscal year, mainly due to purchase of property, plant and equipment, as well as intangible assets.(iii) Cash flows from financing activitiesFinancing activities provided net cash of 23.0 billion, which is 92.7 billion less than in theprevious fiscal year. This was mainly due to proceeds from issuance of bonds.(4) Consolidated earnings outlookWith respect to the earnings forecasts for the fiscal year ending March 31, 2022, the Company isexpecting consolidated net sales of 1,500.0 billion, a 11.6 billion year on year increase, due to11
expected increases in the Rolling Stock segment, the Motorcycle & Engine segment and othersegments, despite expected decrease in the Aerospace systems segment by applying “AccountingStandard for Revenue Recognition” (ASBJ Statement No. 29 of March 31, 2020).In terms of profit, the Company is forecasting consolidated operating income of 30.0 billion,recurring profit of 20.0 billion, and net income attributable to owners of parent of 17.0 billion.Furthermore, the Company is expecting ROIC of 2.5% and ROE of 3.9%. These forecasts are basedon the expectation for an improvement of profitability of component parts of commercial aircraft jetengines with the recovery of commercial aircraft operating hours in the Aerospace Systems segmentand for an increase in profits in conjunction with a rise in sales of the Motorcycle and Engine segmentand other factors.Consolidated orders received are expected to increase 77.6 billion year on year to 1,480.0 billion.Assumed exchange rates of 106/US and 128/Euro are used for the above consolidated earningsoutlook.Note regarding consolidated earnings outlookThe above earnings outlook is based on information available at the time of preparation, and includesrisks and uncertainties. We therefore discourage making investment decisions depending solely on thisoutlook. Please note that actual earnings may differ materially from this outlook, due to a variety ofimportant factors stemming from changes the external environment and/or the Company’s internalenvironment. Important factors that impact actual operating performance include, but are not limitedto, the economic situation surrounding the Company’s scope of business, foreign exchange rates, inparticular the yen/dollar exchange rate, tax codes and other regulatory system-related issues.2. Basic rationale for selecting accounting standardsIn the near term, KHI Group plans to continue to use Japanese accounting standards to discloseconsolidated financial statements. The Group will continue to study the possible adoption of IFRSfrom the standpoint of increasing corporate value over the medium- to long-term horizon as well aspromoting constructive dialogue with investors, all while taking the situation surrounding the Groupboth in Japan and overseas into consideration.12
3. Consolidated Financial Statements(1) Consolidated balance sheetsMillions of yenYears ended March 31AssetsCurrent assetsCash and depositsNotes and accounts receivable—tradeMerchandise and finished goodsWork in processRaw materials and suppliesOtherAllowance for doubtful accountsTotal current assetsNon-current assetsProperty, plant and equipmentBuildings and structures, netMachinery, equipment and vehicles, netLandLeased assets, netConstruction in progressOther, netTotal property, plant and equipmentIntangible assetsInvestments and other assetsInvestment securitiesRetirement benefit assetDeferred tax assetsOtherAllowance for doubtful accountsTotal investments and other assetsTotal non-current assetsTotal 254(1,403)204,180677,8681,963,276
LiabilitiesCurrent liabilitiesNotes and accounts payable-tradeElectronically recorded obligations - operatingShort-term loans payableCurrent portion of bondsLease obligationsIncome taxes payableProvision for sales promotion expensesProvision for bonusesProvision for construction warrantiesProvision for loss on construction contractsAdvances receivedOtherTotal current 442,491538,5561,486,28341,668562,9441,480,500Total shareholders’ 2306,576(136)465,467Accumulated other comprehensive incomeNet unrealized gains (losses) on securitiesDeferred gains (losses) on hedgesForeign currency translation adjustmentsRemeasurements of defined benefit plansTotal accumulated other comprehensive incomeNon-controlling interestsTotal net assetsTotal liabilities and net 1,963,276Non-current liabilitiesBonds payableLong-term loans payableLease obligationsDeferred tax liabilitiesRetirement benefit liabilityProvision for the in-service issues of commercial aircraftjet enginesOtherTotal non-current liabilitiesTotal liabilitiesNet assetsShareholders’ equityCommon stockCapital surplusRetained earningsTreasury stock14
(2) Consolidated statements of income and comprehensive incomeConsolidated statements of incomeMillions of yenYears ended March 31Net salesCost of salesGross profitSelling, general and administrative expensesSalaries and allowancesResearch and development expensesOtherTotal selling, general and administrative expensesOperating income (loss)Non-operating incomeInterest incomeDividend incomeShare of profit of entities accounted for using equity methodForeign exchange gainsReversal of the provision for the in-service issues of commercial aircraftOtherTotal non-operating incomeNon-operating expensesInterest expenseForeign exchange lossesLoss on disposal of property, plant and equipmentPayments for the in-service issues of commercial aircraft jet enginesOtherTotal non-operating expensesRecurring profit (loss)Extraordinary incomeGain on sales of property, plant and equipmentGain on sales of shares of subsidiaries and affiliatesTotal extraordinary incomeExtraordinary lossesLoss on withdrawal from businessImpairment lossLoss on devaluation of stocks of subsidiaries and affiliatesTotal extraordinary lossesIncome before income taxesIncome taxes – currentIncome taxes – deferredTotal income taxesNet income (loss)Net income (loss) attributable to non-controlling interestsNet income (loss) attributable to owners of 6)1,846(19,332)
Consolidated statements of comprehensive incomeMillions of yenYears ended March 312020Net income (loss)Other comprehensive incomeNet unrealized gains (losses) on securitiesDeferred gains (losses) on hedgesForeign currency translation adjustmentRemeasurement of defined benefit plansShare of other comprehensive income of entities accounted forusing equity methodTotal other comprehensive income(loss)Comprehensive Income(loss) attributable to:Owners of parentNon-controlling )(4,116)1,06630,33512,84810,4232,425
(3) Consolidated statements of changes in net assetsMillions of yenYears ended March 312020Shareholders’ equityCommon stockBalance at end of previous year2021104,484Total changes during the periodBalance at end of ital surplusBalance at end of previous yearChanges during the periodLoss on sales of treasury stockTransfer of loss on sales of treasury stockChanges in equity of parent company in transactions with noncontrolling shareholdersTotal changes during the periodBalance at end of yearRetained earningsBalance at end of previous yearCumulative effect of changes in accounting policiesRestated balanceChanges during the 657Cash dividendNet income (loss) attributable to owners of parent(11,693)18,662Transfer of loss on sales of treasury stockOtherTotal changes during the periodBalance at end of yearTreasury stockBalance at end of previous yearChanges during the periodTreasury stock purchased, netLoss on sales of treasury stockTotal changes during the periodBalance at end of yearTotal shareholders’ equityBalance at end of previous 3)(3)0(3)0(3)(3)(133)(136)483,502485,520Cumulative effect of changes in accounting policiesRestated balance(4,948)478,554Changes during the periodCash dividend(11,693)Net income (loss) attributable to owners of parentTreasury stock purchased, net(19,332)18,662(3)(19,332)(3)Loss on sales of treasury stockTransfer of loss on disposal of treasury stock0-0-Changes in equity of pare
1 Report of Earnings and Financial Statements for the Fiscal Year Ended March 31, 2021 (Consolidated) (Prepared pursuant to Japanese GAAP) May 11, 2021
