Transcription
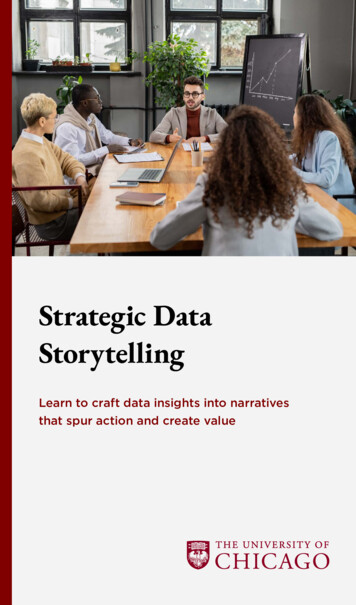
Strategic DataStorytellingLearn to craft data insights into narrativesthat spur action and create value
As the amount of data we are able to collect continues to grow,storytelling and visualization tools are becoming essential forcommunicating any conclusions we may draw from all this information.Strategic Data StorytellingOrganizations across multiple industries carry out data science projectsto solve real-world problems and create value. This program focuses onthe critical final stage: when data scientists and managers working withthem need to create a data story to drive stakeholder action. Crafting amessage to achieve the desired outcome entails understanding principlesaround displaying, visualizing, and telling data stories with a clear senseof one’s audience and goals.Program DetailsTuition: USD 2,500Program Format: Online learning with live, interactive sessionsDuration: Eight weeksLanguage: English and SpanishInstructors: Shree Bharadwaj, MS; and Bridget Sheahan, CFA; StrategicData Storytelling; the University of Chicago
About the ProgramOur eight-week, online Strategic Data Storytelling course will teach youhow to visualize and communicate insights from data science projects. Inaddition to creating the data story, you will also learn to align it to thebusiness goal that needs to be met and the audience to whom thenarrative will be pitched.You will learn to: Translate data into economic value while assessing effective datavisualization strategies that link insights to business objectives Analyze data to determine patterns, key insights, action items, andstorytelling potential Describe the key elements of a successful data story: knowing one’saudience, defining a goal, maintaining engagement, and beingexplicit about the takeaways Identify where and how a data story achieves its intended goals andwhere it can be optimized Use imaging tools to create data visualizations that align with theneeds of the data story
Who Should Attend?This program is designed for professionals who work with data scienceteams and data scientists interested in transitioning into client-facingroles. Although there are no prerequisites for enrollment in the program,it is not an introduction to data science or data analytics. Therefore, atechnical background and being comfortable working with data sets inExcel, Google Data Studio, and Tableau are strongly advised.
Meet Your InstructorsShree Bharadwaj works at West Monroe, a managementconsulting company. As a Center of Excellence lead, he advisesprivate equity and venture capital firms. In his previous executiveleadership role at Syndigo, he led the data strategy, data science,next-gen platform, and M&A integrations. His expertise revolvesaround driving innovation, standardization, development andoperationalization of machine learning models, data engineeringat scale using on-premise and cloud platforms, effective datavisualizations, model-driven design, and algorithmic thinking.Bharadwaj was elected to the Global Standards ArchitectureBoard at GS1, where he worked with global industry leaders todevelop standards, road maps, and governance and compliancerequirements relating to food services, healthcare, retail, supplychain, and CPG/FMCG verticals. His experience spans acrossmultiple industries that include AdTech, EdTech, FinTech,healthcare, MarTech, public safety, retail, and telecom inorganizations that range from startups to Fortune 100 companies.Shree Bharadwaj, MS; Data Engineering andStorytelling with DataBridget Sheahan works as the VP of Analytics and Insights atValassis Communications, a global media and marketing servicescompany. Her role entails leading the analytics services, datainnovation, and data science teams. Prior to this role at Valassis,Sheahan held a number of analytics-related positions, includingserving as executive director of Client Analytics, and beforejoining Valassis she was the director of Pricing and MarketingAnalytics at the Learning Care Group.Bridget Sheahan, CFA; Strategic DataStorytelling , The University of Chicago
Why the University of Chicago?Becoming a member of the University of Chicago community meansgaining access to world-class instructors and a cohort of curious, diverseindividuals.Through a firm grounding in core principles and a rigorous approach toproblem-solving, our teaching method—the Chicago Approach—willgive you the tools you need to make sense of complex data and turnideas into impact. Program participants will receive a certificate ofcompletion and join a global network of thought leaders.Approach to Online LearningOur online learning programs are crafted to support your specificprofessional development goals. Programs combine e-learning withlive, interactive sessions to strengthen your skill set while maximizingyour time. We couple academic theory and business knowledge withpractical, real-world application.Through online learning sessions, you will have the opportunity tointeract with the University of Chicago instructors and peers.
Career OutlookThe global big data market is expected to grow to 229.4 billion by2025. , and an increasing number of organizations are in need ofstorytelling techniques—and data storytelling professionals—tocommunicate and visualize their data effectively. Non-profits andFortune 500 companies alike find this approach raises awareness ofa brand, issue, product, or trend and inspires a target audience totake action. Possessing both analytical skills and the ability to weavedata into compelling narratives, data storytellers and visualizationspecialists are prized by enterprises that want to maximize theirdata’s value. 61k22x 229.4BThe average salaryfor an insight analystin the United StatesHow much more likelywe are to remember afact when wrappedin a storyExpected big datamarket revenueby 2025Potential Data Storytelling Job Titles Analytics Specialist Database Administrator Business Analyst Digital Analytics Insights Specialist Data Analyst Insight Analyst Data Architect Insight Specialist Data Engineer Machine Learning Engineer Data Modeler Software Engineer Data Storyteller Statistician Data Visualizer
Weekly ScheduleThe Storytelling with Data program covers the following topics:Module 1: Introduction—Foundations of Data Storytellingand Visualization Understanding the current data visualization landscape Learning the key elements of a data story Data privacy The Tableau and Alteryx platforms Visualization tools Trends in data visualizationModule 2: Crafting a Data Point of View Defining the business case Understanding the data required to build the business caseModule 3: Data Discovery Exploratory data analysis The hidden thinking Analysis vs. visualization Working with incomplete data Data quality assessment and visualization
Module 4: Creating Information Art Blending logical and persuasive writing Structuring a recommendation tree Motivating by explaining why Being your own skepticModule 5: Visualizing Proportion, Space, and Time Visualizing time series data Visualizing proportions Mapping capabilities Custom mappingModule 6: Dashboards and Stories Using color and size in visualization Visualizing networks and trees Creating dashboards and stories for insights Charting color for optimal legibility
Module 7: Data Storytelling Principles of strategic decision-making and visualization Introduction to visual analytics and best practices for formattingvisualizations Identifying fundamental KPIs and metrics to driveeffective storytellingModule 8: Influencing Business Decisions withData Storytelling Connecting key learnings for practical application Evaluating team presentations based on class learningsProgram outline may be subject to change based on academic adjustments.Learn moreTo schedule an appointment with admissions, contactadmissions@online.professional.uchicago.edu oralternatively you can let us know when we can call you here.Visit online.professional.uchicago.edu to learn more.
The global big data market is expected to grow to 229.4 billion by 2025. , and an increasing number of organizations are in need of storytelling techniques—and data storytelling professionals—to communicate and visualize their data effectively. Non-profits and Fortune 500 companies alike find this approach raises awareness of