Transcription
DWLBC REPORTNorthern Adelaide PlainsGroundwater MonitoringNetwork Upgrade2001/2002 Drilling Activity2004/57
Northern Adelaide PlainsGroundwater Monitoring NetworkUpgrade2001/02 Drilling ActivityHajrudin Zulfic and Michael StadterKnowledge and Information DivisionDepartment of Water, Land and Biodiversity ConservationApril 2006Report DWLBC 2004/57
Knowledge and Information DivisionDepartment of Water, Land and Biodiversity Conservation25 Grenfell Street, AdelaideGPO Box 2834, Adelaide SA 5001Telephone te(08) 8463 6946 61 8 8463 6946(08) 8463 6999 61 8 8463 6999www.dwlbc.sa.gov.auDisclaimerDepartment of Water, Land and Biodiversity Conservation and its employees do not warrant or makeany representation regarding the use, or results of the use, of the information contained herein asregards to its correctness, accuracy, reliability, currency or otherwise. The Department of Water, Landand Biodiversity Conservation and its employees expressly disclaims all liability or responsibility to anyperson using the information or advice. Government of South Australia, through the Department of Water, Land and BiodiversityConservation 2006This work is Copyright. Apart from any use permitted under the Copyright Act 1968 (Cwlth), no partmay be reproduced by any process without prior written permission obtained from the Department ofWater, Land and Biodiversity Conservation. Requests and enquiries concerning reproduction andrights should be directed to the Chief Executive, Department of Water, Land and BiodiversityConservation, GPO Box 2834, Adelaide SA 5001.ISBN 1 921218 03 7Preferred way to cite this publicationZulfic, H & Stadter, M 2004, Northern Adelaide Plains Groundwater Monitoring Network Upgrade,DWLBC Report 2004/57, Department of Water, Land and Biodiversity Conservation, Adelaide.
FOREWORDSouth Australia’s unique and precious natural resources are fundamental to the economicand social wellbeing of the State. It is critical that these resources are managed in asustainable manner to safeguard them both for current users and for future generations.The Department of Water, Land and Biodiversity Conservation (DWLBC) strives to ensurethat our natural resources are managed so that they are available for all users, including theenvironment.In order for us to best manage these natural resources it is imperative that we have a soundknowledge of their condition and how they are likely to respond to management changes.DWLBC scientific and technical staff continues to improve this knowledge throughundertaking investigations, technical reviews and resource modelling.Rob FreemanCHIEF EXECUTIVEDEPARTMENT OF WATER, LAND AND BIODIVERSITY CONSERVATIONReport DWLBC 2004/57Northern Adelaide Plains Groundwater Monitoring Network Upgradei
CONTENTSFOREWORD . i1.INTRODUCTION . 12.RESULTS OF DRILLING. 22.12.22.32.42.52.62.72.82.92.102.113.RESULTS OF WELL BACKFILLING . 133.13.24.SITE NUMBER 1: PTA 115 . 2SITE NUMBER 2: MPA 154 . 2SITE NUMBER 3: MPA 155 . 8SITE NUMBER 4: PTG 83. 9SITE NUMBER 5: PTG 84. 9SITE NUMBER 6: MPA 156 . 9SITE NUMBER 7: MPA 157 . 10SITE NUMBER 8: MPA 158 . 10SITE NUMBER 9: PTA 116 . 11SITE NUMBER 10 – REPLACEMENT WELL: MPA 153. 11SITE NUMBER 11 – REPLACEMENT WELL: MPA 159. 12MONITORING WELL: MPA 75. 13MONITORING WELL: MPA 64. 13CONCLUSIONS . 14APPENDICES . 15A. LITHOLOGICAL LOGS . 15B. COMPOSITE WELL LOGS . 64C. GROUNDWATER SAMPLE SALINITY RESULTS . 76UNITS OF MEASUREMENT . 93GLOSSARY . 94LIST OF FIGURESFigure 1.NAP Monitoring Network - T2 Aquifer Well Location Map . 3LIST OF TABLESTable 1.Table 2.Table 3.Table 4.Summary of encountered lithology . 4Summary of encountered lithology – continued. 5Well completion details . 6Well completion details – continued . 7Report DWLBC 2004/57Northern Adelaide Plains Groundwater Monitoring Network Upgradeii
1. INTRODUCTIONBetween September 2001 and February 2002 an upgrade of the Northern Adelaide Plains(NAP) monitoring network was undertaken. In total, eleven new wells were drilled in AngleVale and Virginia areas. Two old government owned steel cased, non-pressure cementedmonitoring wells (MPA 64 and MPA 75) were backfilled and replaced with new wells. Alleleven monitoring wells were completed in the T2 Aquifer.The review of the Northern Adelaide Plains (NAP) groundwater monitoring networkconducted in 1999, recommended upgrading of the network. New and replacement wellswere recommended to be drilled into the T1 and T2 confined aquifers, as well as to backfilland rehabilitate some old monitoring wells.While the 2000/01 Drilling Program has prioritised and undertaken an upgrade of mainly theT1 Aquifer monitoring network in the Waterloo Corner area because of the lack of data andhigh consumption of groundwater from the T1 Aquifer in this area, the 2001/02 DrillingProgram has undertaken upgrading of the T2 Aquifer monitoring network in the Angle Valeand Virginia areas.Eleven wells were drilled and two wells were backfilled between September 2001 andFebruary 2002. All monitoring wells were drilled and completed in the T2 confined aquifer.Two government non-pressure cemented monitoring wells (MPA 64 and MPA 75) werebackfilled and replaced by new wells under the same program.Report DWLBC 2004/57Northern Adelaide Plains Groundwater Monitoring Network Upgrade1
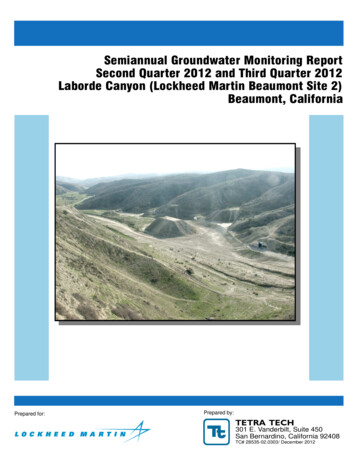
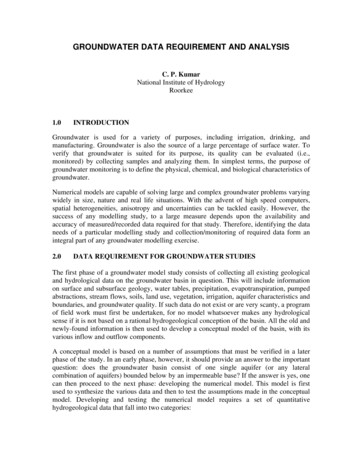
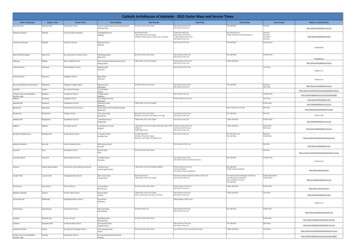
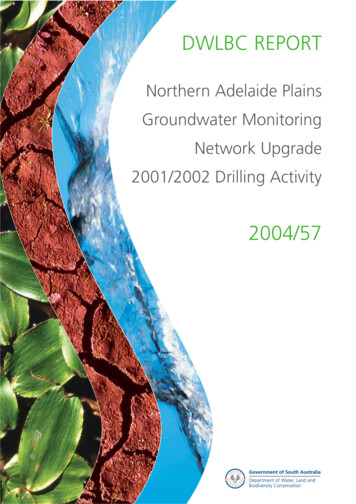
2. RESULTS OF DRILLINGThe objective of the drilling of eleven monitoring wells (MPA 153 to MPA 159; PTA 115 andPTA 116; PTG 83 and PTG 84) and backfilling of two government non-pressure cementedmonitoring wells MPA 64 and MPA 75 (Fig. 1) was to upgrade the monitoring of the T2aquifer in the Angle Vale and Virginia areas. A summary of encountered lithology and wellcompletion details are provided in Tables 1–4, with comprehensive description of lithologyencountered over the well profiles included in Appendix A of this report.A suite of geophysical logs was conducted over each hole prior to casing: gamma, neutron,point resistivity, caliper, spontaneous potential, density, medium inductivity and deepinductivity. Composite well logs identifying age, formation, completion and lithological profiledata are included in Appendix B.Following completion all wells were developed by airlifting, during which time water sampleswere collected for salinity analysis at Glenside laboratory. Salinity results are presented inAppendix C. All wells were completed for long term observation with a 0.5 m high lockablestandpipe cemented over each well.2.1 SITE NUMBER 1: PTA 115The monitoring well PTA 115 (unit number 6628 – 20666) was drilled under P/N 56428.The well was drilled adjacent to the section 171, hundred of Port Adelaide, on the westernside of Buckland Road, 250 m north of Park Road. The well was drilled to a total depth of87.5 m using rotary mud drilling. Sample cuttings were collected at three metre intervals overthe entire penetrated depth.Completion of the well was carried out using 142 mm ID class 12 PVC casing from 0.3 mabove ground level to 65 m, which was pressure cemented to the surface, with cement 2 mbelow the casing (67 m), whilst the remaining section of the well (67–87.5 m encompassingthe Lower Port Willunga Formation) was left as open hole completion.The well was developed by airlifting from 50 m at a rate of 4–5 L/s for 2 hours, during whichtime two groundwater samples were obtained from the open hole section in the aquifer forsalinity analysis. The electrical conductivity of 1230 uS/cm inferred a total dissolved solids(TDS) content of 677 mg/L, the expected salinity of the T2 aquifer groundwater for this area.2.2 SITE NUMBER 2: MPA 154The monitoring well MPA 154 (unit number 6628 – 20729) was drilled under P/N 56853.The well was drilled adjacent to the section 3879, hundred of Munno Para, approximately20 m southwest of Angle Vale Road on the southeastern side of Frisby Road. The well wasdrilled to a total depth of 105.2 m using rotary mud drilling. Sample cuttings were collected atthree metre intervals over the entire penetrated depth.Report DWLBC 2004/57Northern Adelaide Plains Groundwater Monitoring Network Upgrade2
02.55km250000Backfilled WellsExisting WellsNew Wells260000MIDDLE BEACHEASTWEST -PTG 43PTG 77LTMILNERPTG 60FAU270000OUTER HARBOURPTA 40PTA 41PTA 46PTA 57PTG 31PTA 83PTA 115MPA 144PTA 67ST KILDAPTA 94PTA 116280000WATERLOOCORNERMPA 111MPA 75MPA 137YAT 10YAT 129MPA 155SALISBURYPARA HILLSYAT 9MPA 50ELIZABETHMPA 48MPA 110ROSEWORTHYMPA 140290000MUW 12MPA 156MPA 148MPA 139MPA 83MPA 154MPA 81MPA 136MUW 25MUW 28WARD BELTMUW 30KANGAROO FLATMUW 32MUW 27MUW 31ROSEWORTHY COLLEGEMUW 29MPA 153PTG 79MPA 157MPA 158MPA 159MPA 64VIRGINIAPTG 53PTG 78PTG 84280000MPA 109PTG 83PTG 62PTA 87PTA 91PTA 82PTG 66TWO WELLSFAULTKREDBA N270000290000TEA TREE GULLYTDatum: GDA94Map projection: MGA Zone 541.25MPA 75MPA 109MPA 153Observation wells and numberLimit of Munno Para ClayBasement outcropKangaroo Flat Restricted AreaNorthern Adelaide Plains Prescribed Wells Areacurrent at March 2002T2 Aquifer Well Location MapFigure 1NORTHERN ADELAIDE PLAINSGROUNDWATER MONITORING 50000T6150000NDULP:\Projects GW\State\GW Monitoring Well Upgrade\Figure1 HajruddinKL AFAPABUCFAULTUL6150000AALMFA
60.8–87.5 26.7 80.8–105.2 74.8–80.8Report DWLBC 2004/57Northern Adelaide Plains Groundwater Monitoring Network UpgradeLower Port WillungaFormation (T2)7.824.4 6.082.6–100 77–82.653–60.83.840.8–64Munno Para r Port WillungaFormation (T1b)33–46Carisbrooke Sand (Q4)31.50–3Interval(m)17.4 5.67.06.023.237.83.0Thickness(m)Site number 3MPA 15564–701.5–33Hindmarsh Clay1.5Thickness(m)Site number 2MPA 154Hallett Cove SandstoneDry Creek Sand (T1a)0–1.5Interval(m)Site number 1PTA 115Summary of encountered lithologyRecentTable 1.RESULTS OF DRILLING52.4–76 rval(m)23.6 8.03.61621.83.0Thickness(m)Site number 4PTG 8335–70 33.6–3528–33.63–280–3Interval(m)35 1.45.625.03.0Thickness(m)Site number 5PTG 8478.4–100 (m)21.6 2.46.810.056.23.04Thickness(m)Site number 6MPA 156
53.2–6464–7575–83.283.2–91.291.2–120 Carisbrooke Sand (Q4)Hallett Cove SandstoneDry Creek Sand (T1a)Upper Port WillungaFormation (T1b)Munno Para ClayLower Port WillungaFormation (T2)28.8 8.08.211.010.849.24.0Thickness(m)64.4–86 val(m)21.6 4.43.01.017.535.53.0Thickness(m)Site number 8MPA 158Report DWLBC 2004/57Northern Adelaide Plains Groundwater Monitoring Network Upgrade4–53.20–4Interval(m)Site number 7MPA 157Summary of encountered lithology – continuedHindmarsh ClayRecentTable 2.RESULTS OF DRILLING74–96 val(m)22.0 8.06.06.814.436.82.0Thickness(m)Site number 9PTA 11668–94 60.8–6838.5–60.81–38.50–1Interval(m)26.0 7.222.337.51.0Thickness(m)Site number 10MPA 15379.6–100 erval(m)20.4 8.65.48.09.645.03.0Thickness(m)Site number 11MPA 1595
61614867.73887.587.5Northing (GDA 94)Reference ElevationTotal depth drilled (m)Depth completed (m)186774-5Water level (m)Salinity (mg/L)Yield (L/s)‡665526.32T2Open 285823568536628-20729MPA 154Site number 2Report DWLBC 2004/57Northern Adelaide Plains Groundwater Monitoring Network Upgrade‡ Yields determined from airlifting† Pressure cement below casing* 0.2 m above ground levelT2Open holeProduction zone typeAquifer completed67-87.50-67Production zone (m)Pressure cemented (m)-0.3*-67273663Easting (GDA 94)Casing (m)564286628-20666Well permit numberWell unit numberPTA 115Site number 1Well completion detailsObservation well numberTable 3.RESULTS OF DRILLING4-5144034.45T2Open 516628-20730MPA 155Site number 3482132.91T2Open 628-20731PTG 83Site number 44-5101013.32T2Open 628-20732PTG 84Site number 5555630.45T2Open 486628-20733MPA 156Site number 66
615881616.505120120Northing (GDA 94)Reference ElevationTotal depth drilled (m)Depth completed (m)2-356748.88T2Open 628-20735MPA 158Site number 8Report DWLBC 2004/57Northern Adelaide Plains Groundwater Monitoring Network Upgrade‡ Yields determined from airlifting† Pressure cement below casing* 0.2 m above ground level51726Salinity (mg/L)Yield (L/s)‡29.39Water level (m)T2Open holeProduction zone typeAquifer completed96-1200-96Production zone (m)Pressure cemented (m)-0.3*-96280472Easting (GDA 94)Casing (m)574526628-20734Well permit numberWell unit numberMPA 157Site number 7Well completion details – continuedObservation well numberTable 4.RESULTS OF DRILLING476129.507T2Open 56628-20759PTA 116Site number 94126127.2T2Open 628-20678MPA 153Site number 10495541.24T2Open 496628-20736MPA 159Site number 117
RESULTS OF DRILLINGCompletion of the well was carried out using 142 mm ID class 12 PVC casing from 0.3 mabove ground level to 84 m, which was pressure cemented to the surface, with cement 2 mbelow the casing (86 m), whilst the remaining section of the well (86–105.2 m encompassingthe Lower Port Willunga Formation) was left as open hole completion.The well was developed by airlifting from 60 m, at a rate of approximately 6 L/s for 4 hoursduring which time the well produced a significant amount of fine sand. During airlifting thesand content was decreasing and at the end of 4 hours of airlifting was around 5–10%.Further development was suggested.The well was further developed on the 15th and 16th of May 2002 using a Legra pump set at80 m.Development began at a flowing rate of 2 L/s for a period of 90 minutes. The first fewsamples contained approximately 1/3–1/2 of a cup of fine sand per 1.25 litre of water sample,which slowly waned to about 1 teaspoon of sand per 1.25 litre water sample for the last 30mins of the test (less than 1%). Then the flow rate was increased to 5 L/s, which broughtabout an increase in the sand content of approximately 1/4–1/3 of the cup of fine sand per1.25 litre of water sample ( 6%), which stayed constant for the duration of the development,being a total of 120 minutes. On 16/5/02; development continued at a flowing rate of 5 L/s fora total of 360 minutes with no sign of the sand content decreasing. No further developmentwas conducted at this stage.Three groundwater samples during initial development and another 34 during furtherdevelopment were collected for salinity analysis. The electrical conductivity of 1190 uS/cminferred a total dissolved solids (TDS) content of 655 mg/L, the expected salinity of the T2aquifer groundwater for this area.2.3 SITE NUMBER 3: MPA 155The monitoring well MPA 155 (unit number 6628 – 20730) was drilled under P/N 56851.The well was drilled adjacent to the section 3900, hundred of Munno Para, on thesoutheastern side of Short Road, 150 m southwest of Robert Road. The well was drilled to atotal depth of 100 m using rotary mud drilling. Sample cuttings were collected at three metreintervals over the entire penetrated depth.Completion of the well was carried out using 142 mm ID class 12 PVC casing from 0.2 mabove ground level to 86 m, which was pressure cemented to the surface, whilst theremaining section of the well (86–100 m encompassing the Lower Port Willunga Formation)was left as open hole completion.The well was developed by airlifting from 50 m, at a rate of 4–5 L/s for 3 hours during whichtime two groundwater samples were obtained from the open hole section in the aquifer forsalinity analysis. The electrical conductivity of 2600 uS/cm inferred a total dissolved solids(TDS) content of 1440 mg/L, the expected salinity of the T2 aquifer groundwater for this area.Report DWLBC 2004/57Northern Adelaide Plains Groundwater Monitoring Network Upgrade8
RESULTS OF DRILLING2.4 SITE NUMBER 4: PTG 83The monitoring well PTG 83 (unit number 6628 – 20731) was drilled under P/N 5682.The well was drilled adjacent to the section 99, hundred of Port Gawler, on the northern sideof Johns Rd, 350 m east of Baker Road. The well was drilled to a total depth of 76 m usingrotary mud drilling. Sample cuttings were collected at three metre intervals over the entirepenetrated depth.Completion of the well was carried out using 142 mm ID class 12 PVC casing from 0.3 mabove ground level to 56 m, which was pressure cemented to the surface, whilst theremaining section of the well (56–76 m encompassing the Lower Port Willunga Formation)was left as open hole completion.The well was developed by airlifting from 50 m, at a rate of 4 L/s for 3 hours, during whichtime two groundwater samples were obtained from the open hole section in the aquifer forsalinity analysis. The electrical conductivity of 1490 uS/cm inferred a total dissolved solids(TDS) content of 821 mg/L, the expected salinity of the T2 aquifer groundwater for this area.2.5 SITE NUMBER 5: PTG 84The monitoring well PTG 84 (unit number 6628 – 20732), was drilled under P/N 56847.The well was drilled adjacent to the section 174, hundred of Port Gawler, on the western sideof Pederick Road, 30 m north of Hayman Road.The well was drilled to a depth of 51 m and the total loss of circulation occurred between45–51 m. The well was cased using 142 mm ID class 12 PVC casing from 0.2 m aboveground level to 49.8 m and pressure cemented to the surface and than drilled to total depthof 70 m using rotary mud drilling. Sample cuttings were collected at three metre intervalsover the entire penetrated depth.The section of the well 49.8–70 m, encompassing the Lower Port Willunga Formation, wasleft as open hole completion.The well was developed by airlifting from 37 m, at a rate of 4 L/s for 1.5 hours, during whichtime three groundwater samples were obtained from the open hole section in the aquifer forsalinity analysis. The electrical conductivity of 1830 uS/cm inferred a total dissolved solids(TDS) content of 1010 mg/L, the expected salinity of the T2 aquifer groundwater for this area.2.6 SITE NUMBER 6: MPA 156The monitoring well MPA 156 (unit number 6628 – 20733), was drilled under P/N 56848.The well was drilled adjacent to the section 3296, hundred of Munno Para, approximately250 m northwest of Stebonheath Road on the southwestern side of Dalkeith Road. The wellwas drilled to a total depth of 100 m using rotary mud drilling. Sample cuttings were collectedat three metre intervals over the entire penetrated depth.Report DWLBC 2004/57Northern Adelaide Plains Groundwater Monitoring Network Upgrade9
RESULTS OF DRILLINGCompletion of the well was carried out using 142 mm ID class 12 PVC casing from 0.1 mabove ground level to 84 m, which was pressure cemented to the surface, whilst theremaining section of the well (84–100 m encompassing the Lower Port Willunga Formation)was left as open hole completion.The well was developed by airlifting from 60 m, at a rate of approximately 5 L/s for 2 hours,during which time the well produced significant amount of fine sand. During airlifting sandcontent was decreasing and at the end of 2 hours airlifting was around 5%.The well was further developed on 21 of May 2002 using a Legra pump set at 80 m.Development began at a flow rate of 2 L/s for a period of 125 minutes with initial groundwatersamples containing approximately 1/4 of a cup of sand per 1.25 litre of groundwater sample( 5%). Groundwater began to clear at about the 90 minutes mark, clearing up to 1 teaspoonper 1.25 litre of groundwater sample within the next 45 minutes. The increase of the flow rateup to 5 L/s brought on the sand at about the same ratio per sample as the first stage ( 5%).At 240 minutes the sand content was decreasing and continued to do so up until the end ofthe stage, at 330 minutes, whereupon the sand content was down to about 1 teaspoon per1.25 litre of groundwater sample. No further development was required at this stage.Two groundwater samples during initial development, on the well completion, and anothertwenty one during further development were collected for salinity analysis. The electricalconductivity of 1010 uS/cm inferred a total dissolved solids (TDS) content of 556 mg/L, theexpected salinity of the T2 aquifer groundwater for this area.2.7 SITE NUMBER 7: MPA 157The monitoring well MPA 157 (unit number 6628 – 20734), was drilled under P/N 57452.The well was drilled adjacent to the section 3055, hundred of Munno Para, approximately250 m southwest of Penfield Road on the northwestern side of Short Road. The well wasdrilled to a total depth of 120 m using rotary mud drilling. Sample cuttings were collected atthree metre intervals over the entire penetrated depth.Completion of the well was carried out using 142 mm ID class 12 PVC casing from 0.3 mabove ground level to 96 m, which was pressure cemented to the surface, whilst theremaining section of the well (96–120 m encompassing the Lower Port Willunga Formation)was left as open hole completion.The well was developed by airlifting from 79 m, at a rate of 5 L/s for about 1 hour, duringwhich time three groundwater samples were obtained from the open hole section in theaquifer for salinity analysis. The electrical conductivity of 3110 uS/cm inferred a totaldissolved solids (TDS) content of 1726 mg/L, the expected salinity of the T2 aquifergroundwater for this area.2.8 SITE NUMBER 8: MPA 158The monitoring well MPA 158 (unit number 6628 – 20735), was drilled under P/N 57535.The well was drilled adjacent to the section 3027, hundred of Munno Para, approximately150 m southeast of Angle Vale Road on the southwestern side of Davoren Road. The wellReport DWLBC 2004/57Northern Adelaide Plains Groundwater Monitoring Network Upgrade10
RESULTS OF DRILLINGwas drilled to a total depth of 86 m using rotary mud drilling. Sample cuttings were collectedat three metre intervals over the entire penetrated depth.Completion of the well was carried out using 142 mm ID class 12 PVC casing from 0.3 mabove ground level to 68 m, which was pressure cemented to the surface, whilst theremaining section of the well (68–86 m encompassing the Lower Port Willunga Formation)was left as open hole completion.The well was developed by airlifting from 50 m, at a rate of 2–3 L/s for 2 hours, during whichtime two groundwater samples were obtained from the open hole section in the aquifer forsalinity analysis. The electrical conductivity of 1030 uS/cm inferred a total dissolved solids(TDS) content of 567 mg/L, the expected salinity of the T2 aquifer groundwater for this area.2.9 SITE NUMBER 9: PTA 116The monitoring well PTA 116 (unit number 6628 – 20759) was drilled under P/N 57655.The well was drilled adjacent to the section 226 PT 95, hundred of Port Adelaide,approximately 50 m north of McEvoy Road on the eastern side of Supple Road. The well wasdrilled to a total depth of 96 m using rotary mud drilling. Sample cuttings were collected atthree metre intervals over the entire penetrated depth.Completion of the well was carried out using 142 mm ID class 12 PVC casing from 0.3 mabove ground level to 78 m, which was pressure cemented to the surface, with cement 1 mbelow the casing (79 m), whilst the remaining section of the well (79–96 m encompassing theLower Port Willunga Formation) was left as open hole completion.The well was developed by airlifting from 54 m, at a rate of 4 L/s for 1.5 hours, during whichtime three groundwater samples were obtained from the open hole section in the aquifer forsalinity analysis. The electrical conductivity of 1380 uS/cm inferred a total dissolved solids(TDS) content of 761 mg/L, the expected salinity of the T2 aquifer groundwater for this area.2.10 SITE NUMBER 10 – REPLACEMENT WELL: MPA 153The monitoring well MPA 153 (unit number 6628 – 20678), was drilled under P/N 56430 toreplace government non-pressure cemented monitoring well MPA 75, which was backfilledunder P/N 56429.This replacement monitoring well was drilled adjacent to the section 3889, hundred of MunnoPara, approximately 20 m northeast of Curtis Road (3 m north of backfilled well MPA 75).The well was drilled to a total depth of 94 m using rotary mud drilling. Sample cuttings werecollected at three metre intervals over the entire penetrated depth.Completion of the well was carried out using 142 mm ID class 12 PVC casing from 0.2 mabove ground level to 74 m, which was pressure cemented to the surface, whilst theremaining section of the well (74–94 m encompassing the Lower Port Willunga Formation)was left as open hole completion.The well was developed by airlifting from 52 m, at a rate of 3–4 L/s for 3 hours, during whichtime three groundwater samples were collected for salinity analysis. The electricalconductivity of 2280 uS/cm inferred a total dissolved solids (TDS) content of 1261 mg/L, theexpected salinity of the T2 aquifer groundwater for this area.Report DWLBC 2004/57Northern Adelaide Plains Groundwater Monitoring Network Upgrade11
RESULTS OF DRILLING2.11 SITE NUMBER 11 – REPLACEMENT WELL: MPA 159The monitoring well MPA 159 (unit number 6628 – 20736), was drilled under P/N 56849 toreplace a government non-pressure cemented monitoring well MPA 64, which was backfilledunder P/N 56850.This replacement monitoring well was drilled adjacent to the section 3052, hundred of MunnoPara, approximately 50 m southwest of Penfield Road on the southeastern side of King Road( 80 m south of backfilled well MPA 64). The well was drilled to a total depth of 100 m usingrotary mud drilling. Sample cuttings were collected at three metre intervals over the entirepenetrated depth.Completion of the well was carried out using 142 mm ID class 12 PVC casing from 0.2 mabove ground level to 83 m, which was pressure cemented to the surface, whilst theremaining section of the well (83–100 m encompassing the Lower Port Willunga Formation)was left as open hole completion.The well was developed by airlifting from 60 m, at a rate of 4 L/s for 2 hours, during whichtime three groundwater samples were obtained from the open hole section in the aquifer forsalinity analysis. The electrical conductivity of 1730 uS/cm inferred a total dissolved solids(TDS) content of 955 mg/L, the expected salinity of the T2 aquifer groundwater for this area.Report DWLBC 2004/57Northern Adelaide Plains Groundwater Monitoring Network Upgrade12
3. RESULTS OF WELL BACKFILLINGTwo backfilled wells had steel casing which was corroded (Fig. 1). They could not berehabilitated and their backfilling was necessary because their condition deteriorated andthey became a risk for the aquifers they were monitoring.3.1 MONITORING WELL: MPA 75The monitoring well MPA 75 (unit number 6628 – 2718) was backfilled under P/N 56429 withcement slurry from 112 m to the ground level.3.2 MONITORING WELL: MPA 64The monitoring well MPA 64 (unit number 6628 – 2470) was backfilled under P/N 56850 withcement slurry from 129 m to the ground level.Report DWLBC 2004/57Northern Adelaide Plains Groundwater Monitoring Network Upgrade13
4. CONCLUSIONSThe Northern Adelaide Plains T2 Aquifer monitoring network was upgraded by eleven newmonitoring wells, nine of which were constructed in new locations, whilst two wereconstructed on the existing monitoring sites, as replacement monitoring wells.All wells were constructed according to specifications and following
Fax National (08) 8463 6999 International 61 8 8463 6999 Website www.dwlbc.sa.gov.au Disclaimer . Figure 1 NORTHERN ADELAIDE PLAINS GROUNDWATER MONITORING NETWORK T2 Aquifer Well Location Map current at March 2002 02.5 5 1.25 km Datum: GDA94 Map projection: MGA Zone 54.