Transcription
July 27, 2021GE 2021 second quarter performanceFinancial results & company highlightsCAUTION CONCERNING FORWARD-LOOKING STATEMENTS:This document contains "forward-looking statements" – that is, statements related to future events that by their nature address matters that are, to different degrees, uncertain. For details on the uncertainties that may cause our actual futureresults to be materially different than those expressed in our forward-looking statements, see rward-looking-statement-information as well as our annual reports on Form 10-K and quarterlyreports on Form 10-Q. We do not undertake to update our forward-looking statements. This document also includes certain forward-looking projected financial information that is based on current estimates and forecasts. Actual results coulddiffer materially.NON-GAAP FINANCIAL MEASURES:In this document, we sometimes use information derived from consolidated financial data but not presented in our financial statements prepared in accordance with U.S. generally accepted accounting principles (GAAP). Certain of these dataare considered “non-GAAP financial measures” under the U.S. Securities and Exchange Commission rules. These non-GAAP financial measures supplement our GAAP disclosures and should not be considered an alternative to the GAAPmeasure. The reasons we use these non-GAAP financial measures and the reconciliations to their most directly comparable GAAP financial measures are included in our quarterly report on Form 10-Q, our earnings release and the appendix ofthis presentation, as applicable.Amounts shown on subsequent pages may not add due to rounding.Our financial services business is operated by GE Capital Global Holdings, LLC (GECGH). In this document, we refer to GECGH and our financial services business as “GE Capital”. We refer to the industrial businesses of the Company asGE Industrial.GE’s Investor Relations website at www.ge.com/investor and our corporate blog at www.gereports.com, as well as GE’s Facebook page and Twitter accounts, contain a significant amount of information about GE, including financial and otherinformation for investors. GE encourages investors to visit these websites from time to time, as information is updated and new information is posted.
2Q 2021 snapshotResultsDynamicsGE Industrialorganic revenue growth*7%Adjusted GE Industrialorganic margin expansion*1,000 bpsAdjusted EPS*GE Industrialfree cash flow* Orders & revenue returning to growth . strength in Healthcare& services overall with Aviation showing early signs ofrecovery Adjusted GE Industrial margins* of 5.3% . y/y expansion in allsegments; sequential expansion in all segments, ex Aviation Adjusted EPS* up 0.19 y/y . all segments contributing GE Industrial FCF* up 2.0B y/y ex discontinued factoringprograms-a) driven by better earnings & working capital Increasing GE Industrial FCF* outlook to 3.5B - 5.0B org. revenue growth, margin expansion & adj. EPS unchanged 0.05 0.4BStrong overall performance . raising total year GE Industrial FCF* outlook* Non-GAAP Financial Measure(a- Excludes CFOA impact from factoring programs discontinued as of April 1, 2021 of (2.7)B in 2Q'21 and (0.5)B in 2Q'202
A more focused, simpler, stronger high-tech industrialTransforming GE Focusing on industrial core . GECAS importantcatalyst; U.S. DOJ review concluded, EU clearedtransaction, closing expected by year-end '21 Solidifying financial position . post GECAS close,gross debt reduction 70B since end '18; 53B to date Accelerating lean & decentralization . team drivingsafety, quality, delivery & cost improvements; scalingcompany-wide culture change Shifting more toward offense . organic growth throughcommercial wins & services, new product introductions,future technology innovationBusiness highlightsAviation’s CFM to power IndiGo’s 310new aircraft with 620 LEAP-1A engines& a multi-year service agreementHealthcare acquired Zionexa to enablemore targeted treatment for metastaticbreast cancer patientsRenewable Energy finalized contractsfor Dogger Bank C offshore wind farm,supplying 87 Haliade-X turbinesPower’s gas turbine technology tosupport Australia’s first dual-fuel capablenatural gas & hydrogen power plantTransformation fortifying GE’s competitive position3
Earnings performance( in billions – except EPS)2Q'21y/yy/y (org.)YTDOrders 18.333%30% 35.3Revenues18.39%2Q'21 EPS walkGAAP Continuing EPS35.4Less: MTM & Gains- GE IndustrialAdjusted GE Industrial17.5profit*-a)9%(0.07)7%*0.0833.8Less: Restructuring & other-b)(0.02)Less: Non-op. pension & other benefits(0.05)0.9FF1.8Adjusted GE Industrial profit margin*-a)5.3%940bps1,000bps5.2%GAAP Continuing EPS(0.07)53%(0.07)Less: Debt extinguishment costs(0.13)Adjusted EPS*0.05F0.08Adjusted EPS* 0.05Improving earnings majority of y/y improvement driven by Industrial* Non-GAAP Financial Measure(a – Excludes interest & other financial charges, debt extinguishment costs, non-operating benefit costs, gains (losses), restructuring & other charges(b – Includes significant, higher-cost programs that are recorded within Corporate Items and Eliminations and GE Capital tax reform adjustment4
Industrial free cash flow( in billions)2Q'21y/yYTDNet earnings (loss)-a)0.00.90.2Depreciation & amortization0.80.01.5Goodwill impairments—(0.9)—Operating working capital0.21.4(0.7)0.80.91.5(0.6)(0.9)(1.3) Receivables: source improved DSO sequentially & y/y0.52.40.1 (0.9)(0.9)(1.3)Inventory: use build for sequential 2H growth, managingfulfillment & execution challenges0.3(0.2)0.3 Other CFOA-c)(0.3)0.9(0.9)Accounts payable: source recovery in Aviationpurchasing volume compared to prior yearGross CAPEX-d)(0.3)0.2(0.6) GE Industrial FCF*0.42.5(0.5)Progress: use Onshore Wind deliveries & y/y timing ofAviation Military advanceGE Industrial FCF excluding cash flow fromdiscontinued factoring programs* -e)0.42.00.3 Contract assets: source Aviation partially offset by PowerCurrent receivables-b)InventoryAccounts payableProgress collectionsCurrent contract assets2Q'21 commentary Industrial FCF up 2.0B y/y ex discontinued factoring programs* earnings improved y/y across all segments Exiting most factoring programs a big operational step Positive working capital flow with improved turns:Strong 2Q performance leading to 2021 Outlook raise for Industrial FCF** Non-GAAP Financial Measure(a – Aggregates the following: Net earnings (loss) and (earnings) loss from discontinued operations(b – Excludes CFOA impact from factoring programs discontinued as of April 1, 2021, of (2.7)B in 2Q'21(c – Aggregates the following: (Gains) losses on sales of business interests, (Gains) losses on equity securities, principal pension plans (net), other post retirement benefit plans (net), income taxes (net), and all other operating activities; excludesdeal taxes and GE Pension Plan contributions(d – Aggregates the following: additions to property, plant & equipment (PP&E) and internal use software(e – Excludes CFOA impact from factoring programs discontinued as of April 1, 2021 in current and prior periods, of (2.7)B in 2Q'21, (0.8)B in 1Q'21 and (0.5)B in 2Q'205
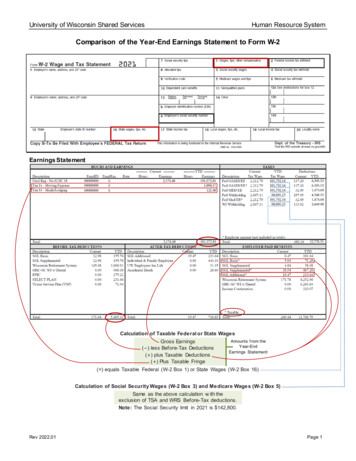
Liquidity and deleveraging update( in billions)Cumulative debt reduction-a)Progress Ample liquidity . 22B of cash Reduced backup credit facility down to 10B & extendedmaturity date to '26 Remain committed to 45B gross debt over next few years Executed 7B debt tender Continue to de-risk pension U.K. freeze2Q discontinued factoring balance down (3)BTargeting net debt / EBITDA 2.5x maintain strong investment grade ratingContinued progress on debt reduction(a - Cumulative gross debt reduction since 4Q’18 - includes pension; numbers may not add due to rounding(b - Includes 1.0B remaining 2021 debt maturities and further debt reduction associated with the GECAS deal closure(c - Post the close of the AerCap / GECAS transaction6
2Q'21 Industrial segments results( in billions)AviationHealthcareRenewable EnergyPower /%y/yy/y(org.)* /%y/yy/y(org.)* /%y/yy/y(org.)* /%y/yy/y(org.)*Orders 5.547%47% 4.814%11% 3.27%5% 4.867%63%Revenue 4.810%10% 4.514%10% 4.016%9% 4.33%0%Segmentprofit 0.2FF 0.858%47% (0.1)61%71% s520bps7.0%820bps910bps1,930bps 1,930bpsReturn to growth momentum building across the segments* Non-GAAP Financial Measure: organic revenue, organic segment profit, and organic segment margin in columns labeled y/y (org.)7
2Q'21 GE Capital & Corporate results( in billions)GE CapitalAdjusted earnings*-a)Corporate2Q'21y/y /sequential 0.0F y/yFunctions & operations (0.2)14%EHS-c) and other items (0.0)UEliminations (0.1)(63)%Adjusted Corporate costs* perations earnings 96.6 (1.8)sequential (0.6)42%y/y Adj. continuing earnings* up y/y better EFS results, Insurancefavorable claims, preferred dividend Disc. ops. loss mainly driven by mark to market from recentdecline in AerCap stock price Reduced functional spend & improved operations Continued focus on decentralization & leaner processes Corporate headcount down (11)% y/yManaging GE Capital transition & continuing to streamline Corporate*Non-GAAP Financial Measure(a - Excludes debt extinguishment costs of 0.6B in 2Q21 and 0.1B in 2Q20(b - Total segments assets of 67.9B plus assets of discontinued operations of 36.1B, less GE Capital cash 6.9B and discontinued operations cash of 0.5B(c - Environmental, health & safety8
Wrap-upStrong overall performance, raising Industrial FCF* outlook to 3.5B - 5.0BTransforming to a more focused, simpler, stronger high-tech industrial companyInnovating for a more sustainable world & driving long-term valueAviation's CFM RISE engine development programBuilding a world that works future of flight, precision health,energy transitionGas Power's 9HA turbineHealthcare's Senographe Pristina MammographySystemTMServing customers invital global markets withleading service capabilitiesFocus on profitable growth & cashgeneration HSD FCF* marginsby 2023 GE on a positive trajectory for 2021 & beyond* Non-GAAP Financial Measure9
Q&A10
Appendix 2021 overview Aviation update: what we’re seeing Liquidity & Debt update Maturity profile Orders Orders units11
2021 overview (updated July 2021)RevenuesMarginsOutlook assumptions Aviation market recovery beginning in 2H '21 top line flatLSD250 bps expansion(GE Industrial organic*)(Adjusted GE Industrialorganic margin*)No changeNo change Gas a key enabler of energy transition services growth,selective equipment deals Renewable market growth expand international & servicesin Onshore, ramp up Offshore, optimize cost base Attractive Healthcare market with scans at pre-COVID levels invest in Healthcare systems growth, PDx recoveryFree cash flow*EPSPrior: 2.5B to 4.5B 0.15 - 0.25(GE Industrial FCF*)(Adjusted EPS*) FCF* driven by earnings & working capital, excludes one-timefactoring reduction impactKey variables Aviation market recovery, timing of aircraft deliveriesUpdated: 3.5B to 5.0BNo change Renewable Energy operational execution, PTC uncertainty Healthcare market recovery & growth Restructuring timing & executionPositive trajectory in 2021, though still challenged by Aviation* Non-GAAP Financial MeasureUpdate – excludes impact of factoring reduction from 2Q’21 to 4Q’21Update – EPS estimates given at outlook will change to 1.20 - 2.00 post 1:8 reverse stock split effective close of trading July 30, 202112
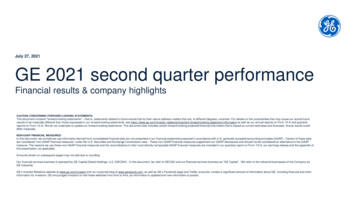
Aviation update: what we’re seeingEnd market dynamics: departures-a)DynamicsGE/CFM departures (27)% compared tosame week in 2019-b) Recovery momentum on improved fundamentals & market indicators: 2/3 of GE/CFM departures concentrated in improving regions: NAM, Europe, China Strong market recovery in narrow-body fleets green-time impact decreasing in 2H'21 SVs-d) trending better expect to increase sequentially, 3Q SVs up 25 % y/y SV-d) scope slightly improved continue to monitor MRO inventory levels, product line mix CMR-e) negatively impacted 2Q margins largely related to a contract in a loss position1Q’202Q’20GE / CFM total3Q’204Q’201Q’21GE / CFM domestic2Q’21GE / CFM int’l 20% of GE/CFM fleet parked-c) Freight up 37%-b)Jul Commercial Engines: Aligned to production rates 3Q units expected to be up y/y and q/q Future rates – Assessing rate readiness across supply chain and working w/ airframers Military: Working full resolution of current supply chain challenges Departure levels improving-b) NorthAmerica (11)%, Europe (40)%, China (6)%, APAC lagging (63)% Cost actions: 0.5B incremental impact in '21 total 0.5B in structural cost out since '19 Expect sequential margin expansion in 2H LDD margins for '21Continue planning for 2021 GE/CFM departures 20% y/y & SVs-d) flat y/y(a – Source: FlightAware; rolling 7 day average vs. same week in 2019, updated from avg of Jan 21-27 of 2020 baseline global departures(b – As of July 21st(c – As of July 22nd(d – World Wide Shop Visits ex-LEAP(e – Contract Margin Review13
Liquidity & Debt update( in billions)GE Industrial cash balance walkBeginning balance – 1Q’21GE Industrial FCF*Discontinued factoringBKR proceedsDebt tender costsOther borrowingsOtherEnding balance – 2Q’21GE Capital cash balance walk 22.40.4(2.7)1.0(4.7)(0.2)(0.6) 15.6Beginning balance – 1Q’21-a)Business operations / otherContractual debt maturitiesDebt tender costsAlternative fundingOtherEnding balance – 2Q’21-a) 9.42.6(0.9)(3.9)(0.5)0.2 6.9GE Capital debt balance walk-b)GE Industrial debt balance walk-b)Beginning balance – 1Q’21Debt tenderOtherEnding balance – 2Q’21Beginning balance – 1Q’21 22.9(4.1)0.0 Other borrowings 18.8 (0.2), FX 0.2 48.7Contractual debt maturities(0.9)Debt tender(3.2)OtherEnding balance – 2Q’21* Non-GAAP Financial Measure(a – Excludes discontinued operations cash and Insurance cash of 1.6B at 2Q'21 and 2.3B at 1Q’21(b – Consolidated debt of 63.5B in 2Q’21 and 71.4B in 1Q’21, after intercompany eliminations of (0.1)B at 2Q’21 and (0.3)B in 1Q’210.2 MTM 0.6, Alt Funding 44.9 (0.5), FX/Other 0.214
Maturity profile( in billions)YTD maturitiesGE IndustrialGE Capital 14.9B long term debt maturitiesoutstanding as of June 30, 2021-a) 46.3B long term debt maturitiesoutstanding as of June 30, 2021-a)-(a – Principal amount outstanding on publicly traded long term debt(b – 1Q’21 maturities 0.9B, 2Q'21 maturities 0.9BYTD maturities 1.8-b)15
Orders - supplemental information( in billions)Equipment ordersService ordersTotal orders2Q'21y/y (org.)2Q'21YTDy/y (org.)2Q'21y/y (org.)2Q'21YTDy/y (org.)2Q'21y/y (org.)2Q'21YTDy/y (org.)Aviation 2.0(5)% 4.0(8)% 3.5F 7.02% 5.547% 11.0(2)%Healthcare 2.77% 5.27% 2.115% 4.29% 4.811% 9.38%RenewableEnergy 2.1(17)% 5.1(4)% 1.1F 1.678% 3.25% 6.79%Power 1.5F 2.322% 3.328% 6.118% 4.863% 8.419%GEIndustrial 8.212% 16.45% 10.150% 18.911% 18.330% 35.38%16
Orders - supplemental information, units(in units)2Q'212Q'202Q'21 YTD2Q'20 YTDAviationCommercial Engines55574853242LEAP Engines-a)438245793098463279735Wind Turbines-b)3986451,1261,383Wind Turbine Gigawatts-b),-c)1.52.23.74.5Repower roderivatives-d)3544374.20.45.92.6Military EnginesRenewable EnergyPowerGE Gas TurbinesHeavy-Duty Gas Turbines-d)GE Gas Turbine Gigawatts-c)(a - LEAP engines are a subset of commercial engines(b - Includes Onshore and Offshore units(c - Gigawatts reported associated with orders in the periods presented(d - Heavy-Duty Gas Turbines and Aeroderivatives are subsets of GE Gas Turbines(e - HA-Turbines are a subset of Heavy-Duty Gas Turbines17
Non-GAAP reconciliations Aviation Commercial Services & Engines organic revenues Healthcare Systems & PDx organic revenues GE Industrial free cash flow (FCF) & GE Industrial rebaselined FCF (incl. and excl. BP) Gas Power equipment & service organic revenues18
Non-GAAP reconciliation: Aviation Commercial Services &Engines organic revenuesAVIATION COMMERCIAL SERVICES ORGANIC REVENUES (NONGAAP)(Dollars in millions)Aviation commercial services revenues (GAAP)Adjustments:Less: acquisitionsLess: business dispositionsLess: foreign currency effectAviation commercial services organic revenues (Non-GAAP)AVIATION COMMERCIAL ENGINES ORGANIC REVENUES (NONGAAP)(Dollars in millions)Aviation commercial engines revenues (GAAP)Adjustments:Less: acquisitionsLess: business dispositionsLess: foreign currency effectAviation commercial engines organic revenues (Non-GAAP) 2Q'211,758 2Q'201,170V% 2Q'21 YTD 2Q'20 YTD50 % 3,747 4,464V%(16)% ———1,758 ———1,170———3,747 ———4,464(16)% 2Q'212Q'201,357 1,349V% 2Q'21 YTD 2Q'20 YTD1 % 2,723 3,168V%(14)% ——————1,357 1,349———2,723 (14)%50 % 1 % ———3,168* Non-GAAP Financial MeasureWe believe that these measures provide management and investors with a more complete understanding of underlying operating results and trends of established, ongoing operations by excluding theeffect of acquisitions, dispositions and foreign currency, as these activities can obscure underlying trends. We also believe that presenting organic revenues* and organic profit* separately for ourindustrial businesses provides management and investors with useful information about the trends of our industrial businesses and enables a more direct comparison to other non-financial companies.19
Non-GAAP reconciliation: Healthcare Systems & PDx organicrevenuesHEALTHCARE SYSTEMS ORGANIC REVENUES (NON-GAAP)(Dollars in millions)2Q'212Q'20Healthcare Systems revenues (GAAP) 3,915 3,523Adjustments:Less: acquisitions—(29)Less: business dispositions——Less: foreign currency effect138—Healthcare Systems organic revenues (Non-GAAP) 3,777 3,552PDx ORGANIC REVENUES (NON-GAAP)(Dollars in millions)PDx revenues (GAAP)Adjustments:Less: acquisitionsLess: business dispositionsLess: foreign currency effectPDx organic revenues (Non-GAAP)2Q'212Q'20 539 370 ——27511 —25—345V% 2Q'21 YTD 2Q'20 YTD11 % 7,740 6,971V%11 %——2427,499 (46)——7,0177%V% 2Q'21 YTD 2Q'20 YTD46 % 1,021 820V%25 %6 % 48 % 18—43959 (4)60—76326 %* Non-GAAP Financial MeasureWe believe that these measures provide management and investors with a more complete understanding of underlying operating results and trends of established, ongoing operations by excluding theeffect of acquisitions, dispositions and foreign currency, as these activities can obscure underlying trends. We also believe that presenting organic revenues* and organic profit* separately for ourindustrial businesses provides management and investors with useful information about the trends of our industrial businesses and enables a more direct comparison to other non-financial companies.20
Non-GAAP reconciliation: GE Industrial free cash flows (FCF), GEIndustrial rebaselined FCF (including and excluding BioPharma)GE INDUSTRIAL FREE CASH FLOWS (FCF) (NON-GAAP)(Dollars in millions)GE Industrial CFOA (GAAP)Add: gross additions to property, plant and equipmentAdd: gross additions to internal-use softwareLess: CFOA impact from factoring programs discontinued as ofApril 1, 2021-a)Less: taxes related to business salesGE Industrial free cash flows (Non-GAAP)Less: prior period CFOA impact from factoring programsdiscontinued as of April 1, 2021-a)GE Industrial rebaselined free cash flows (Non-GAAP)Less: BioPharma CFOALess: BioPharma gross additions to property, plant and equipmentLess: BioPharma gross additions to internal-use softwareGE Industrial rebaselined free cash flows excluding BioPharma(Non-GAAP) 2Q'21(2,031) (267)(25)(2,706)2Q'20(1,604) (498)(36)—V 2Q'21 YTD 2Q'20 YTD(428) (2,522) (3,266) 75) (765)(1,635)(2,706)(6)388 (71)(2,067) 652,456 —(472)472 388 ———(1,595) ———1,983 ———308 ———(2,640) 315(17)(2)2,948(315)172 388 (1,595) 1,983 308 (2,935) 3,243 (6)(457) V 74340447823,818870(a – Represents the CFOA impact from cash that GE Industrial would have otherwise collected had customer receivables not been previously sold in factoring programs that have now been discontinued.* Non-GAAP Financial MeasureWe believe investors may find it useful to compare GE’s Industrial free cash flows* performance without the effects of cash used for taxes related to business sales and the factoring programdiscontinuation. We believe this measure will better allow management and investors to evaluate the capacity of our industrial operations to generate free cash flows.21
Non-GAAP reconciliation: Gas Power equipment & serviceorganic revenuesGAS POWER ORGANIC EQUIPMENT REVENUES (NON-GAAP)(Dollars in millions)Gas Power equipment revenues (GAAP)Adjustments:Less: acquisitionsLess: business dispositionsLess: foreign currency effectGas Power organic equipment revenues (Non-GAAP)GAS POWER ORGANIC SERVICE REVENUES (NON-GAAP)(Dollars in millions)Gas Power service revenues (GAAP)Adjustments:Less: acquisitionsLess: business dispositionsLess: foreign currency effectGas Power organic service revenues (Non-GAAP)2Q'212Q'20 621 1,106V% 2Q'21 YTD 2Q'20 YTD(44)% 1,455 2,200V%(34)%——271,428 ———2,200(35)%2Q'212Q'20 2,428 1,972V% 2Q'21 YTD 2Q'20 YTD23 % 4,423 3,736V%18 %————27— 2,401 1,972——334,391 18 % ————18—603 1,106(45)% 22 % * Non-GAAP Financial MeasureWe believe that these measures provide management and investors with a more complete understanding of underlying operating results and trends of established, ongoing operations by excluding theeffect of acquisitions, dispositions and foreign currency, as these activities can obscure underlying trends. We also believe that presenting organic revenues* and organic profit* separately for ourindustrial businesses provides management and investors with useful information about the trends of our industrial businesses and enables a more direct comparison to other non-financial companies.———3,73622
Upcoming calendar3Q’21 earningsOctober 26, 20214Q’21 earningsJanuary 25, 202223
(e -Excludes CFOA impact from factoring programs discontinued as of April 1, 2021 in current and prior periods, of (2.7)B in 2Q'21, (0.8)B in 1Q'21 and (0.5)B in 2Q'20 2Q'21 commentary Industrial FCF up 2.0B y/y ex discontinued factoring programs* earnings improved y/y across all segments