Transcription
LAWResearch MethodologyData Analysis
RolePrincipal InvestigatorNameProf. (Dr.) Ranbir SinghPaper CoordinatorProf. (Dr.) G.S. BajpaiCo-Principal InvestigatorContent Writer/AuthorContent ReviewerProf. (Dr.) G.S. BajpaiProf. (Dr.) G.S. BajpaiMs Deepika PrakashProf. V.K.SrivastvaAffiliationVice Chancellor, NationalLaw University, DelhiRegistrar, National LawUniversity DelhiRegistrar, National LawUniversity DelhiRegistrar, National LawUniversity DelhiNational Law UniversityDelhiDepartment ofAnthropology , Universityof DelhiDESCRIPTION OF MODULEItemsDescription of ModuleSubject NamePaper NameModule Name/TitleModule IdObjectivesLawResearch MethodologyData AnalysisXIIITo study the concept and method of analyzing data in aresearchData processing, tabulation, graphical representation,analysis , statistics, statistical software, interpretationKey wordsLEARNING OUTCOMEThis module will elaborate on the meaning and utility of data analysis. It will providea brief understanding of data processing, analysis and interpretation in the researchprocess. The major focus of the module is to guide data analysis -how to plan, collectand mange the data so collected in a quantitative research for a meaningful researchoutcome.1. OVERVIEW OF THE STEPS IN RESEARCHIn every research, following are the general steps involved: Defining problemReviewing the available literatureFormulation of hypothesis or research questionsCreating a research designCollection of data with the help of various research toolsProcessing of the data collectedAnalysis and interpretation of the dataReport writing
The present module seeks to understand how to handle the data which has beencollected in the research process in order to come up with some concrete findings in ascientific and systematic manner. The data analysis in this module refers to datacollected only in a quantitative study. In such a study numerical data which has beengathered by the researcher presents quantities and variables which have been collectedusing tools such as structured observations, questionnaire and various tests.2. MEANING OF DATA ANALYSISIn any research, the step of analysis of the data is one of the most crucial tasksrequiring proficient knowledge to handle the data collected as per the pre decidedresearch design of the project.Analysis of data is defined by Prof Wilkinson and Bhandarkar asA number of closely related operations that are performed with thepurpose of summarizing the collected data and organizing these in such amanner that they will yield answers to the research questions or suggesthypothesis or questions if no such questions or hypothesis had initiated thestudy.According to Goode , Barr and Scales,analysis is a process which enters into research in one form or another formthe very beginning It may be fair to say that research consists in general oftwo larger steps –the gathering of data, but no amount of analysis can validlyextract from the data factors which are not present.In his book on research methodology, C. R. Kothari explains that the term analysisrefers to the computation of certain measures along with searching for patterns ofrelationship that exist among data-groups. He quotes G.B.Giles to further elaboratethe concept as “in the process of analysis, relationships or differences supporting orconflicting with original or new hypotheses should be subjected to statistical tests ofsignificance to determine with what validity data can be said to indicate anyconclusions”Hence, whether it is a qualitative or quantitative research even if the data is sufficientand valid, it will not serve any purpose unless it is carefully processed andscientifically analyzed and interpreted.3. DIFFERENCE BETWEENINTERPRETATIONDATAANALYSIS,PROCESSINGANDThe general understanding is that data analysis and processing are one and the same.However a number of researchers and authors are of the opinion that both of them aretwo very distinct steps in the research process where data processing leads to dataanalysis. Lets us understand the difference between the two in more detail.Prof. John Gauing is of the opinion that processing of data refers to concentrating,recasting and dealingwith the data so that they are as responsive to analysis, while analysis of data refers toseeing the data in the light of hypothesis of research questions and the prevailing
theories and drawing conclusions that are as amenable to theory formation aspossible. 1According to Francis Rummel, “the analysis and interpretation of data involve theobjective material in the possession of the researcher and his subjective reaction anddesires to derive from the data the inherent meaning in their relation to the problem.To avoid making conclusions or interpretations from insufficient or invalid data, thefinal analysis must be anticipated in detail when plans are being made for collectinginformation.3.1 Data ProcessingOnce the data is collected, following steps are taken to process the data into moremeasurable and concise manner:a. EditingIn the stage of editing all the raw data that is collected is checked for errors,omissions sometimes legibility and consistency as well. This ensure basicstandard in the data collected and facilitate further processing.b. CodingCoding refers to the process of assigning numerals or other symbols toanswers so that responses can be put into a limited number of categories orclasses. Such classes should be appropriate to the research problem underconsideration. They must also be exhaustive (i.e., there must be a class forevery data item) and also that of mutual exclusively which means that aspecific answer can be placed in one and only one cell in a given categoryset. 2 Coding can also be pre or post. Pre coding meaning codes beingassigned while the questionnaire or interview schedule is being prepared. Inthe case of post coding, codes are assigned to the answers after they arecollected.c. ClassificationOnce the data is collected it is to be divided into homogeneous groups forfurther analysis on the basis of common characteristics.d. TabulationTabulation is the process of summarizing raw data and displaying the same incompact form (i.e., in the form of statistical tables) for further analysis. In abroader sense, tabulation is an orderly arrangement of data in columns androws.Tabulation is essential because of the following reasons1. It conserves space and reduces explanatory and descriptive statement to aminimum.2. It facilitates the process of comparison.3. It facilitates the summation of items and the detection of errors andomissions.4. It provides the basis for various statistical computations.Dr. Y.K.Singh and Dr. R.B Bajpai, Research Methodology: Data Presentation, p 151, APHPublishing Corporation, ed 2012.2 C.R.Kothari, Research Methodology- Methods and Techniques, P 123, new age internationallimited publisher, 2nd ed.1
Tabulation can be done by hand or by mechanical or electronic devices. Thechoice depends on the size and type of study, cost considerations, timepressures and the availability of tabulating machines or computers. Inrelatively large inquiries, we may use mechanical or computer tabulation ifother factors are favorable and necessary facilities are available.3Tabulation may be a very effective way of making legal researchmanageable, readable and understandable.Types of tableThere are generally two types of tables simple and complex. They arediscussed following:(i)Simple table/ frequency distributionUnder it , the different attribute are stated in the left hand column andthe frequency or extend of occurrence of each of theses classed arewritten in another column. In this three things are essential) theclasses made must be mutually exclusive, b) the tabulation must haveinternal logic and order, and c) the class intervals must carefully andreasonably selected.4 Following is an illustration of the same.Table 1- 302216.931-404232.341-502620Above 5086.2Total130100Age of therespondentsBelow 10In the above table the only variant is age.(ii)Complex or cross tableSupra note 2.Dr R. Kumar, Methodology of social Science Research, p223, Book Enclave , Jaipur, 2002.5 R.Ahuja, Research Methods,34
In a complex table, bi or multivariate are used. These have becomemore popular in the research representation in recent years.Following is an example of the same.Table 2- rbanRuralUrbanBelow e 100051521436Above 50002100820Above10000180514In the above table there are three variants i.e income, residence andsex are being studied and tabulated.Preparation of a tableFollowing are certain guidelines to be kept in mind while preparing atable:1. Title of the table - give suitable heading to each table whichshould be short and appropriate2. Sub headings and captions - subheadings to different columnsand rows must be given. Captions are given to the variousclassifications made like income, age, sex etc.3. Size of the column- each column must have the correct sizewhich make them look more attractive4. Arrangement of items in rows and columns - items must bearranged in one order like alphabetically, chronologically etc.5. Totals - the total for different columns must be different.6. Demarcation of columns - If columns have been divided furtherinto sub groups, they should be in an suitable order and subheadings7. Footnotes - If there is anything special about the table or figureswhich need to be bought attention to, the same should bementioned in a footnote.3.2 Data InterpretationOnce the data has been processed and analyzed, the final step required in the researchprocess is interpretation of the data. The line between analysis and interpretation isvery thin. Through interpretation one understands what the given research findingsreally mean and what is the underlying generalization which is manifested thoughtthe data collected. This can be descriptive or analytical or theoretical. The data is
interpreted from the point of the research questions and hypothesis is tested. Whileinterpretation is being done, generalizations are drawn. Thus, interpretation consistsof conclusion s that the researcher has reached after the data has been processed andanalyzed.It is interesting to mention that Bloom’s taxonomy has laid down a structure on datapresentation6:1. Describe - Pen down the ‘facts’ observed/ heard after filtering the non relevant data.2. Classify - Group the material based similarities, categorize, and make headings.3. Interpret - identify important features and patterns in the light of the researchquestions or hypothesis and then represent them.4. TYPES OF DATA ANALYSISData analysis depends upon the nature of research that the researcher is undertaking.Types of data analysis vary depending upon whether the research is qualitative orquantitative in nature. In the present module, as earlier stated we will be studyingvarious types of data analysis from the stand point of quantitative research lysis4.1 Descriptive analysisAccording to C Emory, “descriptive analysis is largely the study of distribution ofone variable. This study provides us with profiles of companies, work groups, personsand other subjects on any multiple characteristics such as size, composition,efficiency, preferences, etc.”7Illustration: The researcher is collecting data from various law colleges in India tomap the job preferences of the students in the final year of LL.B. In such a researchjob preferences like litigation, corporate, further studies, judiciary etc becomes thevariable.G. Guthrie, Basic Research Methods an entry to social science research, p 158, Sage publication ,3rd edition 20127 C. William Emory, Business Research Methods, p. 356.6
Under it statistical tools like percentage and means are used and the data is thenrepresented through a graph. The data analysis may be having one variable alsoknown as one-dimensional analysis or two variables/ bivariate analysis or more thantwo variables also described as multivariate analysis.4.2 Inferential analysisInferential analysis is concerned with the various tests of significance for testinghypotheses in order to determine with what validity data can be said to indicate someconclusion or conclusions. It is also concerned with the estimation of populationvalues. It is mainly on the basis of inferential analysis that the task of interpretation(i.e., the task of drawing inferences and conclusions) is performed.Illustration:The researcher is studying the access to justice system in India and his hypothesisbeings that the India justice delivery system favors the haves and marginalizes thehave not’s. The data collected is from various stages in the delivery system like policestation, courts of justice, litigants etc. Once the data is collected, proceeded then theresearcher does inferential analysis to test the validity of the hypotheses.5. GENERAL CHARATERISTICS OF ANALYSIS OF THE DATA1. The researcher should keep in mind that the analysis of data will vary dependingupon the type of study i.e. qualitative or quantitative or mixed in nature.2. The researcher should posses thorough knowledge of the area of research as well asthe data collected by him which will help in the analysis of data.3. The data to be analyzed and interpreted should:a. Be reproducible,b. Be readily disposed to quantitative treatmentc. Have significance for some systematic theory, and can serve as broadgeneralization.4. The researcher should keep a clear set of hypothesis formulated at the very start ofthe research which will lead to clearer actions and better data collection as well asanalysis.5. In case the data collected is from vague clues rather than according to the specifichypothesis, in such cases the data are analyzed inductively or investigated during theprocess and not by means of any prescribed set of rules.6. For a successful study, the task of analysis and interpretation should be designedbefore the data is actually collected.6. STATISTICAL ANALYSIS OF DATAStatistics is an important tool in the hands of a researcher for a good research.Croxton and Cowden, two well known statisticians have introduced a simple,definition of statistics. In their words, “statistics may be defined as the science ofcollection, presenting and analysis and interpretation of numerical data.” 8Statistics is not merely a device for collecting numerical data but also a means ofsound techniques for their handling, analysis and drawing value inferences from them.S Gupta, Research Methodology and Statistical techniques, p 200, Deep and Deep Publication,2007.8
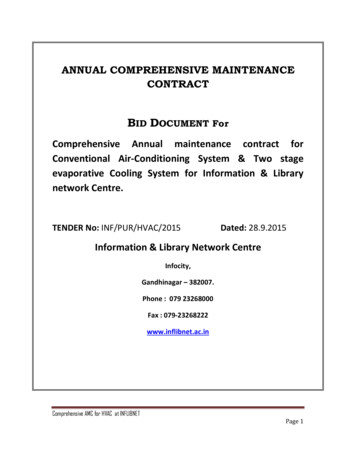
When the data are collected, edited, classified, tabulated, it is analyzed and interpretedwith the help of various statistical techniques and tools depending upon the nature ofthe investigation.6.1 Uses of statisticsStatistics is useful in all fields of research and study. One of the greatest advantagesof the use of statistics is that in a research with large data, it helps in reducing suchdata into a more manageable size for the purpose of analysis and interpretation. It alsohelps in comparing two or more series as well as draw inferences and conclusions ofthe research.Illustration- The researcher is doing an impact analysis of the National Food SecurityAct, 2013 in the National Capital Territory. The universe of the researcher in such acase is Delhi, and the population is all the segments of people who are eligible for thefood under the said Act. The tool of data collection chosen by the researcher is surveymethod. Once the data is collected, the size of the data would be big. Here, statisticaltools would be of great assistance to the researcher to achieve his research objective.6.2 Limitations of statisticsThough statistical methods are of great value to a researcher, they carry withthemselves certain limitations which must be kept in mind while deciding a tool ofdata analysis. They are:1. Qualitative values like subjective perceptions, qualities and attributes are notconsidered under statistics. It only considers quantities. This by far is the greatestlimitation of statistics.2. Statistics studies and analysis group attributes rather than individual characteristicsand values.3. Statistical analysis is mostly based on average; hence the inferences drawn throughthem are only approximate and not exact like that of mathematics.4. Statistics only help discover, analyze certain characteristics. It does not explain thepicture. Hence, it only forms a part of the inference and interpretation.6.3 Tools of statistical analysisThere are various statistical tools which are available for the researcher’s assistance.data analysistoolsmeasurecentraltendencymeasure ofdispersionmeasure ofasymmetrymesaure ofrelationshipothermeasures1. Measure central tendencyThe term central tendency connotes the average. The most common central tendencytools are average or mean, median, mode, geometric mean and harmonic mean.2. Measure of dispersionThe measure of dispersion or variability is the most common corrective measure forthe concept of average. The most common method of the same is standard deviation.Others are mean deviation and range.3. Measure of asymmetry
The tools used under it are skewness and kurtosis. Skewness is a measure that refersto the extent of symmetry or asymmetry in a distribution. It is used to describe theshape of a distribution. Kurtosis is a measure that indicates the degree to which acurve of a frequency distribution is peaked or flat-topped.4. Measure of relationshipCorrelation and coefficient is commonly used to measure the relationship. It is mostlyused for prediction. Higher the degree of correlation, greater the accuracy with whichone can predict a score. Karl Pearson’s coefficient of correlation is the frequentlyused measure in case of statistics of variables, whereas Yule’s coefficient ofassociation is used in case of statistics of attributes. Multiple correlation coefficient,partial correlation coefficient, regression analysis, etc., are other important measuresoften used by a researcher.95. Other measuresIndex number and analysis of time series are some of the other tools of data analysis.Index numbers are indicators which reflect the relative changes in the level of acertain phenomenon in any given period called the current period with respect to itsvalues in some other period called the base period selected primarily for thiscomparison.Illustration: Index number is used to compare the changes in the national income ofIndia from independence (1947) to the year 2014.Analysis of time seriesA time series is an arrangement of statistical data in accordance with its time ofoccurrence. If the values of a phenomenon are observed at different periods of time,the values so obtained will show appreciable variations.6.4 Statistical software packagesTo assist the researcher in quantitative data analysis, there are various statisticsoftwares available for computerized statistical data analysis. Some of them areavailable in the open source/ public domain i.e. free of cost while others are paid andpurchased softwares. They are of great help when analyzing large quantities of data.The two most commonly used softwares are SAS (Statistical Analysis System) andSPSS (Statistical Package for Social Sciences).7. ANALYSIS WHEN HYPOTHESIS EXISTSWhen specific hypothesis has been set down, then the major part of analysis involvesgetting the appropriate combinations of data and reading them so as to verify orfalsify the hypothesis. A hypothesis which is tested for possible rejection is known as‘null hypotheses. Null hypothesis is very much useful in testing the significantdifference between assumed and observed values.8. PRECUATIONS IN ANALYSIS AND INTERPERTATION OF DATAFollowing are some of the common precautions to be kept in mind while analyzingand interpreting the data:1. Comprehensive knowledge and proper perspective9Supra note no 2.
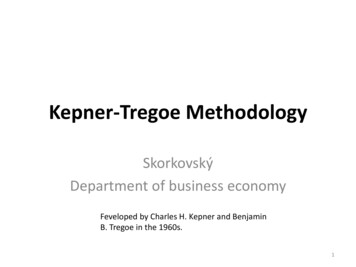
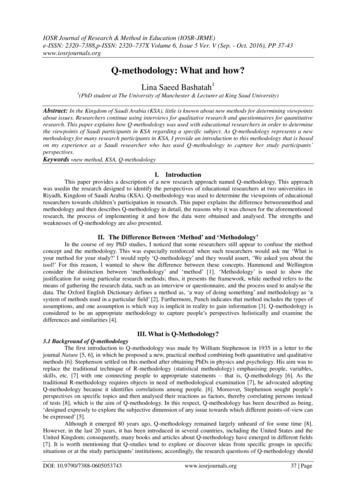
The researcher while analyzing and interpreting the data must have thoroughknowledge of the research from a wider perspective rather than analyzing theimmediate element of the problem.2. Take into account all pertinent elementsThe researcher must keep all relevant factors/elements into consideration whileanalyzing and interpreting the data. Failure to do so will make the generalizationsdrawn inaccurate.3. Limitations of the studyThe researcher must mention all the limitations in the study like non-representation insampling, bias in the data, inadequacy in the design, inaccurate statistical analysis etc.4. Proper evaluation of dataSuitable interpretation of data lies on proper evaluation of facts. The researcher mustinterpret and analyze the data thoroughly himself for better results.9. DIAGRAMMATIC REPRESENTATATIONA very convenient and appealing method of data representation is by using variousforms of diagrams. They in a very meaningful way highlight the salient features ofthe data which makes them easy to understand. Following are examples of some ofthe diagrammatic representations that may be employed in the research report. It maybe noted that all the diagrams are fictitious and made only for illustrative purposehere:a) GraphIn a graph there are two axis the X and Y axis. X axis is horizontal and the Y axisis vertical intersecting the X axis. The point where intersection occurs is the placeof origin. The independent variables are scaled on the X axis and the dependentone on the Y axis.Following is an illustration of the same.In the graph the growth of female literacy in India since independence has beenshown. The X axis has the years while the Y axis has the rate of growth ofwomen literacy in India.Graph
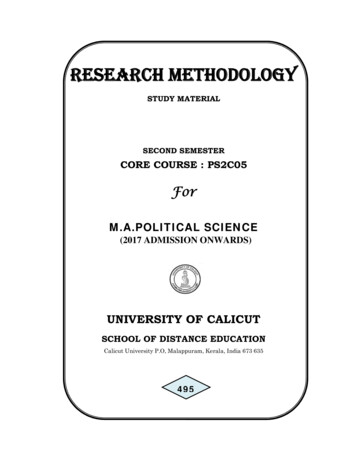
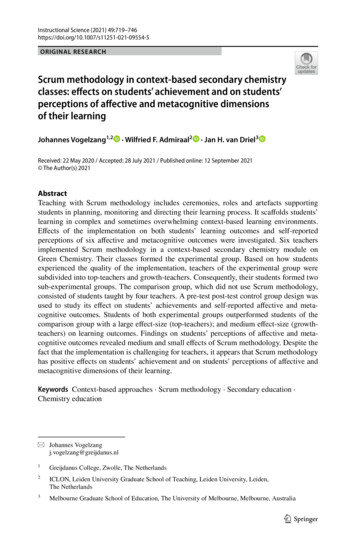
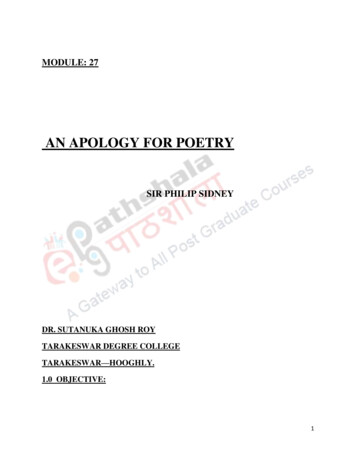
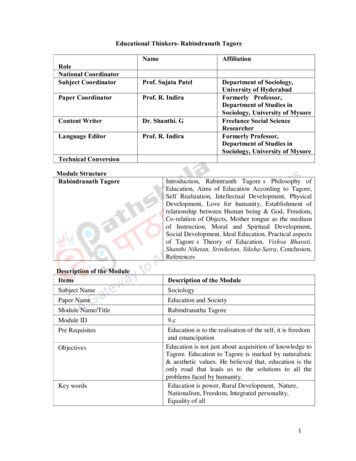
807060504030201001950196019701980199020002010b) Bar diagramThe bar diagrams are drawn either vertically or horizontally. Each bar indicatesthe value of the variable.Illustration- The following bar diagram shows by way of example what was thevoters turn out till the year 2010 general election in the state of Delhi. The data ismerely for illustration purpose.Growth of voters in India2001-20101991-20001981-1990Female turnout1971-1980Male turnout1961-19701950-1960020406080c) Pie chartIn a pie chart, the data is presented in the form of a circle with each categoryoccupying a segment that is proportional according to the size of its data.
Following is an illustration of the same:Percentage distribution of crimes inIndia in the year 2000Domestic crimesEconomic crimesProperty crimesViolent crimesother crimes10. CONCLUSIONIn the research process, data analysis is a very important and scientific step especiallywhen the researcher is conducting a quantitative research. The researcher mustunderstand the research area comprehensively and do the processing, analysis andfinally interpretation with the help of various techniques and tools of analysisdepending upon the nature, scope and aims of the research being conducted.
3. It facilitates the summation of items and the detection of errors and omissions. 4. It provides the basis for various statistical computations. 1 Dr. Y.K.Singh and Dr. R.B Bajpai, Research Methodology: Data Presentation, p 151, APH Publishing Corporation, ed 2012.