Transcription
Gen. Physiol. Biophys. (1993), 12, 95—11195Relation Between Ionic Channel Conductanceand Conductivity of MediaContaining Different Nonelectrolytes.A Novel M e t h o d of Pore Size DeterminationR. Z. SABIROV, 0 . V. KRASILNIKOV, V. I. TERNOVSKY and P. G. MERZLIAKInstitute of Physiology and Biophysics, Academy of Sciences,700095, Ntjazova 1, Tashkent, UzbekistanA b s t r a c t . T h e effects of nonelectrolytes on conductivity and viscosity of KC1solutions as well as on ion channel conductance were studied. Mobility of ionsin solutions were found to solely depend on percent concentration ( w / w ) of thenonelectrolytes added and to be effectively independent on their chemical nature(sugars or polyglycols) and molecular size. Proportional changes in both the ionchannel conductance and the conductivity of bulk solution induced by low m. w.nonelectrolytes m a y be used as a criterion of diffusion mechanism of ion transportthrough channels. T h e slope of the dependence of ion channel conductance onconductivity of bulk solution containing different concentrations of nonelectrolytesis a good measure of channel permeability for nonelectrolyte.A new method of pore size determination is introduced. Results of practicalapplication of this simple method to three types of ion channels (formed by alphalatrotoxin, staphylococcal alpha-toxin and its N-terminal fragment) are shown. Theadvantages and disadvantages of the m e t h o d are discussed.K e y w o r d s : Ionic channels — Nonelectrolytes — Pore size determinationIntroductionT h e actual mechanism of ion transport through channels may be established bystudying the relation between the movement of ions in bulk solution and t h a twithin the water-pore of an ion channel. Changes in ion movement in bulk solutionm a y be induced by several method, including addition of indifferent unchargednonelectrolytes. Studying the influence of uncharged molecules of different sizes onion currents through channels can also supply d a t a about geometrical parametersof water-filled pore, especially about the effective radius. So far exact values forradii of most channels have remained unknown or contradictory. T h e methods usedI
96Sabirov et al.earlier were associated with numerous difficulties and limitations, and often theywere inexact.For example, the method based on the determination of channel permeabilityto ions of large size (Hille 1972; Cecchi et al. 1982) does not account for electrostaticinteractions between passing ions and ionogenic groups of the channel though thisrelation can essentially change the value of the radius obtained.Another m e t h o d was built on the assumption t h a t the conductance of anion channel is equal to the conductivity of a simple cylinder of water solution(Benz and Hancock 1981; Colombini 1980). The length of the cylinder was usuallyassumed to be equal to the membrane thickness. Although the method is simple,it does not account for fundamental processes such as friction between ions andthe channel wall (Antonov 1982) or repulsion of ions from the hydrophobic zoneof BLM (Markin and Chizmadzhev 1974), etc. A more appropriate method wasbased on studying channel permeability to radio-actively labelled nonelectrolytemolecules (Holz and Finkelstein 1970). T h e method however was time consumingand too laborious.In the present paper, we show the results of a systematic study of conductivity and viscosity of KC1 solutions in the presence of different nonelectrolytes,as well as of ion channel conductance at the same conditions. These studies haveoffered the background for a new m e t h o d for the determination of effective radiusof water pores. T h e results of the first testing of this m e t h o d were published earlier(Krasilnikov et al. 1988a,b; Krasilnikov and Sabirov 1989a). The method uses onlyelectrical measurements of ion channel conductance. In addition, a test could bedeveloped to select among the different mechanism of ion transport through thechannels.Materials and M e t h o d sStaphylococcus aureus alpha-toxin (ST) was a kind gift from Dr. K. D. Hungerer (Behringwerke Laboratories, Marburg, FRG).N-terminal fragment of ST (F) was obtained by weak tryptic digestion with subsequent purification using preparative isoelectric focusing. Its isoelectric point was 8.4 0.2.It could be shown by SDS-polyacrylamide gel electrophoresis that F contained only oneband of a molecular mass (m.m.) of 16 2 kD (Ternovsky et al. 1991).Black widow spider venom was extracted from the glands of spider Latrodectus tredecimguttatus with 100 mmol/1 KC1 solution. pH 7.5. Alpha-latrotoxin was purified onMono-Q-column by FPLC -system (Pharmacia) as described earlier (Krasilnikov et al.1988a).TLC-pure phosphatidylcholine and phosphatidylserine were obtained from fresh heneggs and ox brain, respectively, according to the method described by Bergelson et al.(1981). Cholesterol was obtained from Sigma Laboratories (Munich, FRG). Polyethylene glycols with average molecular weights (M r ): 300 (Koch-Light); 400 and 20,000(Schuchardt, Munich) 1000 (Austranal-Preparate); 1500; 2000; 3000; 4000 and 6000 (Loba
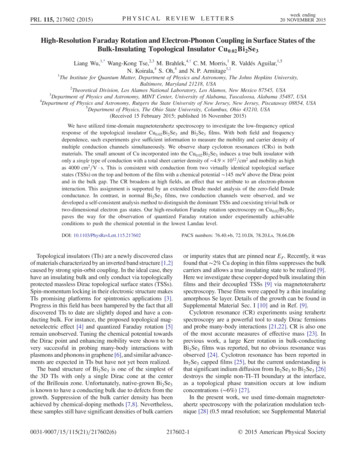
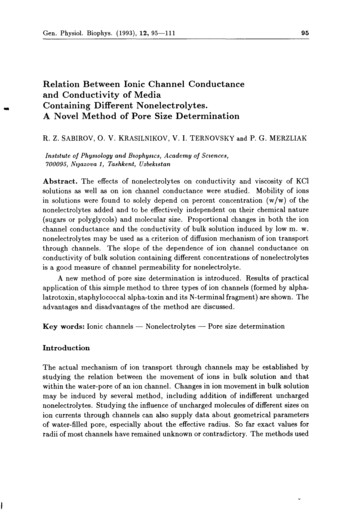
Channel Conductance and Media Conductivity97Chémie) were used.Planar phospholipid bilayer membranes (BLM) were prepared by opposing two mono layers on a Teflon septum with an aperture, approx. 0.7 mm in diameter, separatingtwo buffered salt solutions (Montal and Mueller 1972) or alternatively by the method ofMueller et al. (1963) using 2-4% (w/v) lipid solution in n-octane.Electrical measurements were performed under voltage clamp conditions. Currentsthrough BLM were measured with Ag/AgCl electrodes connected in series with a volt age source and a current amplifier. The amplified signal was monitored on a storageoscilloscope and simultaneously recorded on chart paper or using a tape recorder. Thecompartment connected to virtual ground will be termed the "trans" compartment. Thechannel-forming proteins were added from a stock aqueous solutions to trans-compartmentonly to final concentrations sufficient to form single channels in BLM. The addition wasfollowed by vigourous mixing of the solution using magnetic bars.The following notation has been used with latrotoxin (LT) induced channels phosphatidylserine BLM: type 1, channels formed by fresh venom of L. tredecimguttatus ob tained by extraction of the poison gland with 100 mmol/1 KC1 solution, pH 7.5. Theaverage conductance (G) of these channels was 120 8 pS; type 2, channels (G 415 2 0pS) induced by the venom which had been preliminarily extracted from the gland by 10mmol/1 Tris-HCl buffer, (pH 8.0) and dried; types 3 and 4, channels (G 565 25 pS andG 1110 40 pS) induced by pure alpha-latrotoxin subjected to freeze-thaw proceduretwo times. Other details were described earlier (Krasilnikov et al. 1988a; Krasilnikov andSabirov 1989a).The viscosity of water solutions was determined using a glass capillary viscosimeter.The intrinsic viscosity ([»/], ml/g) was obtained from the relation between viscosity ofsolution (cP; I P O.lPa.s) and the nonelectrolyte concentration (g/100 ml of solution).Hydrodynamic radii (r , Á) of nonelectrolytes were calculated by the following equations:ľ3Vj1/3Th L 4x Jfli' 1000 23.5J?ON where V is the volume of molecule, cm 3 ; r?0 is the viscosity of the solvent, cP; NA isthe Avogadro's number; B\ is the slope of the viscosity vs. nonelectrolyte concentra tion (mol/1) dependence. Conductivity of the solutions was measured by a Radelkis OK102/1 conductivity meter. The cation transference number (i ) was calculated from zerocurrent potential in the presence of a KC1 concentration gradient (40/120 mmol/1). Allexperiments were performed at 25 1 C.Results1. Nonelectrolytes1.1 Conductivityin waterof KCl solutionssolutionin the presenceofnonelectrolytesUpon the addition of various nonelectrolytes (ethyleneglycol, glycerine, some su gars, polyethylene glycols), t o 100 mmol/1 KCl solution, a strong decrease of con ductivity of t h e initial solution was observed.An analysis of the d a t a (Fig. 1)showed t h a t t h e decrease in conductivity was determined by nonelectrolyte con centration (C,%) only.However these functions were independent on molecular
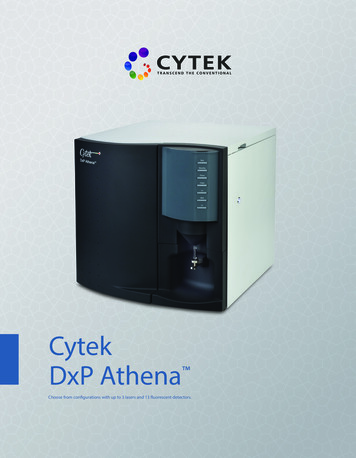
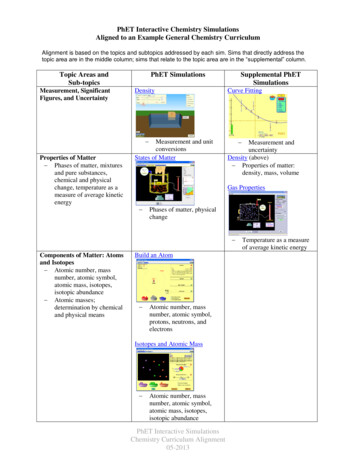
Sabirov et al.98F i g u r e 1. The effects of different nonelectrolytes on 100 mmol/1KCl solution conductivity. Symbolsused: O - ethyleneglycol; 9 - glycerine; - glucose; A - sucrose; PEG 300; D - PEG 1000; - PEG1500; 0 - PEG 2000; - PEG 3000; - PEG 4000; - PEG 6000; * PEG 20,000.1020CONCENTRATION (%)30weight a n d / o r size of the nonelectrolyte molecules. T h e chemical nature of nonelectrolyte had a slight effect on the nonelectrolyte concentration (w/w) conductivity relation. Hydroxyl-containing substances (ethyleneglycol, glycerine, glucose,sucrose) decreased the conductivity less t h a n did P E G s . T h e relationship betweenthe conductivity of 100 mmol/1 KCl solution (K, o h m 1 m - 1 ) and C for these twogroups of nonelectrolytes may be expressed by the following equations:KOH (1-259 0.006) - (0.0204 0.0004) x C(1)KPEG (1-236 0.009) - (0.0263 0.0005) x C(2)1.2 Viscosity of KCl solutionsm the presence ofnonelectrolytesAccording to the Stokes-Einstein law, the ion movement and the conductivity ofsolutions depend on the viscosity of media, which naturally increases in the presenceof nonelectrolytes (Fig. 2). However, a comparison of the experimental functionsa (C) and K (C) (Figs. 1 and 2) made us to conclude t h a t macroscopic viscosityof a solution does not play a major role in the change of ion movement. T h i s isparticularly clear from Fig. 3.To understand the mechanism by which nonelectrolytes influence conductivityof salt solutions, d a t a concerning macromolecule states and about their forms in thesolution are necessary. These d a t a can be obtained from viscosimetric experiments.T h e increase in intrinsic viscosity of P E G solution (Fig. 2) was shown to followthe classical relation:[rj\ K M?(3)
Channel Conductance and Media Conductivity99log 0 )oí.-0.56 0.03log M r50.oOi 3 1"T—10—i2030CONCENTRATION (%)F i g u r e 2. The dependence of 100 mmol/1 KCl solution viscosity on the concentration ofdissolved nonelectrolyte. The insert illustrates the intrinsic viscosity of PEG solution independence on nonelectrolyte m.w. in double logarithmic scale. For symbols see legendto Fig. 1.VISCOSITY ( c PF i g u r e 3 . The dependence of conductivity of 100 mmol/1 KCL solution containingdifferent nonelectrolytes on the viscosity of the resulting solutions. For symbols see legendto Fig. 1.
Sabirov et al.100where K is the coefficient of proportionality; and a is the parameter reflecting thegeometry of the polymer molecule in solution.According to the value of this p a r a m e t e r (0.56 0 . 0 3 ) , the P E G molecules areapproximately spherical in salt solutions (Marshall 1981).T a b l e 1. The size of nonelectrolyte molecules eglycolGlycerineGlucoseSucrosePEG 300PEG 400PEG 1000PEG 1500PEG 2000PEG 3000PEG 4000PEG 6000PEG 20,000Th2.62 0.033.08 0.023.70 0.104.67 0.056.0 0 . 27.0 0 . 39.4 0 . 310.5 0 . 112.2 0 . 114.4 0 . 419.2 0 . 325.0 0 . 351.0 0 . 2.933.215.718.4021.3rh. is the hydrodynamic radius determined by capillar viscosimeter, see Methods; rs-G,data for hydrodynamic radii as reported by Scherrer and Gerhardt (1971); TM-F statistical radii of hydration according to Mark and Flory (from Scherrer and Gerhardt 1971);TCr, the crystal radii calculated as:rcr [3Mr/4áNA]1/3where Mr is molecular weight, d is the density of the nonelectrolyte (g/cm 3 ) and NA Avogadro's number; 14 and VCT the hydrodynamic and the crystal volume of one mole ofnonelectrolyte.T h e viscosimetric investigations allowed us to calculate both the equivalenthydrodynamic radii of nonelectrolytes a n d the value of their molar volume in solution. Our results are given in Table 1 together with d a t a published by other authors(Scherrer and Gerhardt 1971). We could establish that the hydrodynamic radii ofP E G (rh) showed a hyperbolic nonlinear dependence on the molecular weight ofthe polymer. This dependence can be expressed as:rh 5.08 3.7 1 0 3 M r - 7.03 1 0 8 M ?(4)T h e average deviation of experimentally obtained d a t a from the theoretical curvewas approx. 0.65 A-
Channel Conductance and Media Conductivity1.3 Accessibilityof polymermolecules to dissolved101ionsA priori, several relations could be expected to exist between ions and polymermolecules in water solution. These possibilities included the whole volume of hydrated polymer being inaccessible to ions, or ions being able to reach the entirevolume (except the volume of the linear polymer molecule itself) of water of thehydrated polymer or its part. The real situation can be established by measuringthe respective ion concentration in polymer-free bulk solution. Three methods wereused to approach this problem. First, polymer was separated from salt solution byultrafiltration with subsequent determination of ion concentration in polymer-freesolution. Then, the ion concentration in polymer-salt solution was determined using K-selective electrode and two standard additions of stock KCl solutions aliquots.Also, alpha-staphylotoxin modified BLM was used. In this case, BLM separatedtwo KCl solutions, one of them additionally containing some amount of P E G . Thedifference in KCl concentrations between these two solutions was determined asan additional concentration of KCl t h a t had to be added into the polymer-freesolution to obtain zero trans-membrane potential.All the d a t a obtained suggested t h a t the ion concentration in 20% P E G (200020,000) solution really was approximately 30% higher t h a n that calculated basedon the entire volume of the solution.Obviously, a p a r t of solution volume is occupied by the nonelectrolyte molecules. The crystal volume of P E G is known to be independent on the molecularweight of polymers, and occupies 16% of volume (d 1.28 0 . 0 3 g / c m 3 ) in 20%solution. As a result, the ion concentrations in polymer-free solution is expectedto increase by up to 19%. This value is smaller than the experimentally obtainedion concentration in polymer-free solution, the difference being only 10%. Thisresult was independent on Mr of P E G s , although the portion of volume filled byhydrated polymer rose continuously along with the increasing molecular weight ofP E G , reaching e.g. 42% for 20% solution of P E G 1000 and 90% for 20% P E G4000. Therefore, the ion concentration of both the water phase of the hydratedP E G molecule and the inter-polymer solution were effectively identical. This allowsthe suggestion t h a t almost the entire water phase of P E G molecules is accessibleto ions. Actually, in similar condition the P E G molecule resembles a porous spherefilled with the water-KCl solution.This result explained well the independence of the p o l y m e r - KCl solution conductivity on the nonelectrolyte molecule size in the presence of standard polymerconcentrations (%). Probably, the ion mobility was influenced by microviscosity ofthe environment (affected by hydration of monomeric chain of polyglycols) muchmore than by macroviscosity which depends on the configuration of the polymerchain. Thus, the ion movement in the polymer solutions was not determined bymacromolecules as distinct particles. This conclusion agrees with d a t a obtained by
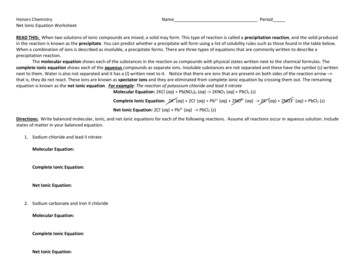
Sabirov et al.102Toryanic (1987). He showed that the self-diffusing coefficient of water molecules inPEG-solutions was a function of the polymer concentration and temperature, butnot of PEG molecular mass.Thus, the spherical shape of PEG molecules in water solutions and the independence of ions movement on the polymer chain size makes PEG molecules auseful tool for studying mechanisms of ion movement through ion channels and fordetermination of effective radii of the water pores.2. Effectsof nonelectrolyteson ionic currentthrough singlechannelsThree types of ion channels were used in the present experiments. It could beestablished that: (i) the proportionate change in both the ion channel conductanceand the conductivity of bulk solution induced by low m.w. nonelectrolytes canbe employed as a criterion of the diffusion mechanism of ion transport throughchannels; (ii) the slope of ion channel conductance vs. conductivity curve for bulksolutions containing different concentrations of nonelectrolytes is a good measureof channel permeability for the nonelectrolyte; (iii) the hydrodynamic radius of anonelectrolyte molecule located in transition zone (between limited nonelectrolytepermeation and impermeability) can be taken as the effective radius of the ionchannel water pore.2.1 The anion selective channel induced by S. aureus alpha-toxin (ST)ST is a toxic protein with m.m. 33 kD and pi 8.4. It has several kinds of biologicalactivity (Thelestam and Blomquist 1988). All the effects of ST are connected withits ability to form ion channels in lipid matrix of plasma membranes. ST alsoinduces the trans-membrane channels in BLM. The maximum of the conductancedistribution of these channels was reported to be approx. 100 4 pS (100 mmol/1KCl, pH 7.5). The cation transference number was 0.26 0 . 2 (Krasilnikov et al.1981; Krasilnikov and Sabirov 1989b; Menestrina 1986).It was established that nonelectrolytes with small hydrodynamic radii changedthe conductance of ion channels stronglier than did molecules with large radii. Theefficiency of the influence was proportional to the percent concentration.With ethylene glycol concentration in BLM bathing solution raising from 10%to 30%, the conductance of single ST-channels decreased linearly in parallel to thechange in conductivity of 100 mmol/1 KCl solution (Fig. 1). The effect of 20%ethyleneglycol on conductance of ST-channels is shown in Fig. 4. Similar resultswere obtained with other low m.w. nonelectrolytes such as glycerin, glucose orsucrose. It should be noted that the molecules of all the nonelectrolytes testedhad small hydrodynamic radii. The plots of single channel conductance againstconductivity of bulk solution containing the nonelectrolyte are clearly linear andsimilar (Fig. 5). In characterizing the effects of nonelectrolytes on the conductance
Channel Conductance and Media Conductivity1030.20.1-„Tin nJLCONDUCTANCE (pS)F i g u r e 4. Amplitude histogram of conductance fluctuations of voltage-clamped (50 mV)phosphatidylcholine-cholesterol (3:1, w:w) membranes in basic solution (100 mmol/1 KCl,5 mmol/1 Tris-citric acid buffer, pH 7.5) (A), in basic solution plus 20% ethyleneglycol(B), or 20% PEG 4000 (G). Original single channel recordings under the correspondingconditions are shown on the right. The line 1 0 indicates zero current.of ion channel (G) it is convenient to use parameter v, defined as follow:v dG/d«; : GO/KQ(5)where dG/d/c is the slope of the dependence of G on conductivity of KCl solutions(K) upon the addition of different concentrations of each distinct nonelectrolyte;Go and «o are the ion channel conductance and the conductivity of bulk solutionin absence of nonelectrolytes.For the solutions of low molecular weight nonelectrolytes the numerical value ofv was close to unity. It follows t h a t the ion channel conductance changed in parallelwith the conductivity of bulk solution. Two conclusions can be drawn from this.First, the nonelectrolytes tested permeate easily through ST-channel. Secondly,the mechanism underlying the ion transport through S T channel is free diffusion,since ion movements b o t h in water pore and in bulk solution were identical.P E G with higher m.w. (300 - 2000) decreased the slope of the dependence ofG on /c to zero. W i t h P E G s of m.w. equal to or exceeding 3000 slightly negativevalues were obtained (Fig. 5).
Sabirov et al104F i g u r e 5. Single-channel conductanceof ST channel as a function of electricalconductivity of bulk solution containingdifferent nonelectrolytes For conditionssee Figure 4 Symbol X stands for me dia without any nonelectrolytes Othersymbols as Figure 10510151CONDUCTIVITY ( ohm m 1)T h e samples ofand t h e distributionFig 4 In presencelarger t h a n in pureconductivity of bulk(Fig 1)ST-induced current steps in presence of some nonelectrolytesof conductance a m p l i t u d e s of these ST channels are shown inof P E G 4000, current through a single channel was actuallywater-salt solutionMoreover, it should be noted t h a t thesolution was considerably lower t h a n t h a t of pure KCl solutionT h e following explanation can be offered for the effects obtained When thesize of the nonelectrolyte approaches the size of the channel water pore the frictionbetween the pore wall and the nonelectrolyte molecules passing through the channelbecomes significant This will decrease the effective nonelectrolyte concentrationinside the channel and, correspondingly, increase both the ion mobility withm thepore and the channel conductance As soon as the hydrodynamic radii of the non electrolyte molecules exceed the size of t h e channel water pore the composition ofthe solution inside the pore will be identical with that of the nonelectrolyte-free partof t h e bulk solution Thus, a situation occurs in the water pore of the ion channelsimilar to that with the bulk solution containing no nonelectrolyte However, thechannel conductance may be somewhat larger than that of nonelectrolyte-free so lution because the activity of ions in nonelectrolyte-contammg solutions was larger(by 30% in 20% solutions of P E G s , as shown in part 1) Due to this the slope ofthe dependence of G on h may become negative when the bulk solution containsimpermeable nonelectrolytes This was actually observed (Fig 5) This d a t a ana lysis allowed the suggestion t h a t the numeric value of the slope can be used as thechannel permeability criterion for each distinct nonelectrolyteT h e n the three different parts of real function of v on the hydrodynamicradii of nonelectrolyte ľ l , 0 f l and v 0) will correspond to three
105Channel Conductance and Media Conductivity1.00.5a.W o.oui DC -i111rDQ.1.00.5á L0.0-0.5I10-—rI1020HYDRODYNAMIC RADII (Á)— I —20Figure 6. Values of parameter v for some channels, as a function of the hydrodynamicradii of nonelectrolytes. The basic solution contained 100 mmol/1 KCl, 5 mmol/1 Triscitric buffer. A) ST channels: O - pH 7.5, data presented on Fig. 4 were used; A pH 6.0, v was determined by rapid method, membranes were formed of phosphatidylcholinexholesterol mixture (1:1; w:w) by method of Montal and Mueller (1972). B) LTchannels G170 (A) and G75 (o) induced by fresh venom; BLM was formed according toMueller et al. (1963) using a 4% solution of phosphatidylcholinexholesterol mixture (3:1;w:w) in n-octane. Data taken from Fig. 7. C) ST (o) and F channels (A); pH 7.5. Themembranes were formed using a 4% solution of phosphatidylcholinexholesterol mixture(4:1; w:w) in n-octane. and - the cation transference number for these channelsrespectively (left scale). Parameter v for F channels was calculated by rapid method. D)LT channels in phosphatidylserine membranes formed according to Mueller et al. (1963).For pH and KCl concentration see Methods. Symbol O, , A and indicate channeltype 1, type 2, type 3 and 4 (see in Methods). Parameter v was calculated by the rapidmethod.types of channel permeability t o nonelectrolytes: high, limited and no permeability.Thus, the effective radius of a water pore m a y be determined as a minimal sizeof an impermeable nonelectrolyte molecule, i.e. t h e transition zone from limitedpermeation of a nonelectrolyte to
The actual mechanism of ion transport through channels may be established by studying the relation between the movement of ions in bulk solution and that within the water-pore of an ion channel. Changes in ion movement in bulk solution may be induced by several method, including addition of indifferent uncharged nonelectrolytes.