Transcription
Discrete Element Study Mixing in an Industrial Sized MixerAkash Gupta(1,2,4), André Katterfeld(2), Bastiaan Soeteman(3), Stefan Luding(4)(1) Indian Institute of Technology, Kanpur (IITK), India(2) Institute of Materials Handling, University of Magdeburg, Germany(3) Lindor, Netherlands(4) Multi Scale Mechanics, University of Twente, NetherlandsAbstractThe mixing quality as function of the operating time is one major parameter to beconsidered for the design of industrial sized mixers. Different mixer types with differentoperating principles can be found for different special tasks, and the question about theproper quantity that quantifies mixing is still open.Computer simulations based on the Discrete Element Method (DEM) provide a close,detailed look inside the mixing device and process and thus a better understanding of theparticle flow in the mixer. Therefore such simulations can be used for an improvement ofthe mixer design or operating conditions.DEM simulations allow the “online”- and “inline”-measurement of the mixing qualityover time. But in mixers with a complex design it is not only interesting at which time acertain mixing quality is reached. It is also interesting to analyse which part of the mixing(either location in the device or process conditions) are of special importance due to astrong effect on the mixing process.Therefore, a time- and space-dependent analysis was developed, using several approachesfor mixing-quality that can be found in literature. More explicitly, the particle numbers,the number of contacts between different particle-types, and the generalized mean mixingindex (GMMI) have been examined. All have their regimes of reasonable use that will bediscussed - the most promising approaches will be compared.1IntroductionThe mixing of particles is an important process in chemical, food and process engineering,needed to reach a certain product quality. A lot of mixing technologies exist for differentpurposes. In contrast to relatively simple mixing principles like stirring, which are widelyused on a laboratory scale, industrial mixers often posses a complex shape – of the mixeritself or of its components – and a usually simple kinematics of the moving parts (e.g.rotation around one axis). For the optimisation of design and operational parameters andfor the adaption of the mixer parts to different bulk solid properties, expensiveexperimental tests are usually necessary. Unfortunately, it is often difficult to observewhat is really going on in the experiments, because a direct analysis of the particlebehaviour is not possible.Discrete element simulations offer the possibility of such a direct analysis of the particlemotion and their interactions with the mixer parts. A lot of work already has been doneconcerning the application and verification of mixer simulations, mainly on a small
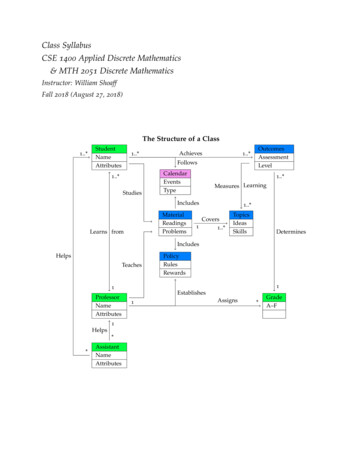
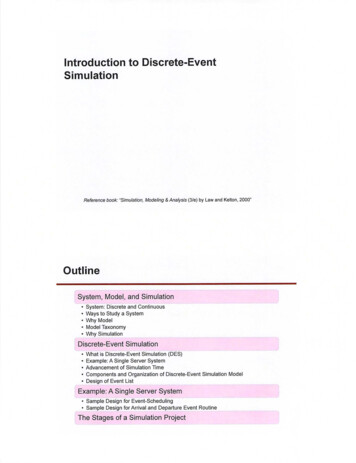
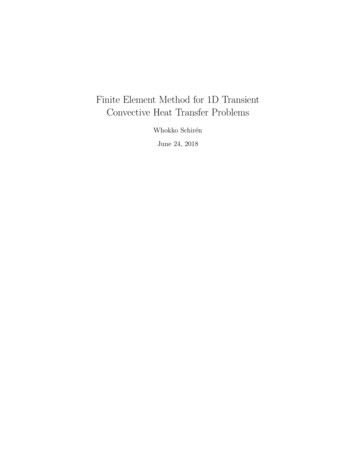
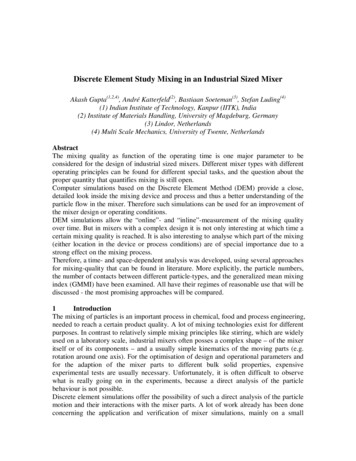
laboratory scale [1,2]. Increasing computational power and idealised simulation modelsallow also the simulation of large scale industrial mixers like the Lindor mixer shown inFig. 1.Fig. 1: 3d-CAD model of an industrial mixer from Lindor [3]After the serial filling of the mixer (at rest) with the bulk material, using the axial inletopening, the drum and the blades rotate with low rotation speed (typical 10-20 rpm) andmix the material. Depending on the size of the drum – mixers for 10 – 25,000 litres areavailable – good mixing can be achieved for small amounts of precious materials or forlarge, industrial scale amounts of bulk materials, in a fast and gentle mixing procedurethat characterises the Lindor mixer [3].The picture sequence from a DEM simulation, as shown in Fig. 2, gives an idea how abinary particle system with different particle sizes behaves in the Lindor mixer duringstart up (steady state and the discharge of the material is not shown).Fig. 2: Picture sequence from a DEM simulation with 10 rpm, rotation is clockwise, of abinary distributed particle system in a Lindor mixer (left) after filling, just beforerotation starts, (middle) after the first blade has moved 1/3, i.e., half-way up, and(right) after the first blade has moved 2/3 around.
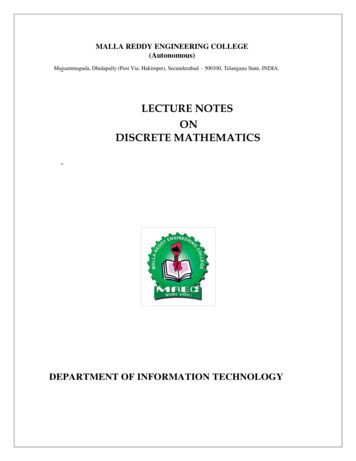
2Analysing the mixing qualityFor the optimisation of the design and operational parameters it is necessary to evaluatethe mixing quality dependent on time and ideally also as function of space. Differentapproaches can be used for such an analysis.2.1Contact number calculationOne of the easiest ways to characterise the mixing quality (from DEM data) is to countthe number of contacts between the two bulk materials, in this case between small (bluein Fig. 2) and large (red) particles. The ratio of the small-large contact number Csl and thetotal contact number Ctotal can be used for characterising the mixing quality, called q1:(1)Bad mixing corresponds to small values of q1, (artificial) optimal mixing wouldcorrespond to unity and good mixing is indicated by values between 0.2 and 0.5 already.Counting the numbers of contacts is better/easier than using statistical analysis variance,standard deviation or statistical entropy [4]. While the time dependency of the mixingquality can be well observed calculating q1 for all particles, see Fig. 3 (left), it is notpossible, however, to understand the spatial dependency with a single q1 value. For this,the whole model has to be divided in cells and the q1 value has to be calculated in eachcell. Only a picture sequence or a video can show where and when the highest mixingrates occur in the model, see Fig. 3 (right), which cannot be shown here.The cumulative analysis of q1, that means the calculation of the sum of the q1 values foreach cell during the simulation, allows a much easier prediction of the zones with highestmixing rates, but it can also lead to misinterpretations and should only be used togetherwith the analysis of the general particle flow.Fig. 3: (Left) Mixing quality (global) in the mixer plotted against time. (Right) Spatialdependency of the mixing quality at simulation time 10.18s. The mixing qualityq1 is calculated for each cell represented by a single particle. The colour coderepresents the mixing quality q1: 01.2.2Generalized Mean Mixing Index (GMMI)Although the local quality of mixing cannot be rigorously described by a single number,a simple number description would be very helpful for many practical reasons. For thisreason, the General Mean Mixing Index GMMI introduced in [5] is applied, as analternative, for further analysis. The GMMI has several advantages over statistical
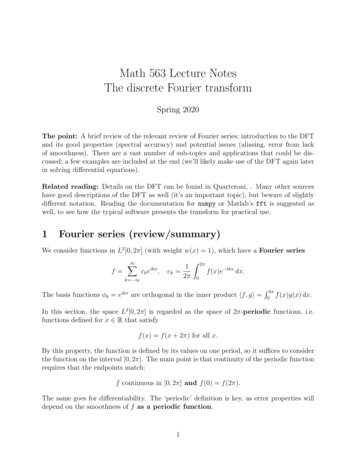
methods like Lacey index, Anova, Manova, etc. The primary advantage is that a samplingis not required in this method.(2)Where, GMMIxi , GMMIyi and GMMIzi are the Generalized Mean Mixing Indices in x, y,z coordinates, respectively. For example, GMMIzi is simply the mean of the z-coordinateof particle centre of type i divided by the mean of the z-coordinate of all particles. It iscalculated as follows(3)Where n is the number of particles of type i, N is the total number of particles, z is the zcoordinate of the position of the particle centre and zref is the reference z-coordinate. Thus,z-mean is calculated relative to a reference z-coordinate such as the centre of the system.GMMIxi and GMMIyi are calculated similarly.Similar to the spatial q1 calculation, the whole model has to be divided in cells. In thiscase however, the mixing index is not objective, i.e., the choice of the reference point isessential for a reasonable analysis.Fig. 4: (Left) Average GMMI value of all cells with the reference point at the bottom ofthe mixer. (Right) Average GMMI and directed GMMIs of all cells with thereference point at the centre of each cell.Fig. 4 shows the difference between the average GMMI values of all cells, dependent onthe chosen reference point. The left diagram in Fig. 4 shows large fluctuation of theGMMI value, whereas the right shows the improvement of mixing (approach to unity)basically. The continuous improvement of the mixing quality, up to 15 seconds, which isshown in Fig. 3 (left) can not be seen here in Fig. 4. In the left panel, there is no changeof mixing quality visible at all, while in the right, the change vanishes around 10 secondsalready.When a single cell is considered, a certain correlation between q1 and GMMI can berecognised, as displayed in Fig. 5.
Fig. 5: Comparison between q1 and GMMI mixing indices for a single cell at the bottomof the mixer. The zero values correspond to the times when the cell is empty.Although the GMMI may be a good analysing method for certain mixing processes, itshows for the Lindor mixer only locally some basic correlation with the observed particlebehaviour and with the calculated q1 values. In contrast, the q1 number already gives aglobal quantitative information on the mixing quality.3ConclusionsDEM simulations are a universal tool for the analysis of particle systems and processes.Industrial sized mixers can be simulated considering the real geometry and motion of themixer, using idealised particle properties, if necessary. The calculation of the fraction ofinter-species contact numbers, the q1 value, is a promising method for the evaluation ofthe global and the local mixing quality. The calculation of the GMMI values results in noadditional benefit for the examined problem.Additional simulations (data not shown) indicate that modifications in rotation rate, mixergeometry or material parameters (like for example the friction coefficient) affect themixing behaviour. A more detailed analysis of these dependencies, in the future, willallow to identify the most important system parameters and, eventually, to propose animproved design for the mixing device.References[1] M. Nakagawa and S. Luding, Powders and Grains 2009, American Institute ofPhysics, 2009, AIP Conference Proceedings #1145.[2] Conference Proceedings of the 5th World Congress on Particle Technology 2006Florida, 12 pages, CD-Proceedings, ISBN 0-8169-1005-7, AIChE.[3] Homepage of Lindor Products B.V., Netherlands: www.lindor.nl[4] D. R. van Puyvelde: Comparison of discrete elemental modelling to experimentaldata regarding mixing of solids in the transverse direction of a rotating kiln. In:Chem. Eng. Sci. 61(13), July 2006, Pages 4462-4465[5] B. N. Asmar, P. A. Langston; A. J. Matchett: A generalised mixing index in distinctelement method simulation of vibrated particulate beds. Granular Matter 4/3, 129-138,2002
The mixing of particles is an important process in chemical, food and process engineering, . correspond to unity and good mixing is indicated by values between 0.2 and 0.5 already. . standard deviation or statistical entropy [4]. While the time dependency of the mixing quality can be well observed calculating q 1 for all particles, see Fig .