Transcription
2019 SENDER SCOREBENCHMARK
TABLE OF CONTENTSPage 3IntroductionPage 4Percentage of Send Volume by Sender Score BandPage 5Average Complaint Rate by Sender Score BandPage 6Average Unkown User Rate by Sender Score BandPage 7Average Spam Trap Count by Sender Score BandPage 8Average Delivered Rate by Sender Score BandPages 9-10Inbox Placement Rate by Sender Score at the Top Four Mailbox ProvidersPage 11Average Sender Score and Inbox Placement Rate by IndustryPage 12Building and Maintaining a Strong ReputationPage 13Methodology 2019 Return Path, Inc. All Rights Reserved. Return Path, and the Return Path logo are registered trademarks of Return Path, Inc.These materials may not be reproduced or distributed in any way without the written permission of Return Path, Inc.2019 Sender Score Benchmark2returnpath.com
INTRODUCTIONReaching the inbox is always a challenge. While marketers might feel that mailboxproviders are being unreasonably strict, there is a reason for this. There is a lot of bademail being sent. Last year alone saw over 600 billion emails from spammers.Mailbox providers have these strict protocols in place not to block legitimate senders,but to keep spammers and harmful content out of their users’ inboxes. To identify the“good” from the “bad,” mailbox providers judge an incoming sender’s reputation whendetermining what email to allow or block from their inboxes. A sender’s reputation iscalculated using a variety of metrics, and each mailbox provider has its own formula tojudge whether or not to accept incoming mail and where to filter it.Marketers who are aiming for the inbox use Return Path’s Sender Score to discover andtrack their sender reputation and learn how mailbox providers perceive their messages.Similar to a credit score, Sender Score is an evaluation of your sending practicescompared to other senders to determine the quality of your messages and your emailprogram. A marketer’s Sender Score is expressed as a number between 0 and 100. SenderScore uses data points and reputation formulas similar to what mailbox providers use togive a relatively accurate representation of how mailbox providers view your email.In this report, we will discuss some of the factors that go into both Sender Score andmailbox providers’ reputation calculations. In addition, we’ll take a look at the impactthese elements on your sending reputation, and how your reputation affects yourdeliverability.To get the most out of this report, look up your Sender Score and use it to understandhow mailbox providers are viewing your program.2019 Sender Score Benchmark3returnpath.com
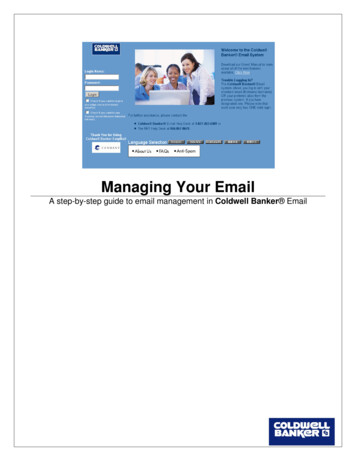
THE STATE OF EMAIL REPUTATIONThe quality of email programs has improved dramatically since our first Sender Score Benchmark in 2012when botnets ruled and spammed the world. At that time, a staggering 60 percent of messages sent camefrom IP addresses with a Sender Score below 11. Today, only 16 percent of email scored below 11. While thedrop in spam over the last eight years can mostly be attributed to the takedown of botnets, email marketersare also more aware of reputational risks and have more tools and solutions at their disposal to monitorand solve reputation issues.PERCENTAGE OF SEND VOLUMEBY SENDER SCORE BAND2018 Send Volume BreakdownPERCENTAGE OF TOTAL VOLUME R SCORE BAND2019 Sender Score Benchmark4returnpath.com
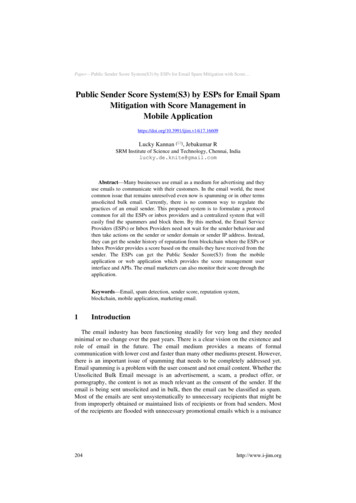
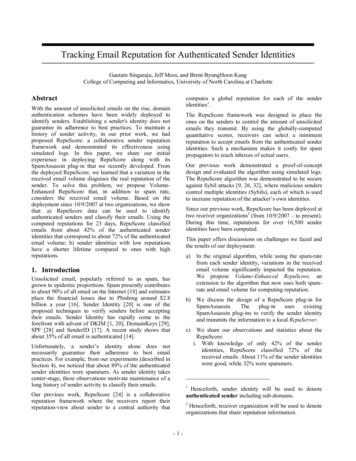
METRICS THAT INFLUENCE SENDER REPUTATIONWhile each mailbox provider has its own formula which assigns different weights and values to variouscomponents of sender reputation, the factors they include are generally the same. Three key metrics thatfactor into sender reputation are complaint rate, unknown user rate, and spam trap count.These metrics are included in reputation calculations because they provide insight into a sender’s mailingpractices. Those with low complaint and unknown rates and few spam trap hits are seen as reputable sendersand receive a higher reputation score. As a result, inbox placement tends to be higher for these senders.COMPLAINTSSenders with a Sender Score above 90 werethe only ones who managed to maintain acomplaint rate below one percent. Thosewith a Sender Score between zero to 90 hada sharp increase in average complaint rate,ranging from 4.6 percent to 6.3 percent.Average complaint rates more than doubledfrom last year for senders scoring between11 and 100.2019 Sender Score Benchmark2018 Average Complaint Rate2017 Average Complaint Rate8.0%6.3%6.3%COMPLAINT RATEA complaint is generated when a mailboxuser marks a message as junk or spam.A high complaint rate signals to mailboxproviders that users perceive the messageas spam or abuse, and helps the mailboxprovider to automatically detect similar spamor abuse messages in the future.AVERAGE COMPLAINT RATEBY SENDER SCORE 00SENDER SCORE BANDComplaints can originate from various sources for a variety of reasons.Read the Marketer’s Guide to Subscriber Complaints to understandwhere complaints are coming from and why.5returnpath.com
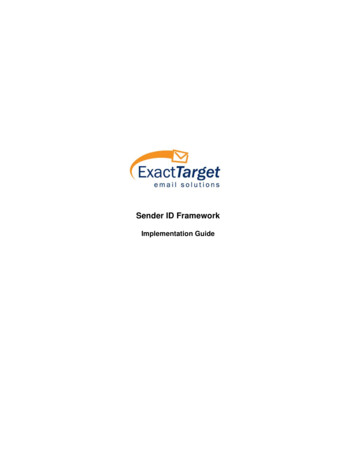
METRICS THAT INFLUENCE SENDER REPUTATIONcontinuedUNKNOWN USERSAVERAGE UNKNOWN USER RATEBY SENDER SCORE BAND2018 Average Unknown User Senders with Sender Scores above 90 tendto keep relatively clean lists, with averageunknown user rates of one percent. Thenext highest band (81-90) saw an averageof three percent, with the rest (zero-80)maintaining an average between six andeight percent.2017 Average Unknown User Rate10%AVERAGE UNKNOWN USER RATEAn unknown user is a type of bouncedmessage indicating that an email addressdoesn’t exist at the receiving mailboxprovider. Mailbox providers return a hardbounce code (5xx) indicating when emailis sent to an unknown user. Senders whonot only retain unknown users but send toa high percentage of them are perceived bymailbox providers as suspicious or havingpoor list hygiene practices. A high unknownuser rate can cause your messages to bethrottled, delivered to the spam folder, -8081-9091-100SENDER SCORE BANDIn most cases, marketers should immediately remove addresses that return a5xx hard bounce code. To learn about the different types of bounces and howto process them, read the Email Marketer’s Guide to Bounce Processing.2019 Sender Score Benchmark6returnpath.com
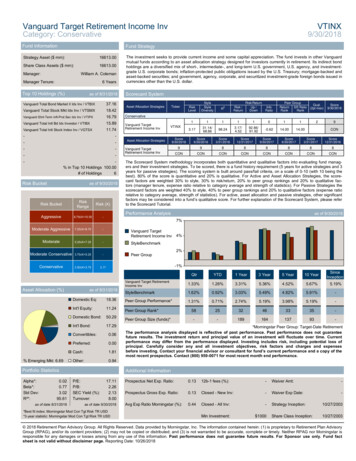
METRICS THAT INFLUENCE SENDER REPUTATIONcontinuedSPAM TRAPSSpam traps are decoy email addressesused to identify spammers. There are twotypes of spam traps:AVERAGE SPAM TRAP COUNTBY SENDER SCORE BAND2018 Average Spam Trap Count Pristine spam traps are decoyaccounts that aren’t ownedby a real person and thereforenever subscribe to mailing lists.Mail received at these accountsindicates the email address wasacquired without permission, andmay also indicate it was acquiredthrough illegal methods such asharvesting.Recycled traps are addresses thatwere once held by a user, but havebeen abandoned and converted2017 Average Spam Trap Count8AVERAGE SPAM TRAP COUNT 1-9091-1000.9801-1011-2021-3031-4041-5071-80SENDER SCORE BANDinto spam traps.Senders with a Sender Score above 90were the most successful at keeping theirlists clean with an average of 0.41 spamtraps. Senders scoring 50 and below saw anaverage of around one or more spam traphits, with those scoring below 11 seeing anaverage of 3.09 spam traps.2019 Sender Score BenchmarkTo keep your program safe, make sure you understand the different types ofspam traps and how to identify and remove them. Also, consider investing ina list validation service to help you identify and remove traps on your list andavoid acquiring new ones.7returnpath.com
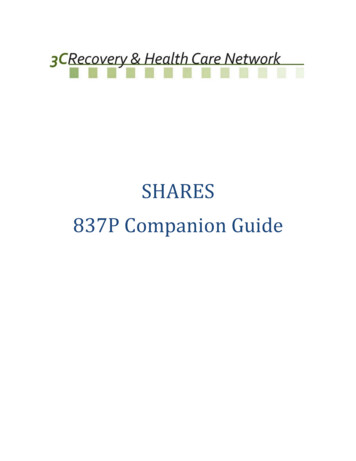
AVERAGE DELIVERED RATE BY SENDER SCORE BRANDIn 2018, senders scoring above 90 had anaverage delivered rate of 91 percent. Thosewho fell one band below (81-90) saw lessmail delivered, with an average of 71 percent.The remaining senders—those scoringbetween zero and 80—saw more than halfof their messages rejected at the gateway.Those scoring above 60 also saw a slightyear-over-year increase in delivered rates.2019 Sender Score BenchmarkAVERAGE DELIVERED RATEBY SENDER SCORE BAND2018 Average Delivered Rate2017 Average Delivered Rate100%91%71%75%DELIVERED RATEA sender’s delivered rate measures thepercentage of messages that aren’tbounced or rejected by mailbox providers’gateway filters. The delivered rate doesnot show which folder the messages werethen delivered to—primarily the inbox orthe spam folder—but it does factor out anymessages that have no hope of being seenby %8%31-4041-5051-6061-7071-8081-9091-100SENDER SCORE BAND8returnpath.com
INBOX PLACEMENT AT THE TOP FOUR MAILBOX PROVIDERSAs discussed previously, each mailboxprovider has its own unique formula forevaluating reputation. Although, thefactors that weigh into this analysisare generally the same. As a result ofthe different formulas, senders mayexperience different inbox placement ratesat different mailbox providers.INBOX PLACEMENT RATE BY SENDER SCOREAT TOP FOUR MAILBOX 41-5051-6061-7071-8081-9091-100SENDER SCORE BANDIn the graph on the right, you can see theimpact these different filtering formulashave on inbox placement rates at Gmail,Microsoft, Yahoo, and AOL. It’s worthnoting that each mailbox provider’s inboxacceptance generally increases with ahigher Sender Score and better sendingpractices.2019 Sender Score BenchmarkMicrosoft2018100%INBOX PLACEMENT RATEAfter passing the gateway (the deliveredrate shown on the previous page), emailsare then subjected to additional filters.These filters—including both reputationbased filtering and engagement-basedfiltering—determine which folder eachmessage is finally delivered to.9returnpath.com
INBOX PLACEMENT AT THE TOP FOUR MAILBOX PROVIDERScontinuedMicrosoft remained the hardest mailbox to reach in 2018 with even the best senders only reaching the inbox 72 percentof the time. Senders did see a slight increase in deliverability compared to the previous year with most bands seeing anincrease in inbox placement rates.Senders saw slightly higher inbox placement at Gmail, with the top senders managing an average inbox placement rateof 88 percent. Senders were more successful in reaching Gmail inboxes compared to the previous year, with increasesranging from seven to 27 percentage points.At Yahoo, the top senders had an average inbox placement rate of 88 percent. However, most senders found reachingYahoo inboxes harder compared to the prior year with decreases ranging between one and five percentage points.AOL remained the easiest mailbox provider to reach, with the best senders achieving an average of 93 percent inboxplacement--although deliverability at AOL changed dramatically year over the year. AOL, which was acquired by VerizonMedia Group, migrated its email filtering to Yahoo (also owned by Verizon Media Group) over the summer and fall of2018. With a new filtering system in place, inboxplacement rates at AOL decreased by four to 56INBOX PLACEMENT RATE BY SENDER SCOREpercentage points.AT TOP FOUR MAILBOX PROVIDERSThe chart on the right shows that senderreputation filtering is still important in spamfiltering algorithms. However, a high SenderScore on its own doesn’t translate to higherinbox placement rates. Subscriber engagement,a mailbox provider’s own reputation calculations,and the content in the incoming message—none of which are included in Sender Scorecalculations—all factor into each mailboxprovider’s final filtering determinations.2019 Sender Score BenchmarkSENDER SCOREBAND1-10AOL 201826%28%34%AOL 201775%83%84%Gmail 201826%41%46%Gmail 20178%18%Microsoft 201819%Microsoft 201717%Yahoo 2018Yahoo 91%returnpath.com
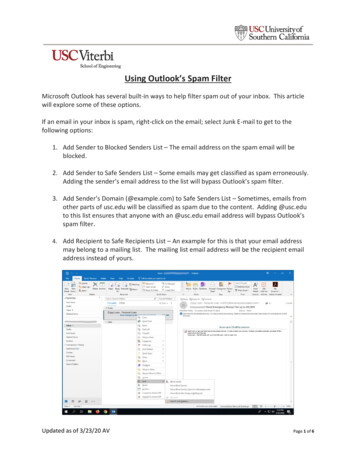
AVERAGE SENDER SCORE AND INBOX PLACEMENT RATE BY INDUSTRYTo help marketers evaluate their own email programagainst their peers, we dug into Sender Scoreperformance by industry. The chart on this page showsthe average Sender Score and inbox placement ratefor more than 17,000 commercial senders, broken outby industry. As only legitimate commercial senders areincluded, these numbers provide a relatively accuratereflection of how each industry is performing.AVERAGE SENDER SCORE ANDINBOX PLACEMENT RATE BY PPAREL & ACCESSORIES87%95950AUTOMOTIVE86%94940BANKING & FINANCE91%93921BUSINESS & MARKETING82%95932COMPUTERS & ELECTRONICS89%949402DEALS & REWARDS86%9694DISTRIBUTION & T81%939300FLOWERS & GIFTS83%9595FOOD & DRUG88%95941GENERAL MERCHANDISE91%95932HEALTH & BEAUTY81%8890-2HOUSEHOLD & HOME DS & BABIES86%95950MEDIA & ENTERTAINMENT85%92920OFFICE SUPPLIES87%93930PETS87%96942REAL ESTATE84%94931SERVICE89%94931SOCIAL & DATING83%95923SPORTING 9-5TRAVEL89%949312019 Sender Score BenchmarkIn 2018, most industries had average Sender Scoresabove 90, with deals and rewards, insurance, and petsachieving the highest average at 96. Telecommunicationcompanies struggled with reputation, posting the lowestaverage Sender Score at 76.Most industries saw either no change or a slight increasein average Sender Score year over year. Health & beauty,telecommunication, and toys/hobbies/gifts were theonly industries to have a decline in Sender Score, withtelecommunications seeing the greatest decrease of sixpoints.Find more information about how to reach inboxes atthe top mailbox providers in the Marketers Guide toGmail, Outlook.com, and Yahoo.11returnpath.com
BUILDING AND MAINTAINING A STRONG REPUTATIONAs you can see, your reputation is a strong factor in your ability to reach the inbox. However, many elements can cause yourreputation, and (as a result) your deliverability, to decline.To build and maintain a strong reputation, focus on the following:Keep your list cleanThe quality of your list is a big factor for your reputation. Make sure you are routinely checking your list forunengaged users who may be spam traps in disguise. Run your list through a list validation service to make sure allyour emails are owned by real people and check every new email you add to your list.Know all the blacklists and make sure you are not listedBlacklisting is another factor to mailbox providers filtering formulas and each mailbox provider uses different onesto different degrees. Make sure you know which blacklists are available and how to get delisted. And routinely checkthat your IP address is not listed anywhere.Sign up for feedback loopsFeedback loops help marketers identify when subscribers complain about their messages, allowing them to resolvethe complaint and avoid future ones from the same user. Most mailbox providers offer their own feedback loopservices. You can learn more about the different types of feedback loops and how to set them up here.Check Sender ScoreBefore you send a campaign, check your Sender Score. Your Sender Score can fluctuate based on the results of yourrecent activity. Rather than find out after you send your campaign that you have a problem, check your latestreputation score and resolve any issues. Once your Sender Score has improved, your messages are more likely toreach subscribers.2019 Sender Score Benchmark12returnpath.com
METHODOLOGYTo conduct this study, Return Path analyzed more than 4 trillion messages sent during 2018 from IP addresseswhose Sender Score was calculated, and whose subscriber engagement and inbox placement data were availablefor analysis. In addition to Sender Score data, this report used data from the Return Path Reputation Network totrack inbox placement rates across mailbox providers, and the Return Path Consumer Network to identify theSender Score and inbox placement rates of more than 17,000 commercial senders. Data used for this report isaggregated and anonymized, and is not limited to Return Path clients. Sender Score is a free reputation calculationservice and is available at senderscore.org.2019 Sender Score Benchmark13returnpath.com
LEARN MORE ABOUT RETURN PATHVisit our website. There’sno better place to find outabout Return Path! Browseour resource library, checkout our customer successstories, and learn more aboutour products and services atreturnpath.com.2019 Sender Score BenchmarkRequest a demo. SeeReturn Path’s data poweredsolutions in action. Visitreturnpath.com/request-ademo to get started.Browse our blog. Every day,we publish new content onthe topics that matter toemail marketers and securityprofessionals. Bookmarkblog.returnpath.com, orsubscribe to have freshcontent delivered straightto your inbox.14Or give us a call. Visitreturnpath.com to contactthe office in your region.US: 1-866-362-4577AUS: 61 2 8188 8700UK: 44 (0) 207 479 8800returnpath.com
2019 Sender Score Benchmark 2 returnpath.com TABLE OF CONTENTS Page 3 Introduction Page 4 Percentage of Send Volume by Sender Score Band Page 5 Average Complaint Rate by Sender Score Band Page 6 Average Unkown User Rate by Sender Score Band Page 7 Average Spam Trap Count by Sender Score Band Page 8 Average Delivered Rate by Sender Score Band Pages 9-10 Inbox Placement Rate by Sender Score at .