Transcription
VOLUME 141MONTHLY WEATHER REVIEWAUGUST 2013ANNUAL WEATHER SUMMARYAtlantic Hurricane Season of 2011*LIXION A. AVILA AND STACY R. STEWARTNOAA/NWS/NCEP/National Hurricane Center, Miami, Florida(Manuscript received 25 July 2012, in final form 16 January 2013)ABSTRACTThe 2011 Atlantic season was marked by above-average tropical cyclone activity with the formation of19 tropical storms. Seven of the storms became hurricanes and four became major hurricanes (category 3 orhigher on the Saffir–Simpson hurricane wind scale). The numbers of tropical storms and hurricanes wereabove the long-term averages of 12 named storms, 6 hurricanes, and 3 major hurricanes. Despite the high levelof activity, Irene was the only hurricane to hit land in 2011, striking both the Bahamas and the United States.Other storms, however, affected the United States, eastern Canada, Central America, eastern Mexico, andthe northeastern Caribbean Sea islands. The death toll from the 2011 Atlantic tropical cyclones is 80. NationalHurricane Center mean official track forecast errors in 2011 were smaller than the previous 5-yr means at allforecast times except 120 h. In addition, the official track forecast errors set records for accuracy at the 24-, 36-,48-, and 72-h forecast times. The mean intensity forecast errors in 2011 ranged from about 6 kt (;3 m s21) at12 h to about 17 kt (;9 m s21) at 72 and 120 h. These errors were below the 5-yr means at all forecast times.1. IntroductionTropical cyclone activity during the 2011 Atlanticseason (Fig. 1, Table 1) was well above average with theformation of 19 tropical storms—tying the 1995 and 2010seasons for the third-highest total on record behind 2005and 1933. Seven storms became hurricanes, and fourof the hurricanes became major hurricanes [maximum1-min winds of greater than 95 kt (1 kt 5 0.5144 m s21),corresponding to category 3 or higher on the Saffir–Simpson Hurricane Wind Scale (SSHWS; Saffir 1973;Simpson 1974; Schott et al. 2010)]. In addition, there wasone tropical depression that did not reach storm strength.The numbers of tropical storms, hurricanes, and majorhurricanes were above the long-term (1981–2010) averages of about 12, 6, and 3, respectively. In terms of accumulated cyclone energy [(ACE; Bell et al. 2000); thesum of the squares of the maximum wind speed at 6-h* Supplemental information related to this paper is available atthe Journals Online website: onding author address: Lixion Armando Avila, NOAA/National Hurricane Center, 11691 SW 17th St., Miami, FL 33165.E-mail: lixion.a.avila@noaa.govintervals for tropical (or subtropical) storms and hurricanes], activity in 2011 was about 137% of the long-term(1981–2010) median value of 92.4 3 104 kt2, the 11thbusiest year since 1981.The above-average activity observed in 2011 wasprimarily the result of two factors: above-normal seasurface temperatures (SSTs) and below-normal verticalwind shear prevailed across most of the tropical AtlanticOcean and Caribbean Sea for the peak months ofAugust–October (Fig. 2). Low vertical wind shear overthe tropical Atlantic generally coincides with the presence of a La Ni na event in the Pacific Ocean (Gray1984), and this was the case during 2011.Although some of the tropical cyclones originatedfrom frontal systems in the subtropics and moved generally northeastward over the Atlantic, most of themformed in the deep tropics, with four major hurricanesdeveloping from tropical waves. One group of tropicalcyclones formed in the western Caribbean Sea andmoved generally toward Central America and Mexico,steered by the flow around a ridge located across theU.S. southern Great Plains and the northwestern coastof the Gulf of Mexico. The other group of tropicalstorms formed over the central tropical Atlantic andrecurved over the western part of the basin. Thisresulted from a tendency for a midlatitude trough toDOI: 10.1175/MWR-D-12-00230.12577
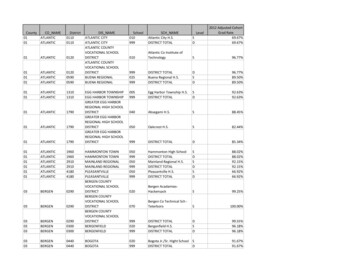
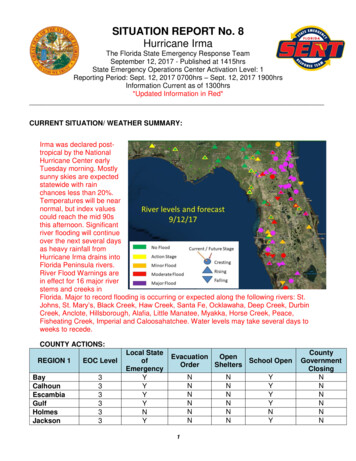
2578MONTHLY WEATHER REVIEWVOLUME 141FIG. 1. Tracks of Atlantic tropical storms and hurricane during 2011.become established along the U.S. east coast (Fig. 3),and this flow pattern steered most of the storms awayfrom the eastern seaboard. Still, one hurricane, Irenestruck the United States and the Bahamas. A total of 80deaths can be attributed to tropical cyclone activity fromthe 2011 hurricane season.2. Individual storm summariesThe individual cyclone summaries in this paper arebased on poststorm meteorological analyses by theNational Hurricane Center (NHC) using in situ andremotely sensed data from geostationary and polarorbiting satellites, aircraft reconnaissance, weather radars, ships, buoys, and conventional land-based surfaceand upper-air observations. The National Oceanic andAtmospheric Administration (NOAA) GeostationaryOperational Environmental Satellites (GOES) and Meteorological Satellite-9 (Meteosat-9) serve as the primaryplatforms. GOES-East and Meteosat-9 provide the visibleand infrared imagery that serve as input for position andintensity estimates based on the Dvorak classificationtechnique (Dvorak 1984; Velden et al. 2006). Subjective Dvorak intensity estimates used by NHC areperformed by NHC’s Tropical Analysis and ForecastBranch (TAFB) and the Satellite Analysis Branch (SAB)in Camp Springs, Maryland. The Advanced DvorakTechnique (ADT; Olander and Velden 2007) is anobjective method that also provides additional satelliteintensity estimates of tropical cyclones using geostationary imagery. In-depth descriptions of all data sourceshave been provided in previous seasonal summaries(e.g., Franklin and Brown 2008), and by Rappaport et al.(2009). There were no significant changes in data sourcesduring the 2011 season.Poststorm analyses result in the creation of a ‘‘besttrack’’ database for each cyclone, consisting of 6-hourlyrepresentative estimates of the cyclone’s center location,maximum sustained (1-min average) surface (10-m)wind, minimum sea level pressure, and maximum extent of 34-, 50-, and 64-kt winds in each of the fourordinal (northeast, southeast, southwest, and northwest)
AUGUST 20132579ANNUAL WEATHER SUMMARYTABLE 1. 2011 Atlantic hurricane season statistics.Storm nameClass*Dates**Max 1-min wind (kt)Min pressure (mb)DeathsU.S. damage ( RinaSeanTSTSTSTSTSTSTSTSMHTDTSMHTSTSHHMHHMHTS28 Jun–1 Jul17–22 Jul20–22 Jul27–30 Jul2–7 Aug12–13 Aug13–16 Aug19–22 Aug21–28 Aug25–26 Aug27–28 Aug29 Aug–10 Sep1–2 Sep2–5 Sep6–16 Sep7–11 Sep20 Sep–3 Oct24 Sep–8 Oct23–28 Oct8–11 ��—510—————* Tropical depression (TD), maximum sustained winds 38 mph (17 m s21) or less; tropical storm (TS), winds 39–73 mph (17.4–32.6 m s21);hurricane (H), winds 74–110 mph (33–49.2 m s21); major hurricane (MH), winds 111 mph (49.6 m s21) or higher.** Dates based on UTC time and include tropical depression stage.quadrants of the cyclone. A system is designated asa tropical cyclone in the best track at a particular time ifNHC determines that it satisfies the following definition:‘‘A warm-core, non-frontal synoptic-scale cyclone,originating over tropical or subtropical waters, with organized deep convection and a closed surface wind circulation about a well-defined center’’ (Office of theFederal Coordinator for Meteorology 2010). The tracksand statistics for the season’s tropical storms and hurricanes, including their depression, extratropical, andremnant low stages (if applicable), are shown in Fig. 1and Table 1, respectively. (Tabulations of the 6-hourlybest-track positions and intensities can be found in theNHC Tropical Cyclone Reports, available online athttp://www.nhc.noaa.gov/pastall.shtml).1 The dates givenin Table 1 only include the tropical and subtropical stages.Damage in the United States as a result of this season’s cyclones was about 16 billion (U.S. dollars),mostly attributable to Irene and Lee. Damage in othercountries (in U.S. dollars) in the NHC area of resposibility is included in the storm summaries when available. Descriptions of the type and scope of damage aretaken from a variety of sources, including U.S. federal,local, and international government officials, media1These reports contain storm information omitted here becauseof limitations of space, including additional surface observationsand a forecast and warning critique.reports, and local National Weather Service (NWS)Weather Forecast Office (WFOs) in the affected areas.Tornado counts are based on reports provided by theWFOs and/or the NWS Storm Prediction Center. Thestrength of the tornadoes is rated using the enhancedFujita (EF) scale (Texas Tech University 2006). Tablesof observations (Supplemental Tables 1–3) are provided for selected cyclones (Irene and Lee) in the online supplement. All dates and times are based oncoordinated universal time (UTC).a. Tropical Storm Arlene, 28 June–1 JulyArlene formed from a tropical wave that emergedfrom the coast of Africa on 13 June. The wave movedwestward with little distinction until it reached thewestern Caribbean Sea on 25 June, when the associatedshower activity increased as the wave interacted with anupper-level trough. Little change in organization occurred the next day when the wave crossed CentralAmerica and the Yucatan Peninsula of Mexico. Thewave moved into the Bay of Campeche on 27 June, whena broad area of low pressure formed. The wind circulation became better defined on 28 June, accompanied bya slight increase in the convective organization. Anaircraft investigated the system and found tropicalstorm–force winds to the north of the center of the low,suggesting the formation of a tropical storm near 1800 UTC28 June about 260 n mi (1 n mi 5 1.852 km) eastsoutheast of Tampico, Mexico. Steady development
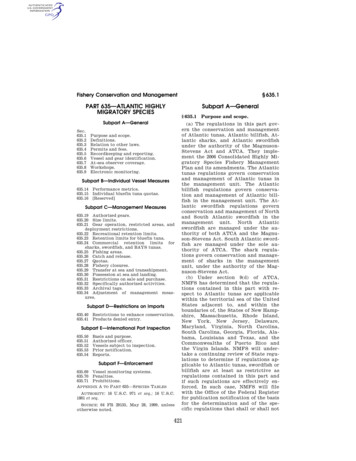
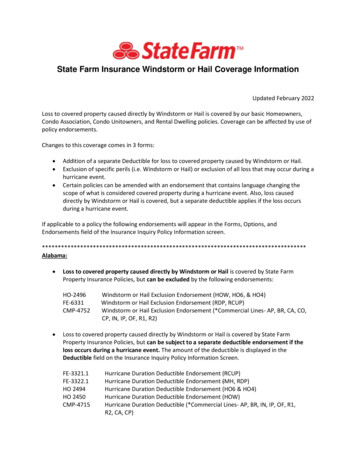
2580MONTHLY WEATHER REVIEWVOLUME 141dissipated over the mountains of Central Mexico earlyon 1 July.The U.S. Air Force Reserve 53rd Weather Reconnaissance Squadron made three flights into Arlene.The maximum observed flight-level winds at 1500 ft(;457 m) were 64 kt at 2027 UTC 29 June. An automated station at Isla Lobos, Mexico (just east of CaboRojo), reported sustained winds of 36 kt and a peak gustof 48 kt at 1115 UTC 30 June. Arlene brought heavy rainto eastern Mexico. Data from the National Meteorological Service of Mexico show widespread daily rainfalltotals in excess of 150 mm in for 29–30 June and 30 June–1 July. Tamesi, in the state of Tamaulipas, Mexico, reported 348 mm of rain in 24 h from 30 June to 1 July.Locally heavy rains also occurred over extreme southernTexas.Media reports indicate that 18 people died directly asa result of Arlene in Mexico. Most of the deaths appearto have been due to freshwater floods and mudslides inthe eastern part of that country. One indirect death occurred because of electrocution caused by a downedpower line.b. Tropical Storm Bret, 17–22 JulyFIG. 2. (top) Atlantic SSTAs (8C) during August–October 2011and (bottom) Atlantic 200–850-hPa vertical shear vectors anomalies (m s21) during August–October 2011.occurred while Arlene moved generally westward, andthe cyclone’s maximum sustained winds reached 55 ktbefore the center of the storm made landfall nearCabo Rojo, Mexico, around 1300 UTC 30 June. ArleneBret’s origin was nontropical. Early on 16 July,a shortwave trough that moved off the coast of thesoutheastern United States induced the formation ofa broad low pressure system along a weak stationaryfront. The low moved slowly south-southeastward toa position about 120 n mi east of Cape Canaveral,Florida, while convection gradually became organizednear the low-level center. Data from a reconnaissanceFIG. 3. Atlantic and eastern North Pacific named storm tracks during August–September 2011superimposed on 500-hPa height anomalies (m).
AUGUST 2013ANNUAL WEATHER SUMMARYflight indicated that a tropical depression formed around1800 UTC 17 July about 60 n mi north of Grand BahamaIsland.The depression moved slowly southeastward andsteadily intensified, becoming a tropical storm 6 h later.Bret approached Grand Bahama Island early on 18 Julybefore lifting out to the northeast. As vertical wind shearsteadily decreased, convection gradually increased nearthe storm’s center, and an eye feature became apparentin visible and microwave satellite imagery. A reconnaissance plane sampling the cyclone’s inner core founda reliable Stepped-Frequency Microwave Radiometer(SFMR) surface wind of 59 kt at about the same timethat the eye developed, and it is estimated that Bretreached its peak intensity of 60 kt at 1800 UTC 18 July.As Bret moved northeastward, the vertical shear increased and sea surface temperatures decreased, resulting in weakening of the cyclone. Bret lost all of its deepconvection and became a remnant low pressure systemthat dissipated by 1200 UTC 23 July about 425 n mi southsouthwest of Cape Race, Newfoundland.c. Tropical Storm Cindy, 20–22 JulyCindy’s incipient disturbance was first identified insatellite imagery late on 17 July, when an area of relatively concentrated cloudiness and showers developedabout 300 n mi west-southwest of Bermuda. The disturbance formed along a decaying surface front as aweak mid- to upper-level trough moved over the western Atlantic. The next day a broad low pressure areaformed northwest of Bermuda from the disturbance as itmoved east-northeastward. Shower and thunderstormactivity became better organized, and early on 20 Julythe low pressure area developed a well-defined center.This resulted in the formation of a tropical depressionabout 265 n mi east of Bermuda at 0600 UTC 20 July.The depression moved east-northeastward at 20–25 ktand became a tropical storm 6 h later. Cindy reacheda peak intensity of 60 kt at 1800 UTC 21 July whena ragged eyelike feature appeared in satellite images.Cindy turned northeastward in midlatitude southwesterly flow over the central Atlantic, and it remainedon this general heading until dissipating in the NorthAtlantic.d. Tropical Storm Don, 27–30 JulyDon originated from a tropical wave that moved offthe west coast of Africa on 16 July and then across theLesser Antilles and the eastern Caribbean Sea on 23July, producing wind gusts of up to 35 kt in Puerto Ricoand the U.S. Virgin Islands. The wave continued westward and early on 26 July the thunderstorm activitybecame more concentrated south of Cuba around a2581broad surface low associated with the wave. A tropicaldepression formed around 0600 UTC 27 July about50 n mi northeast of Cancun, Mexico. It strengthenedto a tropical storm 12 h later. After reaching tropicalstorm status, Don moved across the Gulf of Mexico andit encountered an environment characterized by light tomoderate northerly vertical shear and relatively dry air,which likely prevented significant intensification. Donreached its peak intensity of 45 kt around 0000 UTC29 July while centered about 345 n mi east-southeast ofCorpus Christi, Texas, and the cyclone maintained thisintensity for about 18 h. After that time, the storm beganto weaken as deep convection rapidly decreased nearthe center, likely due to increasing vertical wind shearand entrainment of dry air from drought-stricken areasin northeastern Mexico and southern Texas.Don weakened to a tropical depression and crossedthe Texas coast around 0230 UTC 30 July along thePadre Island National Seashore just to the northeast ofBaffin Bay. After landfall, Don degenerated to a remnant low by 0600 UTC 30 July when centered near Alice,Texas, and then quickly dissipated.The estimated peak intensity of Don is based on SFMRwind maxima of 43 and 46 kt at 0007 and 1712 UTC29 July, and an 850-mb flight-level wind maximum of56 kt at 1713 UTC that day. The highest sustained windmeasured on land at an official observing site was 30 ktat Laredo, Texas, and the highest gust was 36 kt atWaldron Field, Texas. The highest rainfall total was 65 mmat Bay City, Texas, well northeast of where the centermade landfall.Don produced storm tide values of 0.3–0.76 m abovemean lower low water along the Texas coast. Thehighest observed storm tide value was 0.78 m at the BobHall Pier in Corpus Christi. The highest reported stormsurge was 0.58 m at the Bob Hall Pier.e. Tropical Storm Emily, 2–7 AugustEmily formed from a tropical wave that emerged fromthe west coast of Africa on 25 July. The system continued westward and as it passed through the LesserAntilles, a large area of winds near tropical storm forcewas already present. Air Force reconnaissance data indicate that a tropical storm formed around 0000 UTC2 August about 30 n mi northwest of Martinique.Emily continued moving west-northwestward andpassed about 150 n mi south of Puerto Rico on 2–3August. There was some increase in westerly shear by3 August, and Emily did not strengthen as its low-levelcenter became partially exposed to the west of the mainconvective mass. A vigorous burst of thunderstorms developed east of the center early the next day while Emilywas passing to the south of Hispaniola, and aircraft
2582MONTHLY WEATHER REVIEWdata indicated that a low-level center reformed closer tothe convection. Later on 4 August, however, the lowlevel center accelerated west-northwestward and Emily’s surface circulation degenerated into an open waveas it approached the southwestern tip of Haiti around1800 UTC.The midlevel remnants of Emily moved westnorthwestward through the southern and central Bahamas on 5 August. Surface pressures began falling as thisfeature reached the western Bahamas early on 6 August,and surface observations indicated that a new low pressurecenter formed just north-northwest of Andros Island.Aircraft data revealed that the system regenerated intoa tropical depression around 1800 UTC that day as it wasapproaching the eastern end of Grand Bahama Islandand then strengthened into a tropical storm 6 h later.Emily’s second period as a tropical storm was brief.Northerly to northeasterly vertical wind shear causedEmily to degenerate into a remnant low by 1200 UTC 7August while centered about 230 n mi northeast ofGrand Bahama Island, and then dissipated into an opentrough around 0000 UTC 8 August. The remnants ofEmily accelerated east-northeastward across the centralAtlantic on 8 August, producing a large area of galeforce winds. Although the system briefly became betterorganized, the strong westerly wind shear preventedregeneration from occurring a second time.Heavy rains associated with Emily occurred overportions of the Lesser Antilles, where Martiniquerecorded a total of 150 mm. The largest rainfall totals inPuerto Rico were generally over the eastern part of theisland, with Caguas reporting the largest amount of209 mm. An unofficial rainfall total of 528 mm was reported in Neiba in the Dominican Republic. Althoughno sustained tropical storm–force winds were reportedfrom this region, wind gusts in some of the passing bandswere of tropical storm strength (e.g., a gust to 45 kt wasobserved at Buck Island in the British Virgin Islands.)Heavy rains also caused several rivers to overflowtheir banks in Puerto Rico and Hispaniola. Three hundred homes were reportedly damaged in Haiti, butdamage elsewhere on the island was light. Floods causedseveral large landslides in Martinique, but damage wasminor.f. Tropical Storm Franklin, 12–13 AugustAn area of low pressure formed along a frontal systemaround 1200 UTC 12 August over the western Atlantic.The low lost its frontal characteristics as convection increased, and the system became a tropical depression at1800 UTC about 200 n mi north of Bermuda.The depression was compact, with its cloud fieldextending no more than 150 n mi across. Embedded inVOLUME 141deep-layer southwesterly flow, the depression movednortheastward at about 20 kt and strengthened toa tropical storm 12 h after genesis. Franklin reached itspeak intensity of 40 kt 6 h later, just before it developedfrontal characteristics and became an extratropical cyclone. The extratropical low degenerated into a troughof low pressure by 0600 UTC 16 August about 500 n miwest-southwest of the Azores.g. Tropical Storm Gert, 13–16 AugustA cold front moved southward over the central Atlantic on 7–8 August and lost much of its temperaturegradient by 9 August. The resulting frontal trough remained nearly stationary to the northeast of the northern Leeward Islands during the next several days, and anupper-level shortwave trough induced the developmentof a well-defined low pressure system around 0600 UTC13 August. Persistent deep convection developed nearthe low later that day, and a tropical depression formedaround 1800 UTC about 370 n mi southeast of Bermuda.The depression strengthened and became a tropical storm12 h later.Gert moved slowly west-northwestward through early14 August, but a deep-layer trough near the east coast ofthe United States caused Gert to abruptly turn towardthe northwest and north later that day. The stormstrengthened little during that time as a result of northwesterly shear and entrainment of drier air from the west.The environment became a little more conducive forstrengthening on 15 August, and Gert reached an estimated peak intensity of 55 kt around 1200 UTC as it wasmoving northward about 90 n mi to the east of Bermuda.Gert began to weaken soon after reaching its peak intensity because of an increase in northeasterly shear anddecreasing sea surface temperatures. The cyclone turnednortheastward and lost its tropical characteristics around1200 UTC that day while centered about 435 n minortheast of Bermuda, but it continued to produce galeforce winds for another 12 h. The remnant low accelerated northeastward at nearly 30 kt ahead of a cold front,dissipating after 1800 UTC 17 August about 400 n mi eastof Cape Race, Newfoundland.h. Tropical Storm Harvey, 19–22 AugustThe precursor to Harvey was a tropical wave thatdeparted the coast of Africa on 10 August. This systeminitially showed signs of organization, with abundantconvection and an accompanying surface low. Convection diminished on 12 August, however, perhaps dueto dry air entrainment and easterly shear. The low dissipated by the next day. As the system moved overwarmer waters in the western tropical Atlantic, the waveregained some of its convective vigor on 14 August.
AUGUST 2013ANNUAL WEATHER SUMMARYSurface data indicated that the system lacked a closedsurface circulation as it traversed the eastern and centralCaribbean Sea. The convection increased in both coverage and organization on 18 August when the systemwas in the western Caribbean Sea, and a tropical depression formed by 0000 UTC 19 August about 70 n minortheast of Cabo Gracias a Dios on the border ofNicaragua and Honduras.In an environment of moderate easterly wind shearand over very warm waters, the tropical cyclone gradually strengthened, becoming a tropical storm by 1200 UTC19 August. Meanwhile, a midlevel ridge over the Gulfof Mexico steered Harvey toward the west-northwestjust to the north of mainland Honduras and the BayIslands. In the last several hours before landfall, convection became deeper near the center, and radar images from Belize along with aircraft data indicated thatan eye was trying to form. Although that feature did notmaterialize, reconnaissance and satellite data suggestedHarvey reached a peak intensity of 55 kt at landfallnear Dangriga, Belize, around 1730 UTC 20 August. Thestorm weakened to a tropical depression over northwestern Guatemala and moved over the Bay of Campechejust before 1800 UTC 21 August. Harvey turned towardthe west shortly after that, and a flare-up of convectionnear and west of the center caused the system to intensify slightly. Surface data from Mexico indicatedthat Harvey became a tropical storm again with 35-ktwinds by 0000 UTC 22 August, and the storm made landfall around 0200 UTC that day near Punta Roca Partida,Mexico. Harvey quickly weakened and dissipated over thehigh terrain of Mexico shortly after 1200 UTC 22 August,when the system was located about 85 n mi southwest ofVeracruz, Mexico.According to the Associated Press, high winds andheavy rain were noted in Dangriga during the storm, butthere were no reports of damage or casualties there. InMexico, three people were killed in San Lucas Zoquiapam,Oaxaca, as a result of a mudslide hitting their home.Although no specific rainfall totals are available, Harveycaused significant floods, and 334 homes were reporteddamaged in the city of Veracruz.i. Hurricane Irene, 21–28 August1) SYNOPTIC HISTORYIrene originated from a vigorous tropical wave thatexited the west coast of Africa on 15 August, accompanied by a large area of cloudiness and thunderstorms.The convection diminished when the wave moved justsouth of the Cape Verde Islands the next day, butthe wave maintained a well-defined midlevel circulation.Showers and thunderstorms gradually regenerated while2583the wave continued westward across the tropical Atlantic,and the cloud pattern became better organized by thetime the system was halfway between the west coast ofAfrica and the Lesser Antilles on 17 August. A reconnaissance aircraft investigated the system for severalhours on 20 August, finding surface winds of 40–45 ktbut no well-defined closed low-level circulation. Justbefore the conclusion of the mission, the aircraft meteorologist was able to close off a circulation near thesouthern edge of the convection about 120 n mi mileseast of Martinique, marking the formation of a tropicalstorm shortly before 0000 UTC 21 August. After genesis, Irene moved toward the west-northwest across theextreme northeastern Caribbean Sea, gaining organization and strength on 21 August. As the center of thecyclone moved over St. Croix around 2300 UTC thatday, an interval of light winds associated with the centerwas observed and, in fact, an Air Force Reserve Hurricane Hunter aircraft was able to depart from there for itsmission during that period of calm.Irene continued west-northwestward and the center passed over the eastern shore of Puerto Rico at0535 UTC 22 August. The cyclone became a hurricanewhile moving over the island a short time later, but thehurricane-force winds did not affect the island and occurred only over water north of the center. The hurricane moved very close to the north coast of Hispaniolaon 23 August, and despite a favorable atmosphericenvironment of low shear, the interaction of Irene’scirculation with the high terrain of Hispaniola likelydelayed additional intensification. As it moved awayfrom Hispaniola early on 24 August, however, Irenebegan to strengthen. It became a category 3 hurricanewith a peak intensity of 105 kt and a central pressure of957 mb at 1200 UTC 24 August when it was centeredbetween Mayaguana and Great Inagua in the southeastern Bahamas. The eye was then about 18 n mi indiameter based on hurricane hunter reports. The hurricane continued moving west-northwestward, and theeye crossed Acklins and Crooked Islands near 1500 UTC24 August. These islands likely experienced category3 hurricane conditions. Irene weakened a little bitwhen its core moved over Long Island, Bahamas, around0000 UTC 25 August.A midtropospheric trough developed over the easternUnited States on 24 August, and the subtropical ridgethat had been steering Irene west-northwestward acrossthe southeastern Bahamas shifted eastward. Embeddedwithin the associated flow pattern, Irene turned towardthe north-northwest and north as it moved across thecentral and northwestern Bahamas. The eye passedbetween Exuma and Cat Island around 0600 UTC25 August, crossed Eleuthera a few hours later, and then
2584MONTHLY WEATHER REVIEWreached the Abaco Islands in the northwestern Bahamasaround 1800 UTC 25 August. By then, Irene hadweakened further and these islands probably experienced category 2 hurricane conditions. Although Irene’swinds decreased during this period and the eye becameless discernible in satellite images, its circulation expanded and the central pressure continued to fall,dropping to 942 mb by 0600 UTC 26 August.The hurricane continued northward and passed welloffshore of the east coast of Florida and Georgia whileweakening. Irene made landfall near Cape Lookout,North Carolina, at 1200 UTC 27 August with an intensity of 75 kt, producing category 1 hurricane-forcewinds within a swath primarily to the east of the centerover the North Carolina sounds and the Outer Banks.Irene then moved north-northeastward, with its center passing just offshore of the Delmarva Peninsula,and then made another landfall very near AtlanticCity, New Jersey, at Brigantine Island at 0935 UTC 28August. Although Irene’s intensity at the New Jerseylandfall was 60 kt, winds of that strength were confinedto the waters east of the center. Irene continued moving north-northeastward and the center moved overConey Island, Brooklyn, New York, around 1300 UTC28 August, and then over Manhattan, New York City,about 1 h later. Once again, the storm’s strongest windsat the time of landfall (55 kt) continued to occur primarily well to the east of the center. Irene movednorth-northeastward over the northeastern UnitedStates and became extratropical when its center wasnear the New Hampshire–Vermont border around0000 UTC 29 August. The cyclone was absorbed bya frontal system at 0600 UTC 30 August over northeastern Canada.2) METEOROLOGICAL STATISTICSIrene was well sampled by reconnaissance aircraft.There were 19 missions performed by the 53rd WeatherReconnaissance Squadron of the U.S. Air Force Reserve Command and 16 by NOAA Aircraft OperationsCenter WP-3D aircraft. There were also seven missionsinvolving the NOAA G-IV high-altitude jet to samplethe environment surrounding Irene.Eleuthera reported a minimum pressure of 952.4 mbat 0900 UTC 25 August as the eye moved near that island, and Marsh Harbor in the Abacos measured aminimum pressure of 950.4 mb at 17
dissipated over the mountains of Central Mexico early on 1 July. The U.S. Air Force Reserve 53rd Weather Re-connaissance Squadron made three flights into Arlene. The maximum observed flight-level winds at 1500 ft (;457m) were 64kt at 2027 UTC 29 June. An auto-mated station at Isla Lobos, Mexico (just east of Cabo