Transcription
insightsQuantifying the Accuracy of Rep Line vs. Loan Level Datafor Cashflow Generation in Online LendingABSTRACT / In this report, we utilize dv01's cashflow engine to study the accuracy and efficiency of cashflow generationmethods at different degrees of granularity, from a single loan rep line, to rep lines across multiple attributes, to loanlevel data. Our findings show that the rep line methodology widely used for securitization deals creates significantinaccuracy for cashflow projections. We conclude with showing how integrating up-to-date securitization collateral datawith a scalable loan level cashflow engine addresses these inaccuracies.October 2017Wei Wu, Ph.D., CFA, Principal Data ScientistYehuda Graber, Quantitative EngineerFrank Deutschmann, Head of Productsupport@dv01.co 646-854-5258 915 Broadway, Suite 802, New York, NY 10010
REP LINE VS. LOAN LEVEL DATA FOR CASHFLOW GENERATIONINTRODUCTION TO CASHFLOW GENERATION / Cashflow projection and analysis isa critical process for investing in fixed-income markets. More accurate cashflowprojections are the foundation for making better decisions in valuation, performanceanalysis, risk analysis, and asset-liability management—especially when analyzingdeep credit.A cashflow engine or cashflow model is the tool used to generate projected futurecashflows for a loan/bond portfolio. Inputs to the engine include: the characteristicsof the loans or bonds; assumptions for various risk parameters such as defaultcurves, prepayment curves, and recovery rates; and other information such as fees.For a single fixed rate loan, cashflows are a set of fixed amortized payments for everytime period, typically every month until maturity, assuming there is no default and noprepayment. When defaults and prepayments are taken into account, cashflowengines usually use partial loan modeling. The user inputs a set of default andprepayment rates or probabilities and the cashflow engine projects the expectedcashflows derived from the amortized payments based on the proportional amountof principal pay-down or charge-off according to the provided prepayment anddefault rates.While the above describes cashflow generation for simple online lending loans,projecting cashflows for different tranches of online lending securitization dealsinvolves complicated logic and a system that models the cashflow waterfall of thedeals on top of the collateral cashflows. In this report, we concentrate on the accuracyof the projected collateral cashflows of these deals.dv01 has a cashflow engine optimized for online lending loans and securitizationdeals, and integrated with direct data feeds from all participants in the deals. We usethis engine for the analysis in this report. Readers can also replicate these resultsusing other commercial cashflow engines given appropriate data updates.REP LINE CASHFLOW ANALYSIS / Traditionally, it has been impractical to generatecashflows on loan level data. You would have to generate cashflows for tens orhundreds of thousands of loans and then aggregate them together, which could takehours with legacy cashflow engines.The common solution for this is a rep line analysis, which approximates the portfoliowith a set of hypothetical loans or assets, called rep lines. Each rep line represents agroup or subset of the portfolio with the statistical characteristics of that group. Eachindividual loan within the group is assumed to be homogeneous and to have samebehavior as the rep line.An effective rep line analysis tries to divide the portfolio into granular enough cohorts2support@dv01.co 646-854-5258 915 Broadway, Suite 802, New York, NY 10010
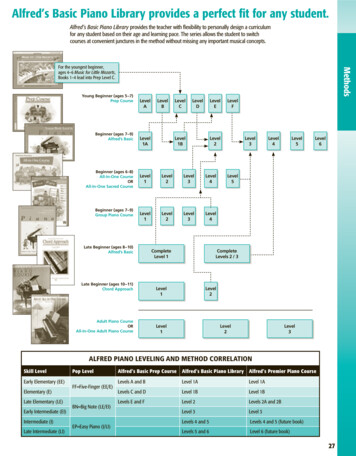
REP LINE VS. LOAN LEVEL DATA FOR CASHFLOW GENERATIONto capture the diverse characteristics of the loans in the pool, while also minimizingthe number of rep lines needed. However, the effectiveness of rep line analysis hasnot been measured or studied quantitatively, particularly in online lending. We set outto study what makes a good rep line for accurate and efficient cashflow generation.MEASURING CASHFLOW ACCURACY QUANTITATIVELY / To quantitatively assessthe accuracy of a set of projected cashflows, we first define a set of referencecashflows to compare against. We then define a metric to quantitatively measure theinaccuracies against the reference cashflows on the same scale for each projection foran apples-to-apples comparison.Below is a simple example that illustrates the metrics we are going to use to measurethe accuracy of one set of projected cashflows to a set of reference cashflows. InFigure 1 and Figure 2, we use a reference pool composed of 108,663 loans fromLending Club in California. We assume a constant annualized default rate (CDR) of10% and a constant annualized prepayment rate (CPR) of 20% for all loans. We thengenerate cashflows on both the loan level and a single loan rep line.Fig1: Loan level vs. rep line cashflowsRep lineLoan LevelOne LoanCashflow6%4%2%0%0204060periodFig 2: Cashflow differences between single loan rep line & loan level projectionsCashflow Difference0.8%Cashflow TypeDiscounted CashflowRaw Cashflow0.4%0.0%-0.4%0204060period3support@dv01.co 646-854-5258 915 Broadway, Suite 802, New York, NY 10010
REP LINE VS. LOAN LEVEL DATA FOR CASHFLOW GENERATIONFigure 1 shows loan level cashflows (Blue) and single loan rep line cashflows (Green).We can see that there are significant deviations between these two sets of cashflows.Present value is used to quantify the differences in the magnitude and timing offuture cashflows. We define first type of cashflow matching error, present value error,as:The present value error is the sum of the differences in cashflows across all periodsas a percentage of present value of the reference pool.Figure 2 shows the raw and discounted cashflow differences between the single loanrep line cashflow projection and the loan-level reference cashflows we show in Figure1. Note that the deviations can be positive or negative for different periods and that,based on the definition of present value error, the positive deviation can be cancelledout by a negative deviation at a different period. Therefore the present value error isnot affected by the timing of the cashflows, just the total present value of cashflows.However, investors care about both the magnitude and the timing of the cashflow.We address this by defining a second type of cashflow matching error, shape error:Shape error incorporates timing mismatches in cashflows, ensuring that positive andnegative mismatches do not offset each other.CASHFLOW ACCURACY UNDER UNIFORM DEFAULT AND PREPAYMENTASSUMPTIONS / With the definitions of errors in place, we evaluate the accuracies ofvarious rep line cashflows. We will assume all loans have the same default curve andprepayment curve (flat 10% CDR and 20% CPR) and run projections on the same loanpool used above, Lending Club Standard Platform loans issued in California. Table 1shows the results for cashflow projections using rep lines at different levels ofgranularity. The first line shows the cashflows generated at loan level that will serveas the reference cashflows rep line errors will be benchmarked against. It takes 1.5seconds to generate cashflows for all 108,663 loans in the loan pool. (Note that dv01’scashflow engine was optimized for accurate loan-level predictions without sacrificingspeed.)4support@dv01.co 646-854-5258 915 Broadway, Suite 802, New York, NY 10010
REP LINE VS. LOAN LEVEL DATA FOR CASHFLOW GENERATIONTable 1: Cashflow accuracies for different rep lines for Lending Club in CaliforniaLoan PoolLending Club in CA# LoansRep Line Method108,663 Loan LevelNPV ErrorShape ErrorTime(sec)001.54Lending Club in CA1 Single Loan0.008620.168310.02Lending Club in CA2 Group by matchingterms0.003270.112800.05Lending Club in CA94 Group by matchingterm age0.000870.000872.05Lending Club in CA828 Group by matchingterm age coupon0.000020.0000220.68The rep lines in Table 1 are based on several factors that affect cashflows. In additionto matching average coupon, the loans used in this projection:1. match only the average term and average age with one loan2. match separately for loans with different original terms3. match original terms and loan agesFirst, we can see that the present value error is small for all rep lines. This is becausethe cashflows for rep lines are generated based on the weighted average coupon ofthe loans in the rep lines. The same weighted average rate is used to discount thesecashflows. Therefore, the present values for different rep lines are all close to par,even though the timing of the cashflows can be significantly different. So the moreappropriate measurement of cashflow accuracy in this case is the shape errors.From Table 1, we can see that the shape error with a single loan rep line is significantat 0.168, which took 0.02 seconds to generate. As we increase the granularity of therep lines, the errors decrease, 0.11 for rep lines matching two types of original terms,and 0.0009 for rep lines matching both terms and ages, with a total of 94 rep lines. As Cashflows willclosely mirror loanlevel cashflows ifwe use rep linesthat match loanterms and loanages.the number of rep lines increases, so do the execution times.Notice that rep lines grouped by terms and ages have a very small error. As we statedpreviously, the main variables that determine cashflows are: basic loan characteristics(loan rate, loan term, loan age or remaining term), and default and prepayment rates.When the default and prepayment rates are the same, the cashflows will closelymirror loan level cashflows if we use rep lines that match loan terms and loan ages.Including coupon in addition to term and age as a grouping variable further reducesshape error close to 0, as seen in the last line of Table 1. However, the number of replines increases significantly, from 94 to 828, causing the run time to be significantlylonger than running loan level projections. The run time overhead is caused by thecommunication inefficiencies of dynamically generating 828 replines outside of thecashflow engine and passing the data into the engine. In other words, the efficiency5support@dv01.co 646-854-5258 915 Broadway, Suite 802, New York, NY 10010
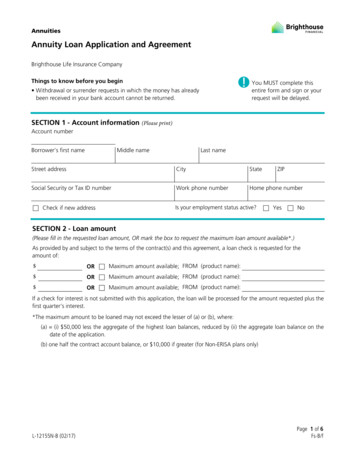
REP LINE VS. LOAN LEVEL DATA FOR CASHFLOW GENERATIONadvantage of rep lines is lost when the rep lines become complicated and themagnitude of improvement in projections is minor, as can be seen in Figure 3.Fig 3: Cashflows using various rep linesRep lineOne LoanMatching TermsMatching Terms AgeMatchingTerms Age CouponLoan Level* The lines of Matching Terms Age, Matching Terms Age Coupon, and Loan Level overlap perfectly.Discounted Cashflow6%4%2%0%0204060periodObservant readers may also notice that when term and age are included in the repline grouping, the present value error matches the shape error. This means that the The efficiencyadvantage of replines is lost whenthe rep linesbecomecomplicated andthe magnitude ofimprovement inprojections isminor.cashflow differences at every time period have the same sign. See footnotes for moredetailed information on this observation.*The necessity of rep lines is more clearly illustrated in larger loan pools. In Table 2, wereplicate the process described above but with a much larger loan pool, consisting ofmore than 1 million loans. You can see that the shape error, known as cashflow errorfrom this point forward, is similar to Table 1, even though this pool is much larger.Here, as in Table 1, rep lines that include term and age produce acceptable error andshorter run time than loan level cashflows.* We can analytically prove that, for an amortized loan pool, cashflows generated using replines that include term and age as a grouping are always smaller than the sum of cashflowsfrom individual loans at every time period due to the convex property of the amortizedpayments over coupon rate. Contact intelligence@dv01.co for further details.6support@dv01.co 646-854-5258 915 Broadway, Suite 802, New York, NY 10010
REP LINE VS. LOAN LEVEL DATA FOR CASHFLOW GENERATIONTable 2: Cashflow accuracies for different rep lines for full Lending Club platformLoan Pool The accuracy ofthe cashflowsincreases with thegranularity of therep lines.# LoansRep Line MethodLoan LevelNPV ErrorShape ErrorTime(sec)0017.26All Lending Club1,108,160All Lending Club1Single Loan0.006910.163630.02All Lending Club4Group by matchingterms0.003700.108830.10All Lending Club136Group by matchingterm age0.001450.001453.10All Lending Club1,010Group by matchingterm age coupon0.000020.0000224.51The conclusions in Table 1 and Table 2 still hold when we run the above rep linesusing CPR and CDR curves with various shapes and magnitudes. The accuracy of thecashflows increases with the granularity of the rep lines, with the inclusion of termand age being essential to accuracy.However, the above assumptions do not hold in the real world. Errors in cashflowprojection can come from two main sources:1. Significant discrepancies of the input curve assumptions from actualdefault/prepay statistics.2. Mismatches in loan term/age distributions between rep lines and the exact loanpool.We will now look closely at the second reason in the context of online lendingsecuritization deals. Discrepancies caused by the first reason will be examined in afollow-up report.SIGNIFICANT CASHFLOW ERRORS FROM A COMMONLY USED REP LINEGENERATION METHOD: STATIC REP LINES AND ROLLED BALANCES / Asconcluded in the above section, grouping by term and age, or remaining term, whenconstructuring rep lines is essential for cashflow accuracy. As a consequence, replines that do not accurately reflect the distribution of the remaining terms ofunderlying collaterals can cause significant errors. This section will highlight howtraditional practices for generating collateral cashflows for ABS securitizations exhibitthe above tendencies, causing inaccurate cashflow results.One of the most commonly used methodologies for generating cashflows forsecuritization deals relies on the rep lines stated in the deal's OM or offeringmemorandum. OM rep lines are constructed based on the statistical loan pool beforedeal closing, and thus often do not accurately reflect the final loan pool in the deal.This is because there is a lag between the preparation of the OM and the final cut-offdate that determines the final composition of the collateral portfolio. In addition, the7support@dv01.co 646-854-5258 915 Broadway, Suite 802, New York, NY 10010
REP LINE VS. LOAN LEVEL DATA FOR CASHFLOW GENERATIONexact variables used to generate OM rep lines are not given, making it difficult toverify how closely these rep lines capture the statistical profile of the final collateralpool.Another source of inaccuracy is the way current balances of the rep lines aredetermined after closing date. Traditionally, investors and cashflow vendors only Our researchshows that theprepay anddefault rates canvary greatly fordifferent rep lineswith differentcharacteristics.receive the aggregate balances of the collateral loan pool as reported in the monthlytrustee reports. The conventional method used to get the balances of each rep line isthe following: First, calculate the scheduled amortized loan balances for each rep line.Then, calculate the balance difference between the total scheduled balance and thetrustee reported total balance. The balances for all the rep lines is determined byproportionally distributing this total difference according to the scheduled balanceamounts in each rep line. This procedure is carried from one period to another. Thismethod is called “rolled balance” method.This process assumes the same default and prepay rates for each rep line for eachtime period. While nonoptimal, this is the only reasonable method for updating repline balances monthly given the traditional lack access to updated loan level data.However, our research shows that the prepay and default rates can vary greatly fordifferent rep lines with different characteristics. Therefore, discrepancies in the loanbalances for each rep line used as the starting point for cashflow generation canoccur. Thus, resulting cashflows diverge from accurate cashflows generated usingtimely loan level data. As time passes, discrepancies will grow and amplify.Table 3: Cashflow accuracies for different rep lines for a securitization dealRep Line MethodLoan PoolBalance# Loans09/30/166/30/17Cashflow Error09/30/16 12/31/1612/31/163/31/173/31/176/30/17Loan 0.000000.00000Term Age 0770.00070Term Age Grade,Static at 837OM Replines,Static at 829In Table 3, we present cashflows generated using different rep line methods for asecuritization deal from 2016. (This was replicated with another deal which producedsimilar results, not included here for brevity.) Row 1 uses up-to-date loan level data atrun time to project cashflows, ensuring no discrepancies between the rep lines andthe underlying collateral. (This data is accessible through dv01.)8support@dv01.co 646-854-5258 915 Broadway, Suite 802, New York, NY 10010
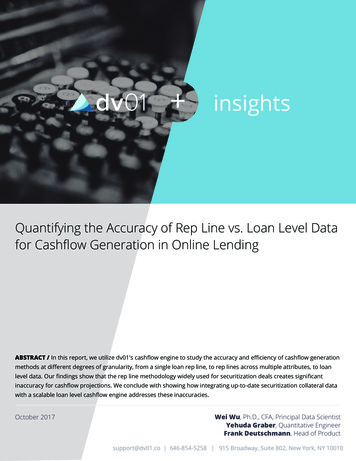
REP LINE VS. LOAN LEVEL DATA FOR CASHFLOW GENERATIONRows 2 and 3 are the results using rep lines constructed by grouping on loan term,remaining terms, and loan grade. Row 2 uses these groupings and actual loanbalances for each rep line compiled from loan level data from the source above, anddynamically generates rep lines for each date as time passes. In Row 3, rep lines usethe same grouping, but the rep lines are only generated once at deal closing and the“rolled balance” method described above is used to set balances of the rep lines. Row Using the "rolledbalance" method,we see a cashflowerror of 2.9% twomonths after theclosing of thedeal.4 uses OM rep lines, which are static at closing. For this deal, the OM rep linesprovided enough information to determine that they were constructed approximatelybased on the following variables: original loan term, remaining loan term, and loangrade.Using these different methods, we generate cashflows at various points in timethroughout the lifetime of the deal. In this study, we used simplified default andprepay assumptions, using a constant 20% CPR and 10% CDR. The deal's closing datewas 7/29/2016. We started the cashflow generation run immediately after the firstpayment day on 9/30/16. We then generated cashflows in three month intervals. Thefirst line in the table (Row 1) serves as the reference since it is based on loan leveldata and actual loan balances on those dates. All other rep line methods aremeasured against the loan level cashflows. The results are shown in order ofaccuracy.Starting with the least accurate, in the last line of the table (Row 4), we have the OMreported rep lines. As the balances of OM rep lines are only given once and thestatistical variables used to generate these rep lines are not disclosed, these rep linesare static, with balances updated through the “rolled” balance method. Using thismethod, we see a cashflow error of 2.9% on 9/30/16, only two months after theclosing of the deal. This error is significant as it is the error as a percentage of presentvalue. The cashflow errors do not improve for subsequent dates and stay consistentat 2.9%.The reason for this significant error is because of the mechanics of how securitizationworks. There is a significant time delay between the formation of the rep line statisticsand the closing of the deal. The composition of the final loan pool can be differentfrom the statistical loan pool the OM used to generate the rep lines. In Table 4, weshow the overall statistics on the loan term. The overall loan balances are closelymatched. The percentage allocations along the loan terms are also close between theOM rep lines and “real” loan level statistics. However, the loan count is different,which means loans went in and out of the loan pool between the “statistical cut-offdate” and the closing date.If we look at the distribution of the loan balance over the remaining terms as shownin Figure 4, we see significant differences between the loan balances of OM statedrep lines along the remaining term. (We used dv01’s Securitizations functionality to9support@dv01.co 646-854-5258 915 Broadway, Suite 802, New York, NY 10010
REP LINE VS. LOAN LEVEL DATA FOR CASHFLOW GENERATIONTable 4: Distributions of loan terms in OM rep lines vs. ActualOM Rep LinesBalancePercentTerm# LoansLoan Level StatsBalancePercent# 05,440,278100.00%15,880205,440,274100.00%16,529see the balance at each value of the remaining term based on loan level data.) Uponfurther investigation, we see that the biggest cause of difference is the inaccurateremaining terms that were reported for the rep lines. One way to “fix” this is to shiftthe rep line distribution along remaining term by two months, which approximatesthe two month period between the statistical cut-off and the closing date for the deal.We can see in Figure 4 that after shifting the remaining terms, the distribution of theOM rep lines is much closer to the actual loan pool. Without this correction, there willbe significant differences in loan balance distributions and thus significant cashflowerror.Examining the results from Row 2 and 3 in Table 3, we see that both use rep linesFigure 4: Distributions by remaining term of actual loan pool, OM rep line, and shifted OM repline at deal closingActualOM rep lineOM rep line shifted12%Distribution9%6%3%0%1015202530Remaining Term10support@dv01.co 646-854-5258 915 Broadway, Suite 802, New York, NY 10010
REP LINE VS. LOAN LEVEL DATA FOR CASHFLOW GENERATIONgrouped by the same attributes but employ different methods for updating balances.For the rolled balance method in Row 3, the error is fairly small at 0.00062 at thebeginning of the deal. But as time goes by, the cashflow errors get bigger and bigger:0.00206, 0.00505, 0.00837. On the other hand, errors for cashflows generated usingrep lines with up-to-date stats from loan level balances, summarized in Row 2, stayaround the same level: 0.0009 to 0.0007. Thus, we can conclude that the rolled The rolled balancemethod generatessignificant errors,accumulating asthe deal seasons.balance method generates significant errors, accumulating as the deal seasons.The errors in projected cashflows due to the rolled balance approach are especiallysignificant on the residual tranche of the deals. The errors we measure here are thedeviation in collateral cashflows measured against the percentage of the total value ofthe collateral pool. Using the rolled balance method, the cashflow error of 0.8% at 11months after the deal closes has a significant impact on the value of the residualtranche. Fluctuations in collateral cashflows at the tail end all go directly into theresidual, thus relatively small changes can impact the residual tranche significantly.CONCLUSION / Common approaches to cashflow generation for securitization dealshave many shortcomings and can potentially produce significant inaccuracies. Theseproblems are caused by the lags in the traditional securitization reporting process, aswell as the static nature of legacy cashflow tools. Specifically, the commonly used“rolled balance” method of generating cashflows from static rep lines can result insignificant errors, especially as time passes.Modern cashflow engines, such as dv01’s solution, are closely integrated withoriginators, servicers, trustees, and data providers, allowing them to accessup-to-date data for securitization deals at the loan level. This enables users togenerate cashflows in loan level detail with up-to-date data with no noticeable delay,as well as have the flexibility to create accurate dynamic rep lines based on updatedcollateral data, which results in higher accuracyIn a follow-up report, we will examine the effect that discrepancies between inputcurve assumptions and true default/prepay statistics have on cashflow generation foronline lending securitizations.ABOUT DV01 / dv01 is a data management, reporting, and analytics platform that brings transparency and insight to lendingmarkets—making them more efficient for institutional investors and safer for the world. As a hub between lenders and capitalmarkets, dv01 provides one source of transparent data for bonds and whole loans. To date, dv01 has offered institutional investorsinsight into 10 billion of securitizations and more than 64 billion of consumer, small business, real estate, auto, and student loans( 90% of total) from the largest online lenders, including LendingClub, Prosper, and SoFi.11support@dv01.co 646-854-5258 915 Broadway, Suite 802, New York, NY 10010
REP LINE VS. LOAN LEVEL DATA FOR CASHFLOW GENERATIONDISCLOSURES / This document is for general information and for the purposes of facilitating a discussion only, and is not intended,and does not, constitute a recommendation or offer to sell, or solicitation of any offer to buy, securities, or any other financial instrument, or a solicitation for any other action of the recipient. dv01 (the “Company”) disclaims any and all liability relating to a decisionbased on or for reliance on this document. The information, estimates, forecasts or opinions included in this document are supplied foryour private use and information, and are for discussion purposes only. The information contained herein shall not be deemed toconstitute investment advice and should not be relied upon as the basis for a decision to enter into any transaction now or in thefuture. By providing this document, the Company is not acting and shall not be deemed to be acting as an investment adviser. Anyperson considering an investment should seek independent advice on the suitability of the particular investment and should (i) consulttheir financial, accounting, tax and legal advisors prior to any investment; and (ii) inform themselves as to (a) the appropriateness ofsaid investment, (b) the legal requirements within their own jurisdictions for the purchase or holding of said investment, (c) any foreignexchange restrictions which may affect them, and (d) the income and other tax consequences which may apply in their own jurisdictions relevant to the purchase, holding or disposal of any securities acquired as a result of such an investment. The informationprovided in this document does not constitute, and may not be used for the purposes of, an offer to sell or the solicitation of an offer tobuy shares of any security of the Company or any affiliate.The Company makes no representation or warranty, express or implied, as to, or assumes any liability responsibility for, the accuracy,reliability or completeness of any information whatsoever contained herein, including without limitation any information supplieddirectly by the Company, any information supplied by third parties and included herein, and any information, estimates, forecasts oropinions prepared on the basis of any of the foregoing. The Company shall not be in any way responsible or assume any liability for anyact or omission made by any person in reliance on this document or any information contained herein. Although some informationherein has been provided by the Company, the information herein is based on information furnished by third parties, the accuracy andcompleteness of which has not been verified by the Company or any other person. These materials may also contain historical marketdata; however, historical market trends are not reliable indicators of future market behavior. Any historical investment results of anyperson or entity described in this material are not indicative of the future investment results. Such results are intended only to givepotential investors information concerning the general experience of the relevant person or entity are not intended as a representationor warranty by the Company or any other person or entity as to the actual composition of or performance of any future investments orother financially-related indicators.This report is provided subject to the terms and conditions of any agreement that the clients may have entered into with the Company.The information is private and confidential and for the use of the clients only. For the sake of protection to persons or investors otherthan the clients where the former are not authorized to receive this report, this report must not be reproduced in whole or in part byany means except for the personal reference of the clients. No part of this material may be reproduced, distributed or transmitted orotherwise made available without prior consent of the Company. Additionally, the content, data and information presented in thisreport is expressly protected under and subject to U.S. copyright law, with all rights arising thereunder vesting in the Company. Thetrademarks and service marks contained herein are the property of their respective owners. Any unauthorized use or disclosure isstrictly prohibited. The Company may pursue legal action if the unauthorized use results in any defamation and/or reputational risk tothe Company.12support@dv01.co 646-854-5258 915 Broadway, Suite 802, New York, NY 10010
An effective rep line analysis tries to divide the portfolio into granular enough cohorts to capture the diverse characteristics of the loans in the pool, while also minimizing the number of rep lines needed. However, the effectiveness of rep line analysis has not been measured or studied quantitatively, particularly in online lending. We set out