Transcription
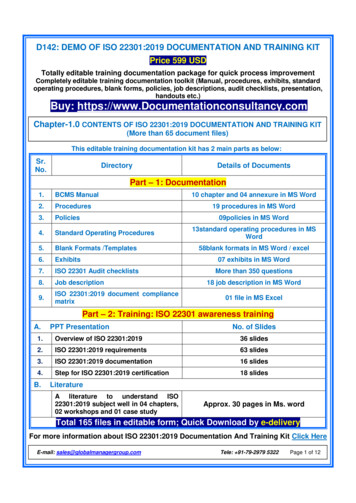
Phylogenetic methodsfor taxonomic profilingSiavash MirarabUniversity of California at San Diego (UCSD)Joint work withTandy Warnow, Nam-Phuong Nguyen,Mike Nute, Mihai Pop, and Bo Liu
Phylogeny reconstruction pipelinegene equencinggene 2CTGAGCATCGCTGAGCTCGATGAGCTCCTGACACGgene ATAATGGCACGCCTAAGCTACCACGGAT2
Phylogeny reconstruction pipelineStep 1: Multiplesequence ene 1gene CCGACTGC-CCCCGAATGC-CCCCG-CTGCACACGGMSAgene 2gene TGAGC-TCGATGAGC-TCCTGA-CAC-Ggene 1000gene AGCTAC-CACGGAT2
Phylogeny reconstruction pipelineStep 2: Species tree reconstructionApproach 1: ConcatenationOrangutanChimpanzeesupermatrixgene 1Sequencinggene CCGACTGC-CCCCGAATGC-CCCCG-CTGCACACGGMSAgene 2gene e AC-CACGGATMSAgene 1000Bioinformaticprocessinggene ACGCCTAAGCTACCACGGATHumanGene tree estimationgene 1samplesgene 1gene GC-TAC-CACGGATApproach 2: Summary methodsgene 2Step 1: Multiplesequence alignmentgene CCCGATGAGC-TC-CTGCACACGGCTGA-CAC-GHuman
Phylogeny reconstruction pipelineStep 2: Species tree reconstructionApproach 1: ConcatenationOrangutanChimpanzeesupermatrixgene 1Sequencinggene CCGACTGC-CCCCGAATGC-CCCCG-CTGCACACGGMSAgene 2gene e AC-CACGGATMSAgene 1000Bioinformaticprocessinggene ATGGCACGCCTAAGCTACCACGGATHumanGene tree estimationgene 1samplesgene 1gene GC-TAC-CACGGATApproach 2: Summary methodsgene 2Step 1: Multiplesequence alignmentgene CCCGATGAGC-TC-CTGCACACGGCTGA-CAC-GHuman
Phylogeny reconstruction pipelineStep 2: Species tree reconstructionApproach 1: ConcatenationOrangutanChimpanzeesupermatrixgene 1Sequencinggene CCGACTGC-CCCCGAATGC-CCCCG-CTGCACACGGMSAgene 2gene llaHumanGene tree estimationgene 1samplesgene 1gene GC-TAC-CACGGATApproach 2: Summary methodsgene 2Step 1: Multiplesequence alignmentgene ocessinggene 1000gene TAC-CACGGATMSAgene CACGGATATGGCACGAHumanStep 3: Phylogenetic placementgene e -CACGGAT-ACATGGCT-----GorillaHumanChimpgene ChimpHumanOrang.
Phylogeny reconstruction pipelineStep 2: Species tree reconstruction— PASTA— UPPApproach 1: ConcatenationOrangutangene 1Sequencinggene CCGACTGC-CCCCGAATGC-CCCCG-CTGCACACGGMSAgene 2gene GC-TCGATGAGC-TCCTGA-CAC-GMSAgene ch 2: Summary methodsGene tree estimationgene 1gene 1gene CCCGATGAGC-TC-CTGCACACGGCTGA-CAC-Ggene 2Step 1: Multiplesequence cprocessinggene 1000gene TAC-CACGGATMSAgene CACGGATATGGCACGAHumanStep 3: Phylogenetic placementgene e -CACGGAT-ACATGGCT-----GorillaHumanChimpgene ChimpHumanOrang.
Phylogeny reconstruction pipelineStep 2: Species tree reconstructionSta s calbinning— PASTA— UPPApproach 1: ConcatenationOrangutangene 1Sequencinggene CCGACTGC-CCCCGAATGC-CCCCG-CTGCACACGGMSAgene 2gene GC-TCGATGAGC-TCCTGA-CAC-GMSAgene ch 2: Summary methodsGene tree estimationgene 1samplesgene 1gene CCCGATGAGC-TC-CTGCACACGGCTGA-CAC-Ggene 2Step 1: Multiplesequence singgene 1000gene TAC-CACGGATMSAgene CACGGATATGGCACGAHumanASTRALStep 3: Phylogenetic placementgene e -CACGGAT-ACATGGCT-----GorillaHumanChimpgene ChimpHumanOrang.
Phylogeny reconstruction pipelineStep 2: Species tree reconstructionSta s calbinning— PASTA— UPPApproach 1: ConcatenationOrangutangene 1Sequencinggene CCGACTGC-CCCCGAATGC-CCCCG-CTGCACACGGMSAgene 2gene GC-TCGATGAGC-TCCTGA-CAC-GMSAgene ch 2: Summary methodsGene tree estimationgene 1samplesgene 1gene CCCGATGAGC-TC-CTGCACACGGCTGA-CAC-Ggene 2Step 1: Multiplesequence singgene 1000gene TAC-CACGGATMSAgene CACGGATATGGCACGAASTRALStep 3: Phylogenetic placementgene 200— SEPP— ng.gene -CACGGAT-ACATGGCT-----GorillaHumanChimpgene ChimpHumanOrang.
Phylogeny reconstruction pipelineStep 2: Species tree reconstruction— PASTA— UPPApproach 1: ConcatenationOrangutangene 1Sequencinggene CCGACTGC-CCCCGAATGC-CCCCG-CTGCACACGGMSAgene 2gene GC-TCGATGAGC-TCCTGA-CAC-GMSAgene ch 2: Summary methodsGene tree estimationgene 1gene 1gene CCCGATGAGC-TC-CTGCACACGGCTGA-CAC-Ggene 2Step 1: Multiplesequence cprocessinggene 1000gene TAC-CACGGATMSAgene CACGGATATGGCACGAStep 3: Phylogenetic placementgene 200— SEPP— ng.gene -CACGGAT-ACATGGCT-----GorillaHumanChimpgene ChimpHumanOrang.
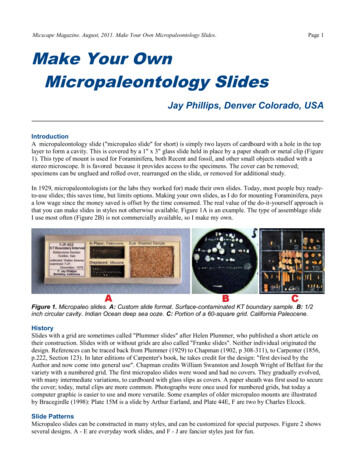
Microbiome analyses usingevolutionary treesACCGCGAGCGGTGGCTTAGAGGAGGcTT ACCTEscherichiacoliFragmentarymetagenomic stisVibriocholeraeA reference dataset of full lengthsequences with an alignment and a treePlace each fragmentary read independently on a reference tree ofknown sequences4
Phylogenetic placement Input: A backbone multiple sequence alignment for a marker gene,including sequences from known species A backbone ML phylogenetic tree, corresponding to thebackbone alignment A collection of (fragmentary, error-prone) query sequences
Phylogenetic placement Input: A backbone multiple sequence alignment for a marker gene,including sequences from known species A backbone ML phylogenetic tree, corresponding to thebackbone alignment A collection of (fragmentary, error-prone) query sequencesOutput: Probabilistic placements of each query sequence on thephylogenetic tree after (locally) aligning the query to the reference
Phylogenetic placement Input: A backbone multiple sequence alignment for a marker gene,including sequences from known species A backbone ML phylogenetic tree, corresponding to thebackbone alignment A collection of (fragmentary, error-prone) query sequences Output: Probabilistic placements of each query sequence on thephylogenetic tree after (locally) aligning the query to the reference Tools: — Alignment: HMMER— Placement: pplacer (Matsen) and EPA (RAxML)
Phylogenetic placement Input: A backbone multiple sequence alignment for a marker gene,including sequences from known speciesSATe-EnabledPhylogeneticPlacementA backbone ML phylogenetic tree, corresponding to thebackbone alignment (SEPP) A collection of (fragmentary, error-prone) query sequences Output: Probabilistic placements of each query sequence on thephylogenetic tree after (locally) aligning the query to the reference Tools: — Alignment: HMMER— Placement: pplacer (Matsen) and EPA (RAxML)
Phylogenetic placement simulationsS. Mirarab et al., PSB. (2012).0.0Increasing rate of evolution
Reference tree
HMM for the alignment step
Ensemble of HMMs
Ensemble of HMMs
Ensemble of HMMs
SATe-Enabled PhylogeneticPlacement (SEPP)Step 1: Align each query sequence to the backbone alignment Use an ensemble of disjoint HMMs instead of using a singleHMM to improve accuracy. The ensemble is created based on the reference tree suchthat each model better captures details of a part of a tree12S. Mirarab et al., PSB. (2012).
SATe-Enabled PhylogeneticPlacement (SEPP)Step 1: Align each query sequence to the backbone alignment Use an ensemble of disjoint HMMs instead of using a singleHMM to improve accuracy. The ensemble is created based on the reference tree suchthat each model better captures details of a part of a treeStep 2: Place each query sequence into the backbone tree,using extended alignment Use divide-and-conquer on the backbone tree to improvescalability to reference trees with tens of thousands of leaves12S. Mirarab et al., PSB. (2012).
SEPP on simulated dataS. Mirarab et al., PSB. (2012).0.00.0Increasing rate of evolution
SEPP on large 16S referencesSimulations:16S bacteria, 13kcurated backbonetree, 13k fragmentsRunning timeMemory
SEPP on large 16S referencesSimulations:16S bacteria, 13kcurated backbonetree, 13k fragmentsRunning timeReal data (with Rob Knight’s lab; Daniel McDonald): EMP: placing 300,000 fragments on the greengenesreference tree with 203,452 sequences8 hours (16 cores) AG: placing 40,000 fragments on the greengenesreference tree with 203,452 sequences10 minutes (16 cores)Memory
Taxonomic Profiling Input: Reference multiple sequence alignments for acollection of marker genes, each includingsequenced species Reference trees for marker genes. We force trees tobe compatible with the taxonomy (not necessary). A metagenomic sample: a collection of fragmentaryreads from many species with different abundances
Taxonomic Profiling Input: Reference multiple sequence alignments for acollection of marker genes, each includingsequenced species Reference trees for marker genes. We force trees tobe compatible with the taxonomy (not necessary). A metagenomic sample: a collection of fragmentaryreads from many species with different abundancesOutput: The taxonomic profile of the teurellaClostridiumAlcanivorax iaCrenarchaeota unclassified%63.19.69.67.64.53.81.20.0
Taxonomic Profiling Input: Reference multiple sequence alignments for acollection of marker genes, each includingsequenced narchaeota unclassified%63.19.69.67.64.53.8Taxon Identification andPhylogenetic Profiling(TIPP)Reference trees for marker genes. We force trees tobe compatible with the taxonomy (not necessary).A metagenomic sample: a collection of fragmentaryreads from many species with different abundancesOutput: laClostridiumAlcanivorax unclassifiedThe taxonomic profile of the sample1.20.0
Algorithmic stepsStep 1: map fragments to 30 “marker” genes using BLAST16Nguyen et al., Bioinformatics (2014)
Algorithmic stepsStep 1: map fragments to 30 “marker” genes using BLASTStep 2: Use SEPP to place reads on the marker trees Take into account uncertainty: use several alignments andplacements on the tree (to reach a predefined level ofstatistical support)16Nguyen et al., Bioinformatics (2014)
Algorithmic stepsStep 1: map fragments to 30 “marker” genes using BLASTStep 2: Use SEPP to place reads on the marker trees Take into account uncertainty: use several alignments andplacements on the tree (to reach a predefined level ofstatistical support)Step 3: Summarize results across genes to get a taxonomic profile Each read contributes to each branch and all branches aboveit proportionally to the probability that it belongs to that branch Results from all genes are simply aggregated as counts16Nguyen et al., Bioinformatics (2014)
Phylogeny reconstruction pipelineStep 2: Species tree reconstruction— PASTA— UPPApproach 1: ConcatenationOrangutangene 1Sequencinggene CCGACTGC-CCCCGAATGC-CCCCG-CTGCACACGGMSAgene 2gene GC-TCGATGAGC-TCCTGA-CAC-GMSAgene ch 2: Summary methodsGene tree estimationgene 1gene 1gene CCCGATGAGC-TC-CTGCACACGGCTGA-CAC-Ggene 2Step 1: Multiplesequence cprocessinggene 1000gene TAC-CACGGATMSAgene CACGGATATGGCACGAStep 3: Phylogenetic placementgene 200— SEPP— ang.gene -CACGGAT-ACATGGCT-----GorillaHumanChimpgene ChimpHumanOrang.
Multiple sequence alignment Input: a (potentially ultra-large) set of input sequencesfrom a single gene Output: a multiple sequence alignment sequence may be full or fragmentaryOptional: co-estimate the alignment and treeRelevance: useful to get very large reference alignmentsand trees with up to hundreds of thousands of leaves
Multiple sequence alignment Input: a (potentially ultra-large) set of input sequencesfrom a single genePASTA sequence may be full or fragmentary Great for treesOutput: a multiple sequence alignment Not good for fragmentary data Optional: co-estimate the alignment and treeRelevance: useful to get very large reference alignmentsand trees with up to hundreds of thousands of leaves
Multiple sequence alignment Input: a (potentially ultra-large) set of input sequencesfrom a single genePASTA sequence may be full or fragmentary Great for trees Output: a multiple sequence alignment Not good for fragmentary data Optional: co-estimate the alignment and tree UPP Good for fragmentary data Relevance: useful to get very large reference alignmentsand trees with up to hundreds of thousands of leaves
UPP Steps Step 1: randomly select a “small” subset of fulllength sequences (e.g., 1000) as backbone. Step 2: align the backbone using other tools(e.g., using PASTA) Step 3: Use a SEPP-like approach to align theremaining sequences into the reference Note: leaves some “insertion” sites unaligned
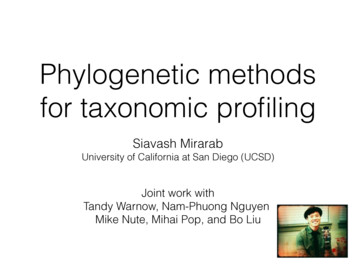
PASTA: Iterative divide-and-conqueralignment and tree sEstimatetreeABCDEEMergesub-alignmentsS. Mirarab et al., Res. Comput. Mol. Biol. (2014).S. Mirarab et al., J. Comput. Biol. 22 (2015).20ACBDE
PASTA on Greengenes Testing the performance of PASTA for building green genes 16Sreference tree Q1: Ability to distinguish samples using unifrac? 88 soils infant-time-series moving pictures global gut Q2: Speed:(16 cores)unweightedGG PASTA0.78 0.780.55 0.55728 72452.9 51.1 weightedGG PASTA0.75 0.740.37 0.422188 243979 7297% tree ( 99,322 leaves): 28 hours99% tree (203,452 leaves): 49 hoursWith Daniel McDonald (Knight’s lab) and Uyen Mai
Software availability PASTA: github.com/smirarab/pasta(internally uses FastTree, Mafft, HMMER, and OPAL) SEPP: github.com/smirarab/sepp(internally uses pplacer and HMMER) UPP: E.UPP.md(internally uses HMMER) TIPP: E.TIPP.md(internally uses pplacer and HMMER) Species tree estimation: Statistical binning: https://github.com/smirarab/binning ASTRAL: github.com/smirarab/ASTRAL
Acknowledgments Nam-Phuong Nguyen Rob Knight’s labTandy Warnow’s lab: Mike Nute Daniel McDonladMirarab labMihai Pop’s lab: Bo LiuUyen Mai
University of California at San Diego (UCSD) Joint work with Tandy Warnow, Nam-Phuong Nguyen, Mike Nute, Mihai Pop, and Bo Liu . Phylogeny reconstruction pipeline 2 Sequencing samples gene 2 . AGC-CACGC-CATA .