Transcription
SECRETS OF PENNY STOCK TRADINGINTRODUCTIONPenny Stocks can be a difficult niche to follow. However, successfully breaking theminto your portfolio, using the right method, can be very easy, fun, and most of all,profitable. Most traders do not understand the nature of penny stocks and think they arefar too esoteric to trade.Penny Stocks follow patterns just as the big blue cap companies do. But they are adifferent beast all together. They are much quicker; they can strike at anytime andtherefore require a different kind of trader to nab their profits. This is also why they canbe much more advantageous as well, earning you MORE PROFITS DAILY.So what can this manual do for you?In this manual Secrets of Penny Stock Trading, you will learn three key strategy points ofa method called The Warrior’s Way. First, The Mind, this is the knowledge you willneed in order to form your own penny stock strategy. Next, The Weapon, these are thetools necessary towards implementing your strategy. This will show you the bestresources, brokerage companies, communities, ect. Last, The Soul, once you have astrategy in place, you will be constantly perfecting it. I will show you how to do thiseasily and efficiently.Let’s get started!THE WARRIOR’S WAYThere are three key strategy points when using the warrior’s way.1. The Mind (The Knowledge)2. The Weapon (The Tools)3. The Soul (The Discipline)THE MIND: FORMING A STRATEGYDay Trading AND Swing TradingWhat kind of trader are you?I assume that you want to get into penny stocks since you are reading this manual. Ingeneral, because of the quick rise and fall in price action with these kinds of stocks, theyare not going to allow for long term investing. Get in, allow returns, or cut losses and getout. There are two main methods recommended for this ethos, Swing Trading and DayTrading.
Swing Trading – Swing trading is essentially trend trading. When thestocks trend looks and acts like an uptrend you buy based on certaintechnical analysis. If the trend looks like a downtrend you sell based onthe same analysis. The time frame of a Swing trade may be anywhere from2 days to months. I recommend keeping your time frame short whenputting together you strategy.Day Trading – Day trading is trading that occurs within the day orintraday. A day trader will not want to hold onto a stock for more than acouple of days. Instead they will trade many stocks throughout the day.This can be dangerous without the proper discipline and very profitablewith the proper discipline. This kind of trading will use a combination ofboth technical and fundamental analysis.*THE TRADE BLOCKADE – Before I go any further I want to talk about the two mainproblems you are going to run into when trading penny stocks.1. THE PATTERN DAY TRADER RULE- The first problem you’re going to runinto is the pattern day trader rule. This rule states that with less than 25,000 inyour account, a trader can only make 3 complete day trades per trading week.There are several creative ways around this rule however, such as having morethan one brokerage account so 3 trades becomes 6, or however many brokerageaccounts you decide to have. I recommend using a combination of swing tradingtactics with selective day trades through out the week to combat this rule.2. HARD TO BORROW STOCK- This may or may not affect you as muchdepending on the kind of method you ultimately create. However if you want toShort Sell a Penny stock. It will most likely be an HTB stock. This means thebrokerage only has so much stock to give away to their customers. You will eitherhave to reserve shares at the beginning of the trading day, or call you brokerage atthe time you want to borrow it. This sounds like it could be nerve-wreaking, and itcan be, but there are brokerages out there that make this easy. I will talk moreabout this in The Weapon section.Before we get into Technical Analysis, let’s first look briefly at some Market Theory.
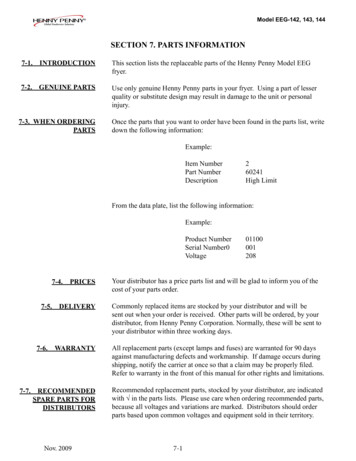
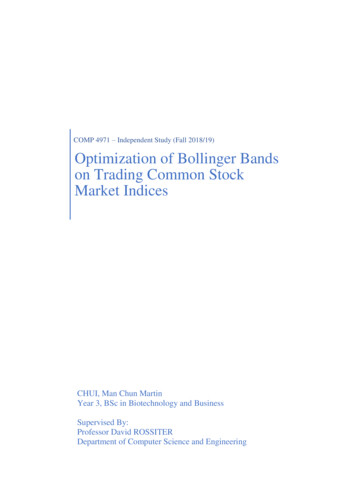
The Four Trading Stages Trade Stock Trends NOT Trading Ranges.What this means is to simply recognize the trend as a whole. Below we can seethat a good sign of an uptrend is when a stock makes a new HL or Higher Lowafter a HH or Higher High has already occurred.If the stock continues past the previous HH or Higher High from the first HL thenwe can assume, with the help of other indicators, that this stock is goingsomewhere and is in a trend.Stage 2 is an uptrend that is characterized by a series of higher highs (HH) and higherlows (HL).Stage 4 is a downtrend that is characterized by a series of lower highs (LH) and lowerlows (LL).*SIMPLE RIGHT! Well not so much, this may be simple if you’re looking at highlyvolatile stocks. However WATCH OUT for Stage 3. This is know as sideways action andcould last for years in low volatile stocks.Technical Analysis AND Fundamental AnalysisWhat is Technical and Fundamental Analysis?
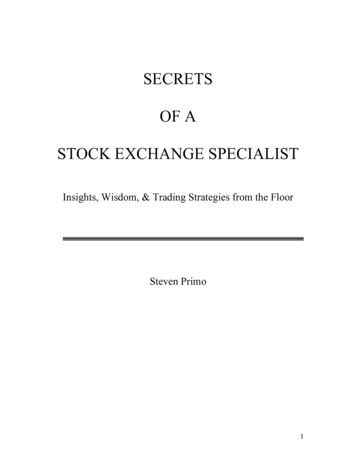
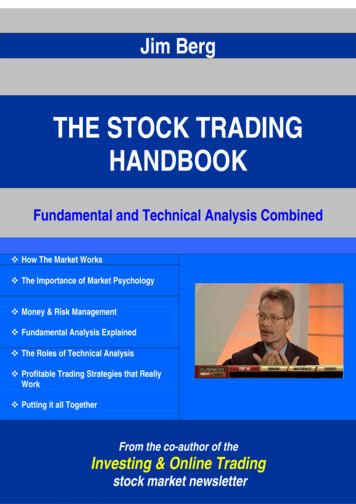
Technical Analysis - Technical Analysis essentially uses a stocks pastperformance as a way of predicting its future movement. There seems to behundreds of technical indicators to choose from. I will show you the ones thatare recommended and how to use them.Fundamental Analysis – This is how your father use to do it. You look at theNews, Earnings reports, FDA approval, ect. This can also be a helpful way ofanalysis, however it is important to know that with the information age alsocame the misinformation age. Many of these companies use manipulation andhype to control the stock. You must be aware of these tactics and take note ofthem. Support and ResistanceSupport and Resistance is arguable the most important technical indicator forpredicting whether a stock is breaking out or breaking down into a new trend.Whether it’s the most important indicator, it is most definitely the FIRST indicatoryou are going to look towards when deciding to enter into a position.Support – The price level where there is enough demand should price reach thatlevel to keep prices from falling further.Resistance – The price level where there is not enough demand should pricereach that level to keep prices rising further.The picture below shows support and resistance and the laws of supply and demand.Support becomes resistance and resistance becomes support if prices break through theseareas. Here is an example:
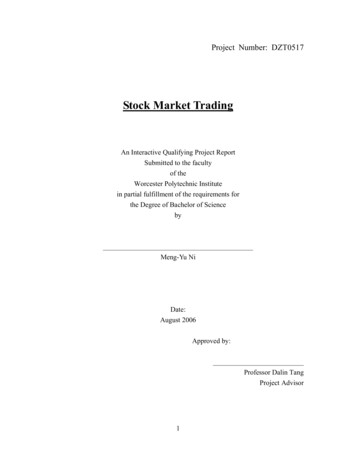
As a Swing Trader/Day Trader these breaks are what we live for.In the example above you can see we have a red line and a green line. At the beginning ofour timeline the green line is our support and the red our resistance. At (1) we see thestock break down through the support line signifying a downtrend. The green line thenbecomes resistance. At (2) we as traders would be watching this stock to go back to theresistance line, which it does. If it breaks out through that line, then we would buy thebreak out.There are also varying degrees of support and resistance.The more times a support line or resistance line is hit and bounces back the weaker thatline becomes. When this happens, the chances of a break out or break down is morelikely to occur.Let’s look at the chart below.
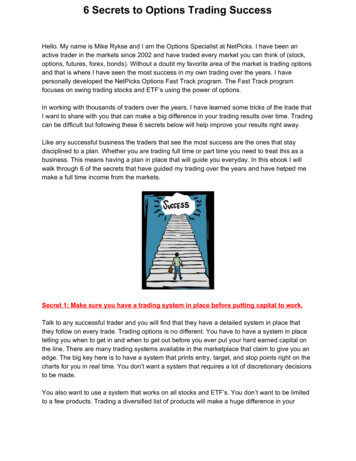
Now looking at the crudely drawn arrows you can see the support level bounce threetimes. This could be indicative of a break down. You can see it did soon breakdown butquickly bounced back. The important thing is to use the line as your pivot point so thatyou can enter into a position when a break does occur.*Never get into a position before a breakout or breakdown. Get into the position when ithappens.*It might sound ridiculous but many breakouts and breakdowns happen on nice wholenumbers. Think about where the average investor might like to set his stops. Look at thestock above. The first resistance and support line is on 2.00 exactly. The next supportline occurs on 2.25. The next resistance line is at 2.75. Time Frame Analysis Look at many different time frames when looking at a stocks chart. Start with long term charts to see if a trend matches with shorter and shorterterm trends. As well as looking for support and resistances. Market timing There are certain time frames through out the day you should be paying closeattention to. When the market moves so do you. The Morning- There is a pre-market, pay attention to that because when theopening bell rings at 9:30, this is when big moves will happen. At 10:00 thereaction to those moves will occur. You can make money on both. The Afternoon – Right after lunch at 1:30 is generally when the next big moveshappen. 2:15 is the reaction to those moves. WATCH OUT for mid-day fades. The Evening – From 3:30 to the close at 4:00 is when the next move happens.The reaction can be the next day morning. Recommended Technical Indicators Chart Patterns – I am not going to go in depth on charting patterns because thereare so many of them and they are so commonly used, such as the double top,double bottom, head and shoulders, ect., that it would be redundant for me todiscuss them here. I recommend you research them and get familiar with whatthey look like so you can spot a pattern easily when trading.
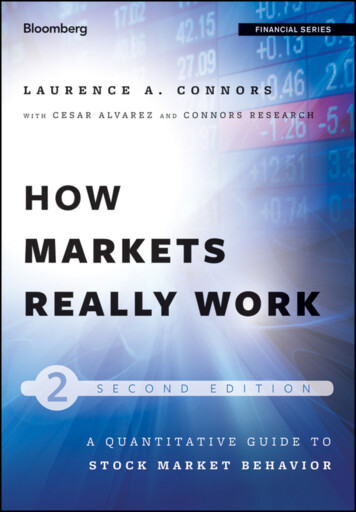
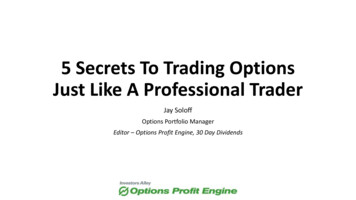
Stochastic- Stochastics are an oscillating technical indicator that looks like this-It runs from 0-100. When the line runs above 80 it means the stock is overbought, if theline is below the 20 it means the stock is oversold.When the lines cross as seen above, circled in the green for example you can see the linescross. When this happens we can assume the stock is going to rise.Using this combined with what we already know about support and resistance. Let’s saythe stock crosses the resistance line, at the same time the stochastic is crossing below the20 telling us it’s oversold. This is a good indication to buy based on these indicators.*Stochastic are a very helpful tool in knowing when to act and when to wait.* I recommend using both slow and fast stochastic together. Moving Averages – Moving Averages is another vital indicator when trading.Moving averages is a line smoothing out the previous data of a stock into anaverage based on a specific time frame.Incorporate this into your technical analysis. 10 period Simple Moving Average (SMA) 30 period Exponential Moving Average (EMA) 200 period SMA (Separates Bull and Bear Territory)The crossed moving averages will look something like this.Look for these to cross to signal trend changes.
*Focus on long positions only when the 10 SMA is above the 30 EMA. Focus on shortpositions only when the 10 SMA is below the 30 EMA.*A good idea is to color the 10 SMA GREEN and the 30 EMA RED. This way it will bea simple indication. Green over Red Bullish / Red over Green Bearish Candlesticks- Last but certainly not least are candlesticks. Candlesticks areanother essential piece of the technical analysis puzzle. Candlesticks show thepulse of the market. It can tell you whether it’s dead or a volatile beast. In fact Ihave heard of many traders that say candlesticks are the most important piece ofdata a trader can use.Looking at the bare bones of the market, there are only two kinds of people. Bullsand Bears. Buyers and Sellers. The market asks us everyday, who is going to be incontrol of my price action. Candlesticks can show you this.Candlesticks are simple to use. You can see the high and low. The spine is called the wickthis is the range of the price action. You can also see the open and close. The middlesection is called the body. If the candlestick closes below the price it opened at, thisshows the seller have gained control of the price action.Lets look at this chart below.
As you can see candlesticks can show us where a trend is going. When ever you see longcandlesticks it is indicative of clear decision which generally leads towards an upward ordownward trend. When you see short candlesticks this shows indecision which can leadtowards a trend reversal, or dead sideways action.*Research the many different kinds of candlestick patterns and formations that indicatechanges in a stocks pattern.*If you’re going to spend all that time looking at charts I recommend looking atcandlestick charts.Ok, well technical analysis is all good and fine for stocks with an established charthistory; but what about this new penny stock that everyone says is going to blow uptomorrow.Before we get into Fundamental Indicators I first want to talk about the nature of PennyStocks and why they either breakout or breakdown.Technical/Fundamental – We’ve already discussed this kind as a breakout orbreakdown do to new highs or lows where technical indicators apply. We areabout to get into fundamental indicators, however likewise, a company with goodfundamental business will get good news.Hype – This is very common among new emerging penny stocks. This is the spamin your mailbox telling you a new stock is going to jump 500% in the next day.This kind of message is passed on through message boards and newsletters thatyou may have signed up for. This is all in the hopes of getting novice investors tobuy so the stock goes up. Many times it does go up significant amounts, howeverit can not last this is what is known as a Pump and Dump. LEARN THIS WELL,because you can make money on both the long side and short side of these stocks.Squeeze – Watch out for these because they can catch investors off guard. This iswhen there are panicking shorts, Margin Buying or Selling.Now let’s talk about Fundamental Indicators.Fundamental IndicatorsNews And Earnings Reports – This is your basic way of gettinginformation about a particular company. You can go to Yahoo Finance.MSN’s Money Central, ect. Do not be swayed by news and earningsreports however. You must be conscious of how the pulse of the market isgoing to react to these things. First watch how a stock is affected by anearnings report and make note of it.The Use of Spam – The reason I wanted to talk about Pump and Dump isbecause I wanted you to know how to control that misinformation. Mostpeople think Spam is annoying and useless. In this case it can actually help. page
Swing Trading – Swing trading is essentially trend trading. When the stocks trend looks and acts like an uptrend you buy based on certain technical analysis. If the trend looks like a downtrend you sell based on the same analysis. The time frame of a Swing trade may be anywhere from 2 days to months. I recommend keeping your time frame short when