Transcription
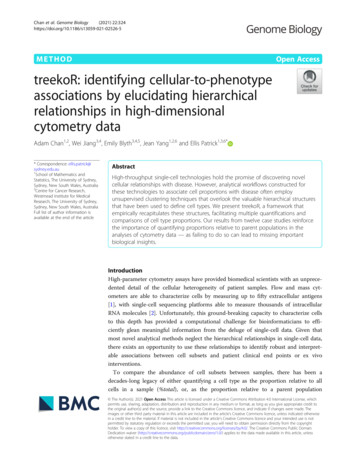
Chan et al. Genome Biology(2021) THODOpen AccesstreekoR: identifying cellular-to-phenotypeassociations by elucidating hierarchicalrelationships in high-dimensionalcytometry dataAdam Chan1,2, Wei Jiang3,4, Emily Blyth3,4,5, Jean Yang1,2,6 and Ellis Patrick1,3,6** Correspondence: ellis.patrick@sydney.edu.au1School of Mathematics andStatistics, The University of Sydney,Sydney, New South Wales, Australia3Centre for Cancer Research,Westmead Institute for MedicalResearch, The University of Sydney,Sydney, New South Wales, AustraliaFull list of author information isavailable at the end of the articleAbstractHigh-throughput single-cell technologies hold the promise of discovering novelcellular relationships with disease. However, analytical workflows constructed forthese technologies to associate cell proportions with disease often employunsupervised clustering techniques that overlook the valuable hierarchical structuresthat have been used to define cell types. We present treekoR, a framework thatempirically recapitulates these structures, facilitating multiple quantifications andcomparisons of cell type proportions. Our results from twelve case studies reinforcethe importance of quantifying proportions relative to parent populations in theanalyses of cytometry data — as failing to do so can lead to missing importantbiological insights.IntroductionHigh-parameter cytometry assays have provided biomedical scientists with an unprecedented detail of the cellular heterogeneity of patient samples. Flow and mass cytometers are able to characterize cells by measuring up to fifty extracellular antigens[1], with single-cell sequencing platforms able to measure thousands of intracellularRNA molecules [2]. Unfortunately, this ground-breaking capacity to characterize cellsto this depth has provided a computational challenge for bioinformaticians to efficiently glean meaningful information from the deluge of single-cell data. Given thatmost novel analytical methods neglect the hierarchical relationships in single-cell data,there exists an opportunity to use these relationships to identify robust and interpretable associations between cell subsets and patient clinical end points or ex vivointerventions.To compare the abundance of cell subsets between samples, there has been adecades-long legacy of either quantifying a cell type as the proportion relative to allcells in a sample (%total), or, as the proportion relative to a parent population The Author(s). 2021 Open Access This article is licensed under a Creative Commons Attribution 4.0 International License, whichpermits use, sharing, adaptation, distribution and reproduction in any medium or format, as long as you give appropriate credit tothe original author(s) and the source, provide a link to the Creative Commons licence, and indicate if changes were made. Theimages or other third party material in this article are included in the article's Creative Commons licence, unless indicated otherwisein a credit line to the material. If material is not included in the article's Creative Commons licence and your intended use is notpermitted by statutory regulation or exceeds the permitted use, you will need to obtain permission directly from the copyrightholder. To view a copy of this licence, visit http://creativecommons.org/licenses/by/4.0/. The Creative Commons Public DomainDedication waiver ) applies to the data made available in this article, unlessotherwise stated in a credit line to the data.
Chan et al. Genome Biology(2021) 22:324(%parent) [3–5]. The latter of these quantifications is derived naturally from the waythat cell subsets have traditionally been annotated via a process called sequential manual gating [6]—where 2D scatter plots are drawn using certain markers and gated toidentify cell populations in a sequential manner. For example, regulatory T cells (Tregs)could be identified by first gating out CD3 and CD4 cells to identify CD4 T cellsand then further gating on CD25lo and CD127 to isolate the CD4 Tregs [7]. Thisgating strategy naturally lends itself to quantification of cell types relative to their parent lymphocyte populations. These quantifications are robust to changes in unrelatedsubsets. The main drawbacks of this method however are its reliance on timeconsuming manual gating, which has become impractical for high-parameter assays [8],and the substantial reliance on expert knowledge which may bias analysis towardsknown and expected relationships.As an alternative cell type identification strategy to manual gating, unsupervised clustering of cells has been used to circumvent the challenges of sequentially gating highdimensional cytometry data. These automated methods are able to stratify cell subsetswithout necessarily having a predetermined hypothesis or sequential gating strategy.Many methods, including SPADE [9], Citrus [10], FlowSOM [11], Phenograph [12],SC3 [13], and scClust [14] have been utilized frequently in the analysis of highdimensional cytometry data to identify cell populations. While they have significantlyimproved the efficiency in which scientists can analyze these datasets, typical analysesemploying these methods only explore the changes in cell types as a %total, neglectingthe complex hierarchical proportions inherent in single-cell data. In other words, thesemethods fail to measure cell types as a %parent, which cytometry analysts have traditionally used in manual gating workflows.A number of unsupervised clustering methods and data-driven workflows have beendeveloped to explore the hierarchical nature of cytometry data. SPADE and FlowSOMutilize minimal spanning trees over clustering as a visualization tool. Citrus employshierarchical clustering and regularized supervised learning algorithms to identify stratifying populations of cells on each level of aggregation. The method treeclimbR [15]aims to pinpoint an ideal resolution of cell populations via a hierarchical tree. Althoughthese methods acknowledge the importance of visualizing the hierarchical aspect ofsingle-cell cytometry data, they do not typically incorporate such information in theirassociation analysis. That is, they do not by default quantify the abundance of cell typesas a %parent and test if these compositions are associated with a treatment or phenotype of interest.To this end, we have developed treekoR, a novel framework that makes use of celltype identification from unsupervised clustering techniques while acknowledging thehierarchical nature of single-cell cytometry data to discover robust and interpretable associations between cell subsets and patient outcomes. TreekoR achieves this by (1) algorithmically deriving the hierarchy of cell type clusters, followed by (2) incorporatingthis hierarchical information via measuring the %parent for each cell type. These derived proportions can then be used in significance testing and classification models todetermine associations with clinical outcomes. Further to this, treekoR provides a general framework that is flexible to the clustering approach, hierarchical aggregationmethod, and type of significance testing used. This framework allows analysts toPage 2 of 14
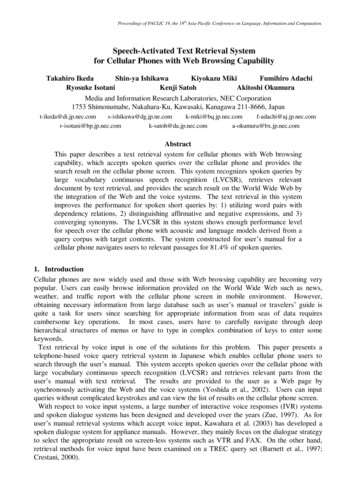
Chan et al. Genome Biology(2021) 22:324Page 3 of 14generate insight from the complex hierarchical relationships present in single-cell cytometry data, which are often overlooked with existing automated clustering methods.ResultstreekoR algorithmically derives cell type hierarchies to quantify %parentWe present treekoR, an analytical framework that recognizes and incorporates the hierarchical relationships inherent in cytometry data. The treekoR package is implementedin R and uses an automated workflow to identify cellular associations with a patientoutcome through five steps (Fig. 1): (1) cluster the data using an automated method,(2) aggregate clusters into a tree using a hierarchical clustering algorithm, (3) calculatethe %total (the proportion of a cell type relative to all cells in a sample) and %parent(the proportion of a cell type relative to a parent population of cells, in this case thecells in the parent node) of cells in each node in the tree, (4) perform significance testsusing both of these proportions against a clinical end point, and (5) visualize the significance results on the tree. The %parent calculated by treekoR aims to emulate the proportions naturally derived when using sequential manual gating, which are not typicallycalculated in workflows exclusively using unsupervised clustering methods. Our comparative procedure uncovers important associations with a clinical end point of interestacbCluster cellsNodeParent NodeConstruct hierarchyof clustersCalculate proportions of cells in each node relative toparent and relative to allFor each sample:For each node in the tree:dPerform significance testing using calculatedproportionse%parent %total # cells in node# cells in parent node# cells in node# cells in sampleVisualise significant clusters/cell typesacross the hierarchical treePatient OutcomeColumnz score2ResponderNon responderTest Statistic: %parent2110 1 20TestStatistic1 10 1 2 2Proportion 2 1012Test Statistic: %totalisTipFALSEMarker ExpressionCluster FreqTRUEFig. 1 treekoR helps to extract insight from cytometry data through deriving a hierarchy of cell clusters andmeasuring proportions to parent. a An example t-SNE plot showing clustering of single-cell data. b Hierarchical treeconstructed using HOPACH algorithm on the cluster median marker expressions. c Definition of proportions to parentand proportions to all defined according to the organization of the hierarchical tree. d Significance testing isperformed using both types of proportions calculated, testing for difference between the patient clinical endpoint ofinterest. e Visualization of the significance testing results. On the left, a scatterplot of each node in the hierarchical treewith the test statistic calculated using the %total (x-axis) vs. the test statistic calculated using the %parent (y-axis). Onthe right of the scatterplot, the hierarchical tree is colored with the test statistics: the nodes colored by the test statisticusing %total and the branches of the nodes colored by the test statistic using %parent. An example of acorresponding node between the two graphs is highlighted in blue. The heatmap plots the median markerexpression of the leaf nodes to assist in identification of the corresponding cell clusters
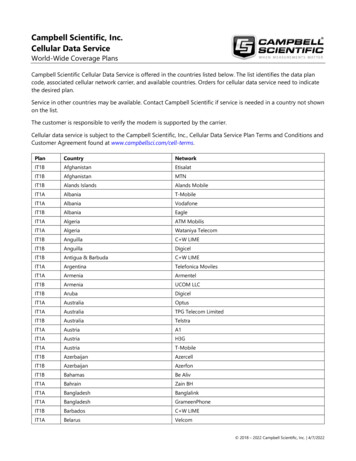
Chan et al. Genome Biology(2021) 22:324Page 4 of 14by visualizing both quantifications of cell type proportions derived from the data. Further details are provided under “Methods.”treekoR generates biological insight exclusive to %parent in example cytometry datasetsWe illustrate the ability of treekoR to generate additional biological insight by applyingthe framework to a CyTOF study of latent Cytomegalovirus (CMV) [16]. After clustering cells into one hundred cell subsets, quantifying the %total and %parent for each,and testing for associations between CMV positivity and %total or %parent (Fig. 2a); weobserved a reduction in CD4 Tem cells in CMV-positive patients using %parent (p Testing difference between patients with and without latent CMVaFALSELeaf ClusterbTRUECD4 TemCD8 CD127- Tem%total%totalp 0.986p 0.260.030.040.02Test Statistic: %parent30.020.010.000.000%parent (CD8 CD127- Tem, CD8 , CD127 Tem)%parent (CD4 tem, CD4 Tcm)p 6.1e 051.0p 0.00151.00.80.8 3CD8 CD127- TemCD4 Tem0.60.60.4 60.4 6 3036Patient OutcomeTest Statistic: %totalCMV neg.CMV pos.Testing difference between COVID-19 patients and healthy controlscdTestStatisticColumn z score 202 50Leaf ClusterFALSEeTRUE105Test UsedHLA-DR , CD38 T testWilcox testTest Statistic: %parent5treekoR %parent0treekoR %total 5De Biasi et al.0.02.55.07.5 log10(p value) 10 10 50510Test Statistic: %totalfHLA-DR CD38 De Biasi et al.treekoR %totaltreekoR %parent0.150.15HLA-DR , CD38 CCR7YCD 5812 5 PCD CD 7 V E 27 25 660 HCCD D2 Y7 V76 H3 8 B 63 3 R7 6 P H63 10 C7 E HC AP CDCD D3 CA H4 8 U 750CD CD4 R66 V52 H45 5 V 0 A 5 RA 52 P H5 CCD CD B52 K H8 57 5 rO R7 V FI H12 45 TC 0 CD APC PB HHL 9 A H70A 5VI PD D UV4 0 HTA 1 R0LI Y7 UV 5 TY 10 6 HIR P 75 C84 5 H0 .5A7 H90 ient OutcomeCOVIDControlFig. 2 Measuring %parent can provide additional insight over %total. a Scatterplot of test statistics with thecell clusters in differentiating between latent CMV infection patients. Highlighted clusters are significantusing %parent, while not significant using %total. b Comparative boxplot of the proportions of highlightedcell clusters, between patients with CMV and without CMV, with the %total (upper panel) and %parent(lower panel). c A heatmap generated using treekoR on a CD8 T cell compartment to predict healthy vsCOVID-19, containing a hierarchical tree of cell clusters colored by the test statistic using the corresponding%total (nodes) and %parent (branches). The heatmap is colored by the scaled cluster median expressionvalues characterize leaf nodes in the tree. d Scatterplot of test statistics of each cell cluster with test statisticfrom using %total (x-axis) vs. test statistic from %parent (y-axis). The HLA-DR CD38 cluster highlightedhas a larger test statistic when differentiating between COVID-19 patients and healthy control using%parent than %total. e Comparison of log10 of p values of a HLA-DR CD38 subset for %total, %parent,and manually gated proportions from De Biasi et al. from a t-test (pink) and Wilcoxon test (green). fComparative boxplot of a HLA-DR CD38 subset, with the %total (upper left panel), %parent (lowerpanel), and manually gated proportions (upper right panel) between COVID-19 and healthy patients
Chan et al. Genome Biology(2021) 22:3246.1 10 5, FDR 3.33 10 3), yet no association was observed using %total (p 0.9,FDR 0.99). The higher proportion of CD4 Tem relative to its parent cluster (CD4 Tem and CD4 Tcm) in CMV-negative patients as compared to CMV-positive patients is in keeping with known effector memory cell function in cytokine secretion andviral clearance. Similarly, observed a nominally significant negative association betweenCMV positivity and CD8 CD127 Tem cells using %parent (p 1.5 10 3, FDR 3.5 10 2), but not with %total (p 0.26, FDR 0.69) (Fig. 2b). This lower proportion ofCD8 CD127 Tem cells relative to its parent (CD8 CD127 and CD8 CD127 Tem) in CMV-positive patients as compared with CMV-negative patients suggests arole for differential CD127 expression in chronic/persistent infection. Together, thissuggests that if the %parent of these cell types had not been measured, we would havebeen unable to discover the cellular relationships between CD4 Tem and CD8 CD127 Tem with CMV infection.When applied to a flow cytometry dataset profiling CD8 T cells in COVID-19 patients and healthy controls [4], treekoR highlighted a highly activated HLA-DR CD38 CD8 T cell subset whose %parent provided a more robust association withCOVID-19 response than its %total. After applying FlowSOM to cluster cell types (Fig.2c), we discovered a HLA-DR CD38 CD8 T cell whose %parent is greater inCOVID-19 patients than healthy controls (p 3.19 10 10, FDR 2.76 10 8) (Fig.2d). This strong association is observed regardless of whether the %parent is modelledas continuous or count data (Additional file 1: Figure S1). However, this populationonly appeared marginally associated with COVID-19 response using %total (p 1.49 10 2, FDR 7.6 10 2). In contrast, De Biasi et al. had reported a manually gated HLADR CD38 CD8 T cell population changing when using %total (p 9.70 10 8).The difference in conclusion between using %total from FlowSOM and the manuallygated population from De Biasi et al. is solely attributed to our use of a t-test and DeBiasi et al.’s use of the Wilcoxon rank sum test (Fig. 2e), which is robust to the outliersobserved in the %total quantification (Fig. 2f). When a Wilcoxon rank sum test is usedon our %total (p 1.55 10 5, FDR 1.12 10 3) and %parent (p 1.15 10 8, FDR 9.96 10 7), the association is also observed, but not observed when a t-test is usedon De Biasi et al.’s manually gated population (p 2.57 10 2). The presence of thisassociation in treekoR’s %parent regardless of the significance test used illustrates thatquantifying the proportion of HLA-DR CD38 to a parent population (HLA-DR CD38 and HLA DR CD38 ) can adjust for large fluctuations in cell type compositions and allow subtle changes in proportion to be robustly quantified. Across both theCOVID-19 and CMV case studies, we highlight two perspectives of cell type proportions, %total and %parent, which offer biological information that may be potentiallymissed if only one was measured.The %parent of cell types yields strong associations with clinical outcomes across severaldatasets in our benchmarkWe observed a greater discrimination between binary outcomes through quantifyingproportions as %parent than %total in several datasets. We compared twelve case studies consisting of seven CyTOF datasets, four flow cytometry datasets, and a single-cellRNA sequencing (scRNA-seq) dataset (Table 1). Further, we also used two hierarchicalPage 5 of 14
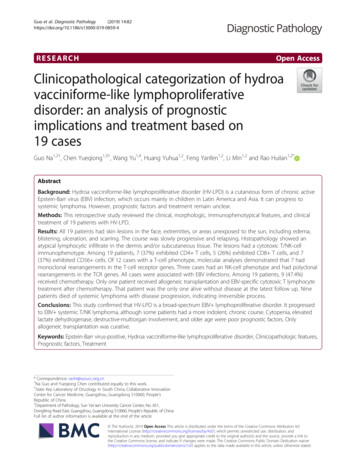
Chan et al. Genome Biology(2021) 22:324Page 6 of 14Table 1 Benchmark datasets. Eleven published datasets were used to compare %total and%parent in significance testing and classification using the treekoR workflow. “Name” is used torefer to each dataset throughout the manuscriptNameTechnology responsevariableReferencesAge chronic1036209inflammation predictingyoung vs old29Young /oldShen-Orr et al.2016 [18]Immport [30]SDY887 datasetAnti-CTLA- CyTOF4 and antiPD-1Predicting response vsnon-response in antiCTLA-4 and anti-PD-1treatments726478024Response / Subrahmanyamnonet al. 2018 [21]response totreatmentAnti-PD-1Predicting response vsnon-response in antiPD-1 treatment8571820Response / Kreig et al. 2018non[31]response totreatmentBCR-XL-sim CyTOFDetecting samples withstimulated B cells8843516Spiked /non-spikedWeber et al.2019 [23]BreastcancertumorCyTOFPredicting tumor inbreast cancer Wagner et al.2019 [32]CMVCyTOFPredicting positive vsnegative CMV titerresults in s fromCMV titerTomic et al.2019 [16]Immport [30]SDY478 datasetCOVID-19wholebloodCyTOFCyTOFProfiling whole blood to 4747543predict COVID-19 vs.healthy patients21COVID-19 /healthycontrolGeanon et al.2021 [33]COVID-19PBMCsFlowcytometryPredicting between ICUvs. hospital wardCOVID-19 patients479005338ICU / wardHumblet-Baronet al. 2021 [34]COVID-19FlowPBMCcytometryCD8 nonnaive TcellsProfile of CD8 NonNaive T Cells to distinguish recovered fromCOVID-19 vs. healthy11591741(60% of cellswere sampledand analyzed)168COVID-19Mathew et al.recovered / 2020 [35]healthyCOVID-19 T FlowcellscytometryT cell compartmentsamples (CD4 and CD8)to predict healthy vsCOVID-19500031COVID-19 /healthycontrolMelanomaPredicting response tocheckpointimmunotherapy inmelanoma592819Responder/ Sade-Feldmannonet al. 2019 [36]responderCyTOFscRNA-seqNumber ofcellsDe Biasi et al.2020 [4]clustering algorithms, HOPACH [17] and average-linkage hierarchical clustering, withboth generating different estimates of %parent (Additional file 1: Figure S2). After testing for differences in cell type proportions between the patient conditions, we compared the ordered negative log p values of each cell population from using %totalagainst the ordered negative log p values from using %parent (Fig. 3). Across all twelvecase studies, we were able to determine whether performing significance testing using%parent provided comparatively stronger associations with the patient outcome than%total—evident in instances where points conspicuously lay above the dashed identity
Chan et al. Genome Biology(2021) 22:324Page 7 of 14CV Balanced Accuracy Mean RankFeatures Used%parent (using HOPACH)%parent (using Hierarchical Clustering)Rank%total3CV Balanced Accuracy Variance Rank%parent (using HOPACH)21%parent (using Hierarchical Clustering)%totalComparative Boxplot of Balanced Accuracy5 fold CV with 20 repsBalanced Accuracy1.00.8Features used%total%parent (using Hierarchical Clustering)0.6%parent (using HOPACH)Anti CTLAAg 4eCanhrodAnicnti InfPDlammation,Shen O 1rr 2,S01ub6rahmanyam20An18ti PD 19COVIDCM 1V,9PDavisBM20C,19COHuVIDmblet 1 B9Pa roBMn2C,CO0Ma20VIDthe 1w9T2020ce Blls,COceDellVIDBia 1si209T20ceCO Clls,VIDDD4 1eB9Wiasi2ho02le0 BloodCDCy8TOF,MeGelananomon2a,02Sa0de Feldman20190.4DatasetFig. 3 treekoR provides stronger associations with patient clinical outcomes. Cell clusters, constructed usingboth average-linkage hierarchical clustering and HOPACH, were tested between patient conditions using%total and %parent. Q-Q plots were plotted for each dataset by plotting the ordered negative log p valuesusing %total (x-axis) vs. using %parent (y-axis)line. Across half of the investigated datasets, in particular CMV [16] and Age Chronic[18], the cell type proportion with highest significance was obtained from measuring its%parent. Further to this, the choice of hierarchical aggregation techniques produced variations in clinical association, suggesting that using different cell type trees can help analystsuncover a wider scope of associations. The benchmark exemplifies the importance ofmeasuring both %parent and %total so as not to miss pertinent clinical associations.Multivariate classification of clinical outcomes in cytometry data can be improved bymeasuring %parentHigh-dimensional single-cell data have been used to construct models to classify patients tohelp scientists discover and understand associations with a clinical outcome [19–22]. We evaluated classification performance using either %total or %parent as feature sets in several datasets with binary outcomes (e.g., responder vs. non-responder, COVID-19 vs. healthy control),to determine that the incorporation of %parent features in multivariate classifications modelscan help improve patient classification. There were various differences in balanced accuracybetween using %total and %parent (using either HOPACH or hierarchical clustering withaverage linkage) in each dataset (Fig. 4). The datasets with the biggest increase in balanced accuracy by using %parent were the BCR-XL-sim data [23] and Age Chronic data [18]. In theBCR-XL-sim semi-simulated dataset, we predicted which samples contained stimulated Bcells. Using only %total as features produced a mean balanced accuracy of 59%, compared to73% using %parent derived from HOPACH. In the Age Chronic CyTOF dataset, classifierswere constructed to discriminate between older and younger adults using their immune response signatures to influenza vaccination. Here, we show that using %parent (99%) also gives
Chan et al. Genome Biology(2021) 22:324Page 8 of 14Anti CTLA 4 and Anti PD 1Age Chronic InflammationAnti PD 1, Kreig 2018BCR XL sim, Weber 012COVID 19 PBMC, Mathew 2020 BcellCOVID 19 PBMC, Humblet Baron 2020CMV, Davis 201910.06 log10(p value): %parent00.00.0Breast Cancer, Wagner 2019427.54Hierarchy Type3Average linkageHierarchical Clustering5.0212Hopach2.510.00024600024602460COVID 19 Whole Blood CyTOFCOVID 19 T cells, De Biasi 2020 CD8COVID 19 T cells, De Biasi 2020 CD4123Melanoma, Sade Feldman 52.50.50.00.0012340.002460.00.51.01.52.0 log10(p value): %totalFig. 4 Measuring %parent offers improvements in patient classification performance. a Comparativeboxplots (lower panel) of balanced accuracy rates for each dataset and feature set: %total, %parent usingaverage-linkage hierarchical clustering, and %parent using HOPACH. Values plotted are from a 5-fold CVwith 20 repetitions, averaged across each repetition. The rank of each feature set within each dataset isshown in the bubble plot (upper panel), with rank 1 being the best (highest mean / lowest variance) andrank 3 being the worst (lowest mean / highest variance)a higher mean balanced accuracy than %total (88%). These results support the notion that failing to measure %parent can sometimes mean neglecting important signals when trying to predict a patient’s clinical outcome in high-dimensional cytometry datasets.Quantifying multiple views of cell type proportions can provide greater insight intosingle-cell cytometry data and patient clinical outcomes. In our classification benchmark, we compared the use of %total, %parent (using hierarchical clustering), and%parent (using HOPACH) cell type proportions. Exploring hierarchical representationsvia treekoR can help to elucidate a broader scope of %parent relationships that existwithin cytometry data (Additional file 1: Figure S2). When each feature set was rankedusing the mean and standard deviation of the balanced accuracy in each dataset (Fig.4), no single quantification of proportion performed the best for prediction of patientoutcomes across all analyzed cytometry datasets. The differences in rank however meanthat each type of proportion quantification provided a different perspective of the data.Depending on the dataset, one approach may provide a greater coverage of the signalpresent within the data through a higher balanced accuracy. This further supports theidea that proportions measured as %total should not be the only proportions measuredin cytometry analysis workflows, particularly when searching for the most predictivefeatures in distinguishing between patient clinical outcomes and understanding thecomplex relationships that exist. It is therefore imperative that proportions are quantified as both %parent and %total for the effective analysis of cytometry data, as it offersmore thorough examination of this data.
Chan et al. Genome Biology(2021) 22:324DiscussionIn this paper, we examined several high-dimensional single-cell datasets to demonstratethe importance of measuring both %parent and %total proportions, the use of %parent forclassification, and the consequences of using different hierarchical aggregation techniquesto empirically derive cell type proportions. Overall, we accentuated the importance of analyzing high-dimensional cytometry data using ideas from both traditional manual gatingand unsupervised clustering techniques and provide a general framework, treekoR, whichallows analysts to do so while overcoming key pitfalls of both approaches.The treekoR framework allows scientists to select their own clustering algorithm fordetermination of cell types and hierarchical aggregation technique for the constructionof cell type trees. While there have been numerous comparisons of clustering methodsof cytometry data [19, 24–27], there have not been as many comparisons of hierarchyconstruction techniques in the context of cell type hierarchies [9, 11]. We showthrough the use of HOPACH and average-linkage hierarchical clustering that thechoice of hierarchical aggregation technique can have noteworthy effects on downstream analysis, and suggest multiple other techniques that could also be used to produce distinct cell type trees. However, no formal evaluation to determine the most“suitable” technique was performed throughout our analyses. Since scientists haveunique and personal workflows for hierarchically analyzing cell types, there is significant room to explore what an appropriate cell type hierarchy might entail and determine a corresponding standard or measure which scientists can use to evaluate this.The definition for the most “suitable” hierarchical aggregation technique, whether it isthe technique which produces the most interpretable hierarchy or produces the %parent proportions most associated with a clinical outcome, has yet to be elaborated.In treekoR, we defined %parent as the proportion of a cell type relative to its directparent in the cell type hierarchy. This proportion could be calculated using a broaderparent (e.g., a higher ancestor) cell type in the hierarchy, which could lead to either amore interpretable and familiar cell type %parent or reduce the burden of multiple hypothesis testing. Since the scope of proportions to be calculated becomes much largerwhen numerous measurements of %parent for a single-cell type are allowed, there exists a challenge in determining which %parent to calculate, particularly as the numberof hypothesis tests increases. We do not currently address either of these points in ourworkflow. To overcome this challenge, a standard set of reference cell types can be determined to calculate %parent from. These reference cell types could be deduced in asemi-supervised fashion where analysts manually select them, or in a completely unsupervised manner by using a data-driven method (such as treeclimbR [15]). Thiswould limit the number of proportions calculated and potentially provide more biologically relevant %parent. Another approach to this issue could be implementing amultiple hypothesis correction that caters for the hierarchical nature of theseproportions.Care is required in the comparison of statistical significance between the %total and%parent of a cell type. The derived p values from significance testing inherently comefrom two distinct statistical hypotheses. Therefore, the user should not conclude thatone proportion is a better metric based solely on its p value, or say that one proportionis more relevant than the other. Rather the %total and %parent provide two complementary views, both of which may be objective and biologically relevant. Depending onPage 9 of 14
Chan et al. Genome Biology(2021) 22:324the datasets, one quantification of cell type proportions may provide a stronger
A number of unsupervised clustering methods and data-driven workflows have been developed to explore the hierarchical nature of cytometry data. SPADE and FlowSOM utilize minimal spanning trees over clustering as a visualization tool. Citrus employs hierarchical clustering and regularized supervised learning algorithms to identify strati-