Transcription
2017HR DepartmentBenchmarksand Analysis
2017HRR DepartmentBenchmarksand Analysis
HR Department Benchmarks and Analysis 2017ISBN 978-1-63359-193-6ISSN: 1540-2711"This publication is designed to provide accurate and authoritative information inregard to the subject matter covered. It is sold with the understanding that the publisheris not engaged in rendering legal, accounting or other professional service. If legaladvice or other expert assistance is required, the services of a competent professionalperson should be sought." From a Declaration of Principles, jointly adopted by aCommittee of the American Bar Association and a Committee of Publishers andAssociations.For inquiries about purchasing multiple copies of this report,please contact:Gail Moorstein, Editorial Director(gmoorstein@bna.com)姝 2017 The Bureau of National Affairs, Inc. Arlington, Virginia
s Table of ContentsAcknowledgements .vAbout the Authors .viInfographic Summary .viiExecutive Summary .viiiIntroduction and Guide to Using This ReportIntroduction .3Frequently Used Terms .4Design, Methodology, and Presentation .6Profile of Participating Employers .8Chapter 1—HR Department StaffingInfographic Overview .11Highlights .12How It’s Presented: HR Staff Ratios in Charts and Graphs .13HR Department Staffing .15How It’s Measured: The HR Staff Ratio22.Chapter 2—HR Department Budgets and ExpendituresInfographic Overview .25Highlights .26How It’s Measured: HR Budget and Expenditures .27How It’s Presented: HR Expenses per Capita in Charts and Graphs .28Budgeted Changes in HR Expenditures .30How It’s Measured: HR Budgets as a Percentage of Operating Costs .32HR Budgets and Total Operating Costs .34Benchmarking HR Expenditures: Factors to Consider .35How It’s Measured: HR Salaries as a Percentage of Payroll (HR Salary Ratio) .35姝 2017 The Bureau of National Affairs, Inc. Arlington, Virginiaiii
HR Department Benchmarks and Analysis 2017HR Staff Salaries .37HR Budget Breakdown .40Chapter 3—HR Priorities, Policy, and InfluenceInfographic Overview .43Highlights .44HR Priorities, Policy, and Influence .45Chapter 4—Performance ManagementInfographic Overview .53Highlights .54Performance Management Programs .55Chapter 5—HR Metrics and StrategyInfographic Overview .63Highlights .64HR Metrics and Strategy .65Chapter 6— HR Activities and OutsourcingInfographic Overview .75Highlights .76HR Activites and Outsourcing .77AppendixGuide to Using The Appendices .83Demographics .87Chapter 1 .96Chapter 2 . 106Chapter 3 .119Chapter 4 . 144Chapter 5 . 158Chapter 6 .iv173姝 2017 The Bureau of National Affairs, Inc. Arlington, Virginia
s AcknowledgementsWe wish to extend our heartfelt thanks to the many human resources professionals whoparticipated in this year’sHR Department Benchmarks and Analysis survey. This report wouldnot be possible without their willingness to complete the extensive survey questionnaire,despite their considerable duties and obligations. We are most grateful for their participation.As always, we are deeply indebted to Fonda Jarrett and Carol Kocian of Bloomberg BNA fortheir diligent, conscientiousness, and professional work in designing, laying out, andpublishing this report.姝 2017 The Bureau of National Affairs, Inc. Arlington, Virginiav
HR Department Benchmarks and Analysis 2017s About the AuthorsThe following individuals contributed to the research and questionnaire design, datacollection and tabulation, analysis, and interpretation of survey findings, writing, copy editing,and organization of this report.Gail C. MoorsteinEditorial DirectorMolly HuieManager, Surveys and Research ReportsStefanie ChicksSurvey Research AnalystKurt NaaszAssistant Managing EditorCordelia D. GaffneyManager, GraphicsMichelle SchneiderManager, Graphic Design, Marketingvi姝 2017 The Bureau of National Affairs, Inc. Arlington, Virginia
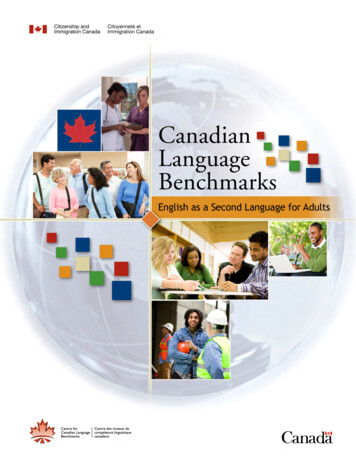
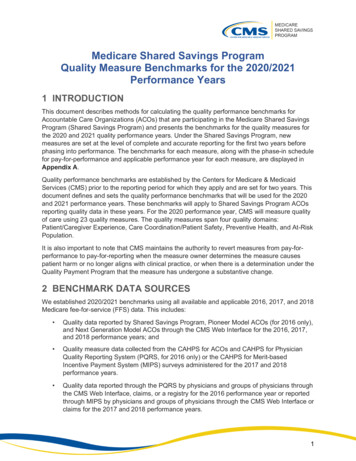
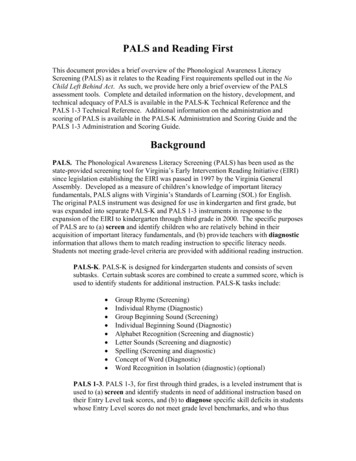
2017 HR Benchmarks ReportExecutive SummaryOverviewStaff ratios remain at an all-time high – 1.4 HR staff for every 100 009About 2/3 of HR departmentshave their own budget.1.31.41.4201620171.1201320142015Most have line items for benefits, recruiting, training, and compensation.Together those areas make up over 60% of their spending.Median % of their budget it represents% who have aspecific budgetfor this77%72%BenefitsA majority say they plan tochange HR policies basedon recent legislation.Most of the planned changesrelate to Affordable Care Act(ACA) and overtime rules.Employmentand recruiting10%71%69%Training anddevelopmentMost have a formalperformancemanagement plan.20%CompensationAnd most have updated theirperformance managementprograms in the past 3 years.OvertimeChange80%ACA62%Use of metrics and analytics is adequatein only one-third of organizations.Adequate33%48%73%20%80%YesThose who agree thattheir use of metrics andanalytics is adequatereport higher levels ofdepartmental efficiency,cost savings, anddata-driven strategicdecision kingNo28%Improvedefficiency62%20%Notable costsavings0617 JO-2362063%13% 2017 The Bureau of National Affairs, Inc.20%
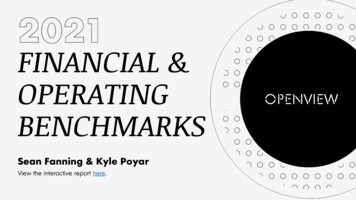
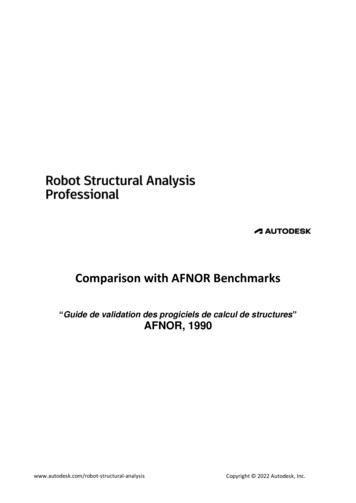
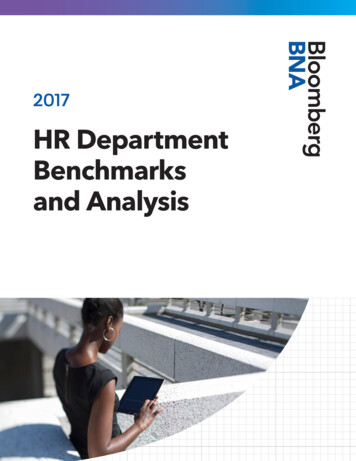
HR Department Benchmarks and Analysis 2017s Executive SummaryFor almost 40 years, Bloomberg BNA has published an annual report on the state of thehuman resources function, HR Department Benchmarks and Analysis. Since we started in 1978,we have been consistently revising, enhancing and updating both the survey itself and thereport to ensure that each is as comprehensive, timely, and enlightening as possible. As aresult, the annual survey-based report has remained an authoritative, trusted source ofresearch, analysis, and perspective on human resource department staffing, expenditures,responsibilities, priorities, and influence.This year’s survey and report include several notable enhancements. For many years, we askedsurvey respondents who was responsible for an exhaustive list of 60 areas of HR activity.Over the years we have seen very little movement in these numbers, and so decided to swapout that section in favor of more in-depth questions in a number of areas. We added questionsto home in on HR budgets and find out how departments are spending their allotted money,we dug deeper into performance management programs and asked what types of updateswere made most recently, we also added some content around policy and recent legislation.And finally, we fleshed out the section on metrics and strategy – including a comparison ofthose organizations who feel they are adequately using data vs those who are not.Again this year, we have included an appendix that details all the findings broken down bymajor demographic categories. By making all the data available in the appendix, we freeourselves to tell only the most pertinent, compelling pieces of the story within the body of thereport. Whereas in the past, nearly all sections of the report included charts and graphs ondemographic breakdowns, even where no notable differences existed, this year we aretypically showing graphics for overall numbers and only noting demographic breakdownswhere differences are apparent.We have also kept the reporting format we introduced last year, including the digital onlyformat. Each chapter begins with a full page infographic, and the following page containsnarrative highlights of the chapter. These are designed to be inclusive of all the major points inthe chapter, so if you are short on time, need only the highlights, or want an easy page to copyand share with your leadership team, we have you covered!HR Department Benchmarks and Analysis, 2017 is based on responses from 681 humanresource executives and professionals representing a broad cross section of U.S. employers.(See the ‘‘Profile of Participating Employers’’ infographic on page eight for more details on theinstitutions represented.) Most respondents are at or near the top of the HR profession,heading up the human resources function at their organization, division, or facility. Keyfindings of this year’s survey report, organized by major topic, are summarized below.viii姝 2017 The Bureau of National Affairs, Inc. Arlington, Virginia
HR Department StaffingFor six straight years, more HR departments have expanded than contracted, and reports ofHR staffing increases this year outpace reports of decreases by a four-to-one margin.The median HR staff ratio remains at a record high level of 1.4 HR employees for every 100workers served by the department.Small employers tend to report higher HR staffing ratios, while economies of scale help largeemployers maintain a lower ratio of HR staff to total employee headcount.Median figures on HR department composition show professional and technical employeesmaking up nearly half the staff this year, while managerial employees make up a third.Secretarial/clerical workers lag behind both of these groups, accounting for 20 percent of HRstaff.Smaller employers tend to have higher concentrations of HR managers, but the compositionof HR departments at larger organizations tilts in favor of professional and technical staff.HR specialization is at a peak this year, with 73 percent of HR departments reporting at leastone specialist on staff. As expected, large organizations are more likely than their smallercounterparts to have HR specialists on staff.The most common specialty area is benefits, followed by employment/recruitment. However,HR specialists commonly juggle multiple areas of responsibility, especially at smallerorganizations.HR Expenditures and BudgetsAnnual adjustments in HR funding have settled into a pattern of conservative growth in thewake of the Great Recession. These modest HR budget increases are not unlike the economicrecovery itself, which has been characterized by slow but steady expansion and very lowinflation.The median HR funding increase this year is 3.7 percent, down from 4.2 percent in both 2015and 2016.Budgeted HR expenditures dipped to a 10-year low when expressed as a per capita dollaramount. Across all employers, the median amount allotted to HR departments is 1,087 peremployee in 2017, down from 1,440 in 2016.A possible explanation is that total spending on the programs and activities overseen by thesurveyed HR departments continued growing modestly, but an expansion of the employeepopulation drove down per capita costs.The median per capita budget figure varies widely across organizations of different sizes,ranging from 594 per employee among employers with 2,500 or more workers to 2,966 peremployee among establishments with fewer than 250 workers.姝 2017 The Bureau of National Affairs, Inc. Arlington, Virginiaix
HR Department Benchmarks and Analysis 2017Despite some of the subdued figures on HR spending, the 2017 metric on HR budgets as ashare of total operating costs far surpasses levels recorded in past surveys. We just saw a newhigh last year at 1.6 percent, but the current reading nearly doubles that, at a median of 3.1percent.HR salaries are poised to continue rising at a faster pace in 2017. The median hike in HR’s staffsalary budget is 4.2 percent this year, up slightly from 4.1 percent in both 2015 and 2016, andmore than a percentage point higher than the figures from 2012 to 2014.The salary budget data also indicate that members of the HR department will be getting amedian of 2.7 percent of responding employers’ total projected wage and salary expendituresfor the year. As compared with the staff ratio that shows HR making up a median of 1.4 percentof the overall workforce, the 2.7 percent salary ratio means HR is getting a bigger slice of thecompensation pie than we’ve seen in the past.This year’s survey includes new HR budget breakdowns showing that the most prominent lineitems are benefits, employment and recruiting, training and development, and compensation.As a percentage of total HR budget, these four areas account for close to two-thirds of HRspending.HR Priorities, Policy, and InfluenceThe 2017 results on HR’s strategic influence and involvement once again offer considerableevidence that HR is rarely a bit player.A majority of the respondents agreed with the statement that one of the ways HR can have amore influential role is to be included as a partner early in the process of all major decisions.Along those lines, a combined 75 percent said their departments currently have full orsubstantial involvement in key business decisions.Influence can also be asserted through access to the C-suite, and HR department headstypically have a direct reporting relationship with a top official, such as CEO/president, chiefoperating officer, chief financial officer, or an executive position such as senior vice president.Judging by this year’s data on HR priorities, the competition for talent is a major concern, as84 percent of the surveyed HR departments identified recruitment and retention of qualifiedemployees as an important priority.Also ranking high on the list are priorities such as employee satisfaction and morale, trainingand development, compensation competitiveness, and leadership development, all of whichtie in with the basic objectives of keeping employees happy, engaged, and growingprofessionally.New this year, is a section to the survey focusing on HR policy revisions driven by legislativechanges. The initial results reveal that this is a dynamic area, with eight in 10 HR departmentsindicating they’ve had at least one policy revision or update based on recent legislativechanges.x姝 2017 The Bureau of National Affairs, Inc. Arlington, Virginia
Performance ManagementNearly three-fourths of employers have formal performance management systems, and HRexecutives tend to have positive impressions of the programs.Purposes served by the programs range from clarifying expectations and documentingperformance to identifying professional development needs and gathering information fordecisions on compensation and promotions.Individual employees’ performance goals tend to be set by line managers or establishedcollaboratively by employees and their direct supervisors.Existing employees commonly receive formal assessments once a year, but many programsshorten the cycle for new hires or workers on performance improvement plans, sometimesevaluating performance ‘‘as needed.’’When employees exceed their goals under formal performance management programs, theyoften receive a bump in base pay, a hike in variable pay, or a bonus increase. However,rewards aren’t automatically part of the equation.Most of the performance management programs have undergone at least minor revisionswithin the last three years. While further updates are on the horizon for many programs, nearlytwo in five HR departments seem to think the current system is fine and needs no immediateattention.HR Metrics and StrategyThe practice of tracking HR metrics and analyzing data has become widespread, with morethan nine out of 10 HR departments indicating that they employ data analytics of some kind.Broad usage is reported for several types of HR metrics and analytics; for example,compensation and benefits analysis is used by 87 percent of HR departments ‘‘at leastoccasionally.’’The responsibility for analyzing the data that’s collected usually stays within the HRdepartment. In some cases, analytics are handled by a specific person or team within HR, but itis more common for everyone in HR to do some analytics.There isn’t any single data analysis method or tool that has taken hold across a majority of HRdepartments, but some of the most common types are dashboards, data visualization, andanalysis of central tendency, such as mean and median.A new section in this year’s survey shows that demands for data analysis skills tend to be morestringent when hiring for positions in other departments, whereas simple analytical skills areoften sufficient for HR jobs.When filling HR positions at larger organizations, HR executives tend to place greaterimportance on analytics and the skills required to make effective use of data.姝 2017 The Bureau of National Affairs, Inc. Arlington, Virginiaxi
HR Department Benchmarks and Analysis 2017While attitudes about HR metrics and analytics appear generally positive, only one-third of thesurveyed HR departments agree that their use of metrics and analytics is adequate.Just 14 percent of those surveyed said they have no barriers to the use of HR metrics andanalytics.HR departments that actively analyze the data at their disposal tend to fare better on manypositive business outcomes than HR offices that view their use of data and analytics as lessthan adequate.HR Responsibilities and OutsourcingOur findings on overall workload shifts continue to show that HR departments are much morelikely to add new duties and responsibilities than to have anything removed from their plate.The prevalence of HR outsourcing rebounded from last year’s all-time low. The 2017 readingshows that 63 percent of HR departments rely on an outside vendor or service provider tohandle at least one program or activity.Once HR departments test the waters, they tend to outsource multiple activities or programs.When handing off programs or activities, most HR departments retain management oroversight of the relationship with the outsourcing vendor.Less than one in five HR departments said their most recent outsourcing initiative coincidedwith a reduction in HR staff, which suggests cost savings typically aren’t a leading motivationfor outsourcing.HR activities or programs seldom return to the organization once they’ve been outsourced.xii姝 2017 The Bureau of National Affairs, Inc. Arlington, Virginia
2017 HR Benchmarks ReportParticipating EmployerProfileIndustryManufacturing . . . . . . . . . . . . . . . . . . . . . . . . . . . . . . . . . . . . . . . . . . . . . . . . . . . . . . . . . . . . . . . . . . .Basic manufacturing . . . . . . . . . . . . . . . . . . . . . . . . . . . . . . . . . . . . . . . . . . . . . . . . . . . . . . . . . . . . . .Intermediate manufacturing. . . . . . . . . . . . . . . . . . . . . . . . . . . . . . . . . . . . . . . . . . . . . . . . . . . . . . .Advanced manufacturing . . . . . . . . . . . . . . . . . . . . . . . . . . . . . . . . . . . . . . . . . . . . . . . . . . . . . . . . .Other manufacturing . . . . . . . . . . . . . . . . . . . . . . . . . . . . . . . . . . . . . . . . . . . . . . . . . . . . . . . . . . . . .22%22%26%40%12%Nonmanufacturing . . . . . . . . . . . . . . . . . . . . . . . . . . . . . . . . . . . . . . . . . . . . . . . . . . . . . . . . . . . . . . . 47%Finance, insurance, banking, and real estate. . . . . . . . . . . . . . . . . . . . . . . . . . . . . . . . . . . . . . . . 24%Consulting . . . . . . . . . . . . . . . . . . . . . . . . . . . . . . . . . . . . . . . . . . . . . . . . . . . . . . . . . . . . . . . . . . . . . . . 10%Construction . . . . . . . . . . . . . . . . . . . . . . . . . . . . . . . . . . . . . . . . . . . . . . . . . . . . . . . . . . . . . . . . . . . . . . 5%Information services, telecommunications, data processing . . . . . . . . . . . . . . . . . . . . . . . . . 10%Retail and wholesale trade . . . . . . . . . . . . . . . . . . . . . . . . . . . . . . . . . . . . . . . . . . . . . . . . . . . . . . . . 10%Business, personal, and miscellaneous services . . . . . . . . . . . . . . . . . . . . . . . . . . . . . . . . . . . . . 25%Transportation, warehousing, utilities . . . . . . . . . . . . . . . . . . . . . . . . . . . . . . . . . . . . . . . . . . . . . . . 6%Communications and publishing . . . . . . . . . . . . . . . . . . . . . . . . . . . . . . . . . . . . . . . . . . . . . . . . . . . 2%Other nonmanufacturing. . . . . . . . . . . . . . . . . . . . . . . . . . . . . . . . . . . . . . . . . . . . . . . . . . . . . . . . . . . 8%Nonbusiness . . . . . . . . . . . . . . . . . . . . . . . . . . . . . . . . . . . . . . . . . . . . . . . . . . . . . . . . . . . . . . . . . . . . . 31%Government . . . . . . . . . . . . . . . . . . . . . . . . . . . . . . . . . . . . . . . . . . . . . . . . . . . . . . . . . . . . . . . . . . . . . 31%Health care. . . . . . . . . . . . . . . . . . . . . . . . . . . . . . . . . . . . . . . . . . . . . . . . . . . . . . . . . . . . . . . . . . . . . . . 31%Education . . . . . . . . . . . . . . . . . . . . . . . . . . . . . . . . . . . . . . . . . . . . . . . . . . . . . . . . . . . . . . . . . . . . . . . . 21%Membership organizations and associations . . . . . . . . . . . . . . . . . . . . . . . . . . . . . . . . . . . . . . . . 7%Social services. . . . . . . . . . . . . . . . . . . . . . . . . . . . . . . . . . . . . . . . . . . . . . . . . . . . . . . . . . . . . . . . . . . . . 4%Other nonbusiness . . . . . . . . . . . . . . . . . . . . . . . . . . . . . . . . . . . . . . . . . . . . . . . . . . . . . . . . . . . . . . . . 7%Workforce Size(Employee Headcount)Less than 250 . . . . . . . . . . . . . . . . 41%250–499 . . . . . . . . . . . . . . . . . . . . . 18%500–999. . . . . . . . . . . . . . . . . . . . . 11%1,000–2,499. . . . . . . . . . . . . . . . . . 11%2,500 and above . . . . . . . . . . . . . 19%Annual RevenueLess than 10 million. . . . . . . . . . 18% 10–49 million. . . . . . . . . . . . . . . . 21% 50–99 million . . . . . . . . . . . . . . . 12% 100–499 million . . . . . . . . . . . . . 13% 500–999 million . . . . . . . . . . . . 8% 1–9 billion. . . . . . . . . . . . . . . . . . . 14% 10–24 billion . . . . . . . . . . . . . . . . 3% 25 billion or more . . . . . . . . . . . 2%I am not sure . . . . . . . . . . . . . . . . . 8%RegionHR DepartmentsYes . . . . . . . . . . . . . . . . . . . . . . . . . 25%No. . . . . . . . . . . . . . . . . . . . . . . . . . 75%Title/PositionHuman Resources Professional (generalist or specialist). . . . . . . . . . . . . . . . . . . . . . . . . . . . . 16%Human Resources Manager . . . . . . . . . . . . . . . . . . . . . . . . . . . . . . . . . . . . . . . . . . . . . . . . . . . . . . . 26%Director of Human Resources . . . . . . . . . . . . . . . . . . . . . . . . . . . . . . . . . . . . . . . . . . . . . . . . . . . . . 22%Vice President of Human Resources. . . . . . . . . . . . . . . . . . . . . . . . . . . . . . . . . . . . . . . . . . . . . . . . . 11%Internal HR Consultant . . . . . . . . . . . . . . . . . . . . . . . . . . . . . . . . . . . . . . . . . . . . . . . . . . . . . . . . . . . . . 3%External HR Consultant . . . . . . . . . . . . . . . . . . . . . . . . . . . . . . . . . . . . . . . . . . . . . . . . . . . . . . . . . . . . 1%Other position within the HR department . . . . . . . . . . . . . . . . . . . . . . . . . . . . . . . . . . . . . . . . . 10%Other position outside the HR department . . . . . . . . . . . . . . . . . . . . . . . . . . . . . . . . . . . . . . . . . 10%UnionRepresentationYes . . . . . . . . . . . . . . . . . . . . . . . . . 37%No. . . . . . . . . . . . . . . . . . . . . . . . . . 63%0617 JO-23620Does your organization have morethan one human resourcesdepartment? 2017 The Bureau of National Affairs, Inc.New England (ME, NH, VT, MA, CT, RI) . . . . . . . . . . . . . . . . . . . . . . . . . . . . . . . . . . . . . . . . . . . . . . 6%Middle Atlantic (NJ, NY, PA) . . . . . . . . . . . . . . . . . . . . . . . . . . . . . . . . . . . . . . . . . . . . . . . . . . . . . . . 17%East North Central (WI, MI, IL, IN, OH) . . . . . . . . . . . . . . . . . . . . . . . . . . . . . . . . . . . . . . . . . . . . . 18%West North Central (ND, MN, SD, NE, KS, IA, MO) . . . . . . . . . . . . . . . . . . . . . . . . . . . . . . . . . . . 7%South Atlantic (FL, GA, SC, NC, VA, DC, MD, DE, WV, PR, U.S. Virgin Islands) . . . . . . . . . . 21%East South Central (KY, TN, MS, AL) . . . . . . . . . . . . . . . . . . . . . . . . . . . . . . . . . . . . . . . . . . . . . . . . . 4%West South Central (OK, TX, AR, LA) . . . . . . . . . . . . . . . . . . . . . . . . . . . . . . . . . . . . . . . . . . . . . . . . 9%Mountain (NM, CO, WY, MT, ID, UT, AZ, NV) . . . . . . . . . . . . . . . . . . . . . . . . . . . . . . . . . . . . . . . . . 7%Pacific (WA, OR, CA, AK, HI, Northern Mariana Islands, Guam, American Samoa) . . . . . . 11%
For more information on Bloomberg BNA surveysand reports or other Human Resources products andservices, contact your local Bloomberg BNA representative,call 800.372.1033, or visit www.bna.com.1801 South Bell Street, Arlington, VA 22202 2017 The Bureau of National Affairs, Inc.0617-JO23620
2017 The Bureau of National Affairs, Inc. † Arlington, Virginia HR Department Benchmarks and Analysis 2017 ISBN978-1-63359-193-6 ISSN:1540-2711