Transcription
Time’s Forgotten: Using NTP to understand InternetLatencyRamakrishnan Durairajan†, Sathiya Kumaran Mani† , Joel Sommers* , Paul Barford† {rkrish,sathiya,pb}@cs.wisc.edu, jsommers@colgate.edu† Universityof Wisconsin - MadisonABSTRACTThe performance of Internet services is intrinsically tied topropagation delays between end points (i.e., network latency).Standard active probe-based or passive host-based methodsfor measuring end-to-end latency are difficult to deploy atscale and typically offer limited precision and accuracy. Inthis paper, we investigate a novel but non-obvious sourceof latency measurement—logs from network time protocol(NTP) servers. Using NTP-derived data for studying latencyis compelling due to NTP’s pervasive use in the Internetand its inherent focus on accurate end-to-end delay estimation. We consider the efficacy of an NTP-based approachfor studying propagation delays by analyzing logs collectedfrom 10 NTP servers distributed across the United States.These logs include over 73M latency measurements to 7.4Mworldwide clients (as indicated by unique IP addresses) collected over the period of one day. Our initial analysis of thegeneral characteristics of propagation delays derived fromthe log data reveals that delay measurements from NTP mustbe carefully filtered in order to extract accurate results. Wedevelop a filtering process that removes measurements thatare likely to be inaccurate. After applying our filter to NTPmeasurements, we report on the scope and reach for USbased clients and the characteristics of the end-to-end latency for those clients.Categories and Subject Descriptors: C.2.2 [Network Protocols]: Applications; C.2.3 [Network Operations]: NetworkmonitoringKeywords: NTP; Internet latency; Measurement1.INTRODUCTIONEmpirical measurement of the Internet informs the development and configuration of systems, protocols and services.One of the most fundamental characteristics that can bePermission to make digital or hard copies of all or part of this work forpersonal or classroom use is granted without fee provided that copies arenot made or distributed for profit or commercial advantage and that copiesbear this notice and the full citation on the first page. To copy otherwise, torepublish, to post on servers or to redistribute to lists, requires prior specificpermission and/or a fee.HotNets ’15 November 16–17 2015, Philadelphia, PA USACopyright 2015 ACM 978-1-4503-4047-2 . 15.00. comScore, Inc.* ColgateUniversitymeasured is the time taken for a packet to traverse one ormore links between a sender and receiver, referred to as delay or latency. As link bandwidths have increased over thepast decades, application performance has become more andmore dominated by effects of end-to-end latencies [1]. As aresult, understanding Internet’s latency characteristics is increasingly important.Developing a broad understanding of the latency characteristics is extremely challenging due to the Internet’s scale anddynamics. Although the dominating contributor to latencyin the wide area Internet is propagation delay, which is essentially static, queuing delays, node processing delays, androuting changes each affect observed latency and complicateanalysis. Moreover, because of the vast and distributed nature of the Internet, empirical studies typically rely on probebased methods for measuring one-way or round-trip latencies [2–4], making it difficult or impossible to identify specific contributing factors to overall latency.Although there have been several efforts to deploy systemsfor continuous collection of Internet path latencies [5–7],such systems operate from a limited set of nodes from whichprobes are emitted and the measurements are inherently tiedto the management policies of service providers. Accurateone-way measurements of latency are further complicatedby the need for careful clock synchronization [8]. As a result, comprehensively characterizing latency has remainedelusive. These limitations have prompted researchers to investigate crafty methods for measuring delays between twoarbitrary hosts [4] and to develop techniques to infer latencies between arbitrary hosts via Internet coordinate and embedding systems [9–12].In this paper, we propose using a previously untappedsource of measurement data—the Network Time Protocol(NTP)—to improve our understanding of latency throughout the Internet. Our arguments for using NTP begin withthe fact that it is used by clients throughout the Internet.To further illustrate scale, there are nearly 4,000 servers inthe ntp.org server pool alone [13], and primary serversreceive about 10,000 requests per second and nearly 1B requests per day [14]. Next, is the fact that the delay estimationis inherent in the NTP protocol: logs contain timestampsthat specify when requests to servers were sent and when
the requests are received, (among other information), whichprovides a direct measurement of one-way latency. Finally,if NTP can be used, it would eliminate the need to manageand maintain dedicated latency measurement infrastructureand associated probe traffic. Our long-term goal is to betterunderstand the dynamic nature of the Internet through comprehensive characterization of Internet latency based on analysis of protocol messages exchanged between NTP serversand clients and to leverage this information for operationaldecision making, e.g., in traffic engineering. To the best ofour knowledge, our study is the first to consider NTP protocol and log data for examining Internet latency.We consider the efficacy of using NTP to understand latency by examining logs collected from 10 servers in theUnited States, including 3 primary (stratum-1) servers and 7secondary (stratum-2) servers. Three of the servers provideNTP synchronization over IPv6, and one serves clients overIPv4 (one server is dual-stack). Overall, our raw log data include 73,837,719 latency measurements to 7,369,029 uniqueclients worldwide (as indicated by unique IP addresses) collected over the period of one day.We develop and evaluate a filtering process designed toeliminate invalid and inaccurate latency samples from theraw log files. Our approach first attempts to detect whetheran NTP client is well-synchronized with a server throughanalysis of the observed time differences between consecutive requests from a given client. For example, based on theNTP algorithms, if we observe a shift to a slower pollingfrequency, we infer that a client has synchronized with theserver [15]. Surprisingly, we find that many clients poll atconstant intervals and to these clients we apply a general filter to eliminate any clients with relatively high variability inlatency measurements. From these filtered data, we focuson the minimum observed delay between a given client andserver.Our analysis reveals a wide range of observed latenciesacross all servers. For example, around 99% of US-basedclients have latencies less than 100 milliseconds to the serverwith which they synchronize, compared to an earlier surveyfrom 1999 which showed that 90% of clients had latenciesbelow 100 milliseconds to their server [16]. We also observea highly diverse client-base from a geographic perspective,especially for the secondary (stratum-2) servers. This diversity is much less pronounced for primary (stratum-1) serversbecause they are more tightly controlled, and for IPv6-basedservers since they generally have a smaller set of clients theyserve.In summary, there are three contributions of this work.First, we identify and shed light on the use of NTP server logdata for comprehensive analysis of Internet latency. Second,we develop an approach for filtering invalid latency measurements that leverages NTP’s synchronization algorithm andanalyze latency measurements derived from logs of 10 USbased NTP servers. The third and final contribution of thepaper is a preliminary analysis of Internet’s latency charac-ters which shows that around 99% of observed minimum latency values between US-based clients and servers are lessthan 100 milliseconds, and clients are geographically welldistributed and diverse.2. OVERVIEW OF NTPMaintaining a consistent notion of time among computer systems with independently running clocks is an interesting andold problem in computer networking and distributed systems.The most widely used protocol in the Internet for time synchronization is the Network Time Protocol (NTP). It is alsoone of the oldest networking protocols, having been initiallyestablished in RFC 958 in 1985 [17] based on the earlierTime Protocol [18] and ICMP timestamp [19] mechanismsand the even older Internet Clock Service from 1981 [20].Early versions of NTP provided clock synchronization onthe order of 10s to 100s of milliseconds, which consideringnetwork link bandwidths and processor clock speeds of computers at the time is quite an achievement.NTP version 4 is the current recommended standard [21]and is largely backward compatible with prior versions ofthe protocol. NTP uses a hierarchical organization of serversand time sources. At the top-level, referred to as stratum0, are high-precision time sources such as atomic clocksand GPS-based receivers. Servers connected to these highquality sources are referred to as stratum 1 or primaryservers. Stratum 2 or secondary servers connect to stratum1 servers, etc., all the way down to stratum 15. Servers mayalso peer with each other in order to provide redundancy ata given stratum. NTP clients may connect to servers at anylevel, but typically only connect to secondary servers andhigher.Commodity operating systems often ship with a defaultNTP server (or set of servers) configured (e.g., time.windows.com, time.apple.com, 0.pool.ntp.org),but any host can be reconfigured to use a different server. Inorder to compute a high-quality time estimate, it is commonfor clients to synchronize with more than one server. In fact,when clients perform a DNS lookup on one of the ntp.org“pool” servers, the authoritative DNS servers respond withmultiple server IP addresses that are geographically close tothe requesting client. The ntp.org web site also maintainslists of stratum 1 and stratum 2 servers that can be manuallyconfigured for use (some servers require permission from theserver operator).While many details of the protocol and algorithms used inNTP are beyond the scope of this paper, it is important to understand some of the key messages exchanged when clientspoll servers, and when servers poll other servers. Four timestamps are generated as a result of a polling round: the timeat which a polling request is sent (t0 ), the time at which therequest is received at the server (t1 ), the time at which theresponse is sent by the server (t2 ), and the time at whichthe response is received by the client (t3 ). The round-tripdelay is computed as (t3 t0 ) (t2 t1 ), and the one-way
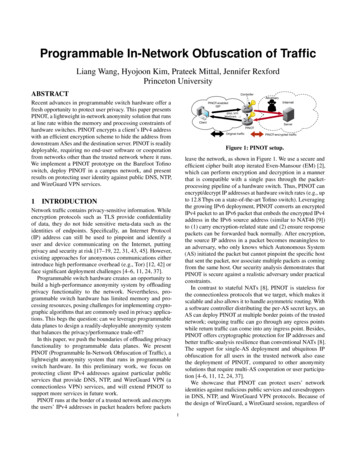
delay is assumed to be statistically one-half the RTT. Sinceour logs are captured at the server, we do not have accessto t3 , thus we use the one-way delay t0 t1 as the basis forour study. Moreover, the logs do not contain informationregarding whether a client’s clock is in “close” synchronization with the server. As a result, we developed a filteringprocess to identify and remove log entries that are likely tocontain inaccurate latency samples as we discuss in §4.Table 1. Summary of NTP server logs used in this 9NTP DATAIn this section, we describe characteristics of the data setsused in our study. We focus on the diversity of the clientbase and provide high-level statistics for the 10 different logfiles.surprisingly, the client diversity of IPv6-only servers is lessthan IPv4 servers.3.1 NTP Data CollectionTo collect the NTP log data used in our study, we contacted several network administrators and explained ourgoals. Three administrators responded by providing datasetsfrom a total of 10 NTP servers, including 4 commercial NTPservers in Utah, 2 private NTP servers in California, and 4university campus NTP servers in Wisconsin. To facilitatenetwork latency analysis, we developed a lightweight tool(about 700 lines of C code) to process and analyze the NTPserver logs 1 .3.2 Basic StatisticsTable 1 summarizes the basic statistics from each of the NTPserver logs and some of the key properties of these serverssuch as server stratum, IP version supported, number of measurements observed in the log file, number of clients, andthe unique number of countries across which the clients aredistributed. The selection includes 3 stratum-1 servers and7 stratum-2 servers with a combination of both IPv4 andIPv6 support. These logs include a total of 73,837,719 latency measurements to 7,369,029 unique worldwide clients,as indicated by unique IP addresses, collected over a period of one day. From these 73.83M latency measurements,we filtered 48.86M measurements due to malformed headers, packet errors, missing timestamps, negative latency values, leaving us with about 25M latency measurements whichform the basis of our analysis.Table 1 highlights the fact that these servers provide timesynchronization service to a huge diversity of clients. Nearlyall stratum-2 servers have clients located in tens to hundredsof different countries. For example, there are clients from218 unique countries disciplining their clock with the U2stratum-2 NTP server. Many stratum-1 servers, such asC1 and W1, only offer access to a restricted set of clients,thus these servers only provide synchronization to US-basedclients and servers. Although the U1 server operates atstratum-1, it does not restrict its base of clients. Rather un1 The tool is an extension of netdissect.h and print-ntp.c availablefrom https://github.com/the-tcpdump-group/tcpdump and isavailable upon request.Figure 1. Client footprint of W3 NTP server.To further illustrate client diversity, we graphically represent the distribution of hosts by geolocating the IP addressesusing MaxMind’s IP geolocation service [22]. Figure 1shows the client footprint of the W3 NTP server (footprintsfrom other logs had similar reach). This figure highlights theopportunity for understanding and analyzing latency characteristics across a broad cross-section of the Internet.4. FILTERING NTP DATAOn initial analysis of the data, we observed that many ofthe clients were either (1) apparently starting up and sending a rapid series of requests, followed by a significant slowdown in polling, or (2) exhibiting a major shift in pollingfrequency, likely due to a major client-side clock adjustmentor to a network path change. These observations, along withother sources, e.g., [23, 24] suggest that many of the latencysamples in NTP logs may be skewed and thus not suitablefor latency analysis. Even if we examine only the minimumlatencies across every individual client, there is no guaranteeof accuracy of the measurement sample, since the logs contain no explicit indication of whether a particular client is in“good” synchronization with a server.We developed an approach for filtering out inaccurate latency measurements which leverages the fact that the NTPsynchronization algorithm causes a client’s polling intervalto change depending on how well it is synchronized to theservers. In NTP, this polling behavior is governed by itsclock discipline algorithm [15]. Initially, a client can pollquite rapidly (e.g., every 2 seconds). The polling rate thentypically decreases as the algorithm indicates that it is in
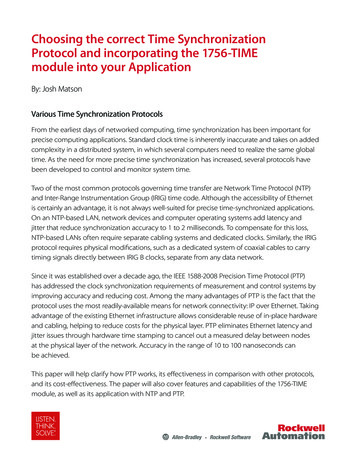
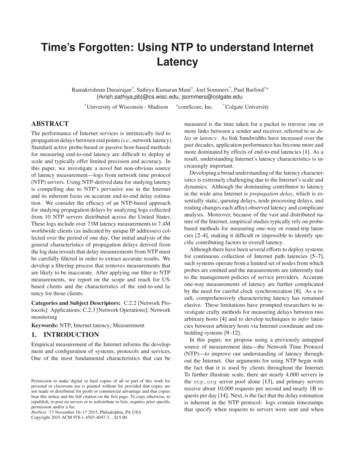
good synchronization with a server. Over time, the frequency may increase and/or decrease, depending on networkconditions and local clock drift. The maximum (rapid) andminimum (infrequent) rates at which a client can poll areconfigurable values, and default to 64 sec and 1024 sec, respectively. A client may briefly exceed its maximum pollingrate on startup or during operation, again depending on configuration settings.We take advantage of these polling behaviors in order to infer the stage at which a client has synchronized with a server.In our NTP log data, we observe four different variations, asfollows. (1) Monotonically increasing polling values: all thepolling values are increasing and at some point reach a set ofconstant values. In this case, we only use those latency samples corresponding to the most infrequent polling values asthey suggest that a client is in good synchronization with theserver. (2) Monotonically decreasing polling values: pollingrate is initially constant then starts to decrease. Clients exhibiting this behavior do so in reaction to degraded synchronization due to network conditions or local clock drift. Similar to (1), we only extract latency samples from the constantpolling period, prior to the increase in polling rate. (3) Constant polling values: no variation in polling rate is observed.In this situation, we have no way to infer the synchronization state of a client. While we could assume that a constant polling rate implies good synchronization, this is nota safe assumption due to the fact that a client may simplyhave configured identical minimum and maximum pollingrates (which is apparently not uncommon [14]), or exhibita simplistic polling behavior. For this situation we applya general filtering approach. First, we eliminate all clientsfor which the difference between the maximum and minimum observed latency is greater than a fixed threshold. Wechoose 100ms as a threshold since we focus on US-basedclients in this paper. Any clients with latencies beyond thisthreshold have either a very bad clock or may use an old implementation of NTP that less correctly (or too slowly) altersthe polling interval. Next, for the remaining clients, we findthe median and standard deviation of the latency values andremove all those samples that are not within one standarddeviation from the median. (4) Varying (non-monotonic)polling values. For this situation, we select the longest setof samples during which polling values increase for a givenclient, and remove all other samples. The assumption withthis approach is based on (1), that a period of monotonicallyincreasing polling intervals implies an improvement in synchronization.To provide perspective and toward the goal of assessingthe effectiveness of our filtering approach, we sent 10 ICMPecho requests (using the standard ping tool) to 250 USbased clients from the W3 NTP server. The clients wereselected randomly from a combination of clients whose latency samples were selected as well as rejected by our filtering process. Of these 250 clients, we received ICMP echoreplies from 152 hosts. Figure 2 shows scatterplot compar-isons of the minimum (Left), maximum (Center) and average (Right) NTP-derived latencies against correspondingRTT/2 values from the ping measurements. In each plot,data points accepted by our filtering approach are shown ingreen, and rejected data points are shown in red. In the plots,we first observe that there are no extreme outliers coloredgreen, which indicates that we correctly filter out inaccuratesamples. Of the accepted data points, 71.3% of the minimum NTP-derived latencies are within 5 milliseconds of theping measurements, and 12.5% differ by more than 10 milliseconds. These differences may be due to network changesthat occurred between the time at which our NTP logs werecollected, and the time at which we were able to collect theactive measurements. They may also be due to deficienciesin the filtering process, and we are currently considering howto include additional NTP-specific techniques in our filteringapproach. Nonetheless, these results suggest that with appropriate filtering techniques applied, NTP server data canindeed provide a potentially rich source of accurate latencymeasurement data.5. INTERNET LATENCYIn this section, we provide an analysis of the general characteristics of one-way latency as revealed through NTP logdata.Latency Characteristics. Figure 3 shows box-andwhiskers plots for worldwide clients before filtering (top)and US-only after filtering (bottom) that discipline theirclocks to the 10 NTP servers we consider. The interquartile range with median is shown, along with minimum andmaximum latency values. For the worldwide clients, we firstobserve that for the two stratum-1 servers (W1 and C1) thatrestrict which clients and servers may synchronize to them,their interquartile ranges are very tight. Although U1 is alsoa stratum-1 server, it does not restrict which hosts may synchronize to it and while the median latency between it and itsclients is relatively low (less than 100 milliseconds), its interquartile range is quite large. Similarly, with several of theremaining stratum-2 servers (e.g., W2, U3, U4, C2), theirinterquartile ranges are fairly large and the maximum observed latency extends to about 1 second. The U2, U3 andU4 servers have particularly large interquartile ranges, withmedian latencies of 175-300 milliseconds.When considering only US-based clients (bottom plot ofFigure 3) after filtering the latency distributions substantially shift toward lower values and the interquartile rangesshrink, and sometimes significantly so. For example, forthe C2 server, the median changes from about 150 milliseconds when considering all clients, to around 30 millisecondswhen only US-based clients are considered, and the 75th percentile shrinks from close to 600 milliseconds down to about45 milliseconds. Similarly, this behavior can be observed inother stratum-2 servers (e.g., U3, U4).Latency Distribution. Tables 2, 3 and 4 show the distribution of minimum, maximum and average latency values
10012010040080300602004020100020406080100 120 140Latencies from Ground Truth (s)0Latencies from NTP Packets (s)1405001200Latencies from NTP Packets (s)Latencies from NTP Packets (s)6001400100200300400500Latencies from Ground Truth (s)600806040200020406080100 120 140Latencies from Ground Truth (s)Figure 2. Comparison of measured minimum (Left), maximum (Center) and average (Right) latencies from NTP packets and ping measurements. Clientsselected and rejected by the filter are denoted in green and red respectively.1200Latencies (ms)10008006004002000W1 W2 W3 W4 U1 U2 U3 U4 C1 C2NTP servers120Latencies (ms)100806040200W1 W2 W3 W4 U1 U2 U3 U4 C1 C2NTP serversFigure 3. Box-and-whiskers plot showing latencies for clients distributedworldwide (top) before filtering and US-only (bottom) after filtering.seen for US-only clients2 (post-filtering). A survey [16] conducted in 1999 by Minar et al. (referenced in [25]) showedthat (i) about 90% of the clients synchronizing their clockswith NTP servers had latencies below 100ms and about 99%were within one second, and (ii) stratum-1 servers were bottlenecked i.e., they were serving too many clients and/orstratum-2 servers. For the servers considered in this study,and based on a much larger client base, we see somewhatdifferent characteristics. First, many stratum-1 servers (including W1 and C1 in our study) restrict access to certainclients and stratum-2 servers as a way to ensure that they canaccurately serve all their clients. This is different from whatwas observed in the survey. The effect on latencies is veryclear both in the plots of Figure 3 and in these tables. For2 Clients can be wired or wireless. Characterizing how the increase in wireless clients has changed the latency distribution is part of the future work.example, from the table, the minimum latencies observedbetween W1 and C1 and their US-only clients are all below10 milliseconds, and while some maximum latencies are relatively high, only a small fraction of latencies are above 100milliseconds.Interestingly, although the median latencies are similar(within 10 milliseconds of each other) across servers deployed in a particular location (e.g., across the 4 servers inWisconsin, the 4 in Utah, and the 2 in California), the distributional characteristics vary significantly, depending onserver load, stratum, and IP version supported. For example,for all the servers in Wisconsin, the majority of their clientshave minimum latencies less than 10 milliseconds, in contrast with the Utah servers where the majority of the clientshave minimum latencies between 20 to 30 milliseconds. Aggregating across all NTP servers for minimum, maximum,and average latency values, only 1%, 2.2% and 1.5% of theclients have latencies greater than 100ms. This observationdiffers significantly from the earlier survey of Minar [16]in which approximately 10% of clients had latencies above100ms, and suggests that Internet latencies have improvedsince the time of that survey.Table 2. Number of clients grouped in bins based on minimum latencyvalues (in milliseconds) across all NTP servers.Bins -100 2543473156Client Counts and Locations. While Table 1 shows thenumber of world-wide unique clients and their locations asseen by the NTP servers before filtering, we show in Table 5the number of unique US-only clients and their locations after filtering. From this table, we observe that the client basefor each server is, in general, large and widely distributed.For example, for the U2 server, around 215K clients makerequests from over 7900 cities across 48 states. Similarly,
Table 3. Number of clients grouped in bins based on maximum latencyvalues (in milliseconds) across all NTP servers.Bins -100 637376016611079768670364Table 4. Number of clients grouped in bins based on average latencyvalues (in milliseconds) across all NTP servers.Bins -100 129781307955644525252all other stratum-2 servers except W3 and U4 have clientsspread across more than 40 states in the US. Interestingly,the v6-only U3 stratum-2 server has similar client-base characteristics as other high-traffic v4-only stratum-2 servers.Table 5. Summary of unique US-only clients and their locations seen inthe NTP logs.Server IDUnique clientsUnique citiesUnique 55C240684453148RELATED WORKMeasuring Internet path latencies has been a target of inquiry for decades. One of the earliest studies by Mills [26]used ICMP echo requests emitted from instrumented hosts(“Fuzzballs”) to a few target systems to assess latencies.Since link bandwidths were quite low at that time, transmission delays played a much larger role than they do in themodern Internet. Moreover, since the full physical configuration of links was known and documented at this time, itsomewhat easier to dissect causes behind observed latencies.Ten years after Mills’s study, Bolot studied both Internetpacket loss and latency, including queueing characteristics,in the Internet, still before its commercialization and greaterdecentralization [27].Following commercialization of the Internet, it becamemuch harder to comprehensively characterize any empiricalproperty of the Internet, including latency. The highly influential work of Paxson in the mid-late 90s used a set ofspecially-deployed systems to carry out measurements ofpacket loss and latency [2]. This work informed much ofthe later work in this area, and the same systems deployedas part of his work were used a few years later to assess theconstancy of certain Internet path properties such as loss, delay, and throughput [3]. There are a number of efforts todaythat take a similar approach of having specially-deployedsystems to collect an essentially continuous stream of measurements such as latency, loss, and routing [5–7]. Besidesempirical measurement of Internet latencies, there have beena variety of techniques developed to estimate latencies between arbitrary nodes in the Internet [4, 9, 28].7. SUMMARY AND FUTURE WORKLatency is an increasingly important factor behind the performance of many Internet protocols and services. In thispaper, we propose the use of Network Time Protocol (NTP)server logs as an opportunistic source of accurate, Internetwide latency measurements. We develop a data filteringtechnique designed to eliminate inaccurate latency samplesthat leverages details of NTP message exchanges, and experimentally show that our filter effectively removes poordata samples. We analyze latency characteristics of filtereddata derived from 10 US-based NTP server logs. Our resultsshow that about 99% of all latency samples from all USbased clients to all 10 servers are below 100 milliseconds,and that the client-base is quite large and highly geographically distributed.In our ongoing work, we are refining our filtering algorithm and are pursuing a more comprehensive analy
contain inaccurate latency samples as we discuss in §4. 3. NTP DATA In this section, we describe characteristics of the data sets used in our study. We focus on the diversity of the client base and provide high-level statistics for the 10 differentlog files. 3.1 NTP Data Collection To collect the NTP log data used in our study, we con-