Transcription
EARLY CHILDHOODThe Early Childhoodmenu allows users to explore Michigan’s earlychildhood programs andlearn how programs suchas EarlyOn , Head Start,Great Start Readiness Program, Early ChildhoodSpecial Education, andothers serve Michigan children.Early Childhood data canbe viewed at the statewide,county, ISD, district orschool level or for a specific early childhood serviceprovider. Explore visualrepresentations of the early childhood pathways students take before kindergarten or the impact of early childhood participation on K-3 attendance. Switch quickly between data shown asa snapshot in time or as a trend to view changes over time.Report and inquiry settings can be used to filter the data in a variety of ways such as gender,race/ethnicity, delivery schedule and more. Reports with the “Compare” option allow users toexplore select data for multiple entities at one time.Early Childhood Program ParticipationShows the number of Michigan children enrolled in early childhood programs by program or demographic report category.Early Childhood Participation by Kindergarten ClassShows the number of Michigan children enrolled in early childhood programs by program or demographic report category.K-3 Absenteeism and Early Childhood ParticipationShows absence rates for students in kindergarten through third grade, and allows rate comparison ofstudents who have participated in select publicly-funded early childhood programs before kindergarten,with that of all students.Pathways to KindergartenShows the order in which children were enrolled in publicly-funded early childhood programs prior toentering kindergarten and the number of children that followed each pathway.Continuity of Service in Special EducationShows early intervention and special education services delivered to Michigan children between birthand third grade, the proportion of children in each service pathway, and the comparison of a selectedISD's pathways to statewide.MISCHOOLDATA.ORGCREATED AS PART OF THE MISCHOOLDATA TRAIN-THE-TRAINER PROFESSIONAL DEVELOPMENT NETWORK
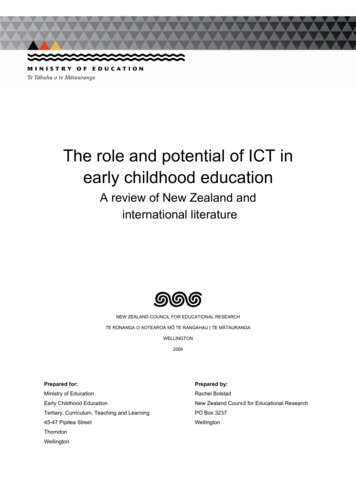
EARLY CHILDHOODLANDING PAGETo explore Early Childhood data:1. Locate the Early Childhood menu.2. Navigate to the Early Childhood Landing Page.3. Choose a report inquiry from the following options: Early Childhood Program Participation Early Childhood Participation by Kindergarten Class K-3 Absenteeism and Early Childhood Participation Pathways to Kindergarten Continuity of Service in Special Education4. Once you have selected an area, use the “View Report”4. Use the Location and Report Settings to filter your inquiries. Use the “School, District, ISD name or code” tosearch by name or keyword, or use the drop down menus to filter by ISD, District, County, Early ChildhoodService Provider, School Year, Program, and/or Report Category.5. To generate results, click on Update Report .MISCHOOLDATA.ORGCREATED AS PART OF THE MISCHOOLDATA TRAIN-THE-TRAINER PROFESSIONAL DEVELOPMENT NETWORK
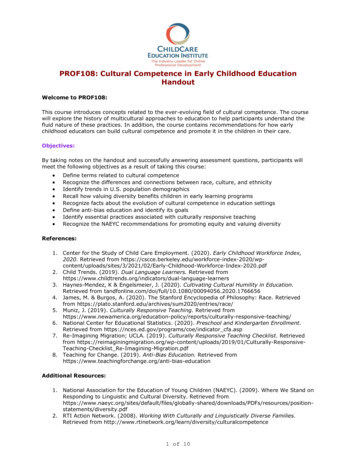
EARLY CHILDHOODPROGRAM PARTICIPATIONThe Early Childhood Program Participation report shows the number of children reported as participating in early childhood programs. This may not include every child who was enrolled in earlychildhood programs in the given school years in Michigan.Entities are required to report participation in the following EC programs to the State of Michigan: Childcare Subsidy EarlyOn Early Childhood Special EducationReporting participation for all otherearly childhood programs is voluntary, Great Start Readiness Programwhich can cause gaps in the data pre GSRP/Head Start Blendsented in this report. 32p Early Childhood 32p (4) Home VisitationUse the Location and Report Settings to select a location, schoolyear, program and report category.Data view options include: Count or PercentSnapshot (a graph and table ofthe selected data)Trend (a graph and table showing changes over time)MISCHOOLDATA.ORGCREATED AS PART OF THE MISCHOOLDATA TRAIN-THE-TRAINER PROFESSIONAL DEVELOPMENT NETWORK
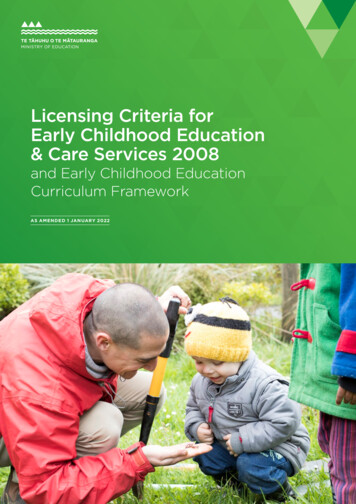
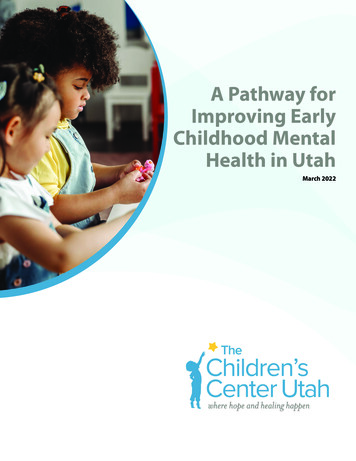
EARLY CHILDHOODCONTINUITY OF SERVICE IN SPECIAL EDUCATIONSERVICE COMPARISONS & PATHWAYSThe Continuity of Service in Special Education reports show an unduplicated count of early intervention and special education services delivered to Michigan children between birth and thirdgrade.The reports give an overview of how many children received early intervention and special education services by age level. They also show at what point children began receiving interventionservices and if they continued to receive services through the third grade.This report explores the different service pathways children participate in during three important age spans: birth to their 3rd birthday, from their 3rd birthday to kindergarten entry, andbetween kindergarten and 3rd grade. The report is updated in the fall.There are two ways you can view thedata: through the Service Pathways report or the Service Comparisons report.Services depicted include: Early On Michigan Mandatory Special Education while in Part C Early childhood special education under IDEA Part B Section 619 (3-5 yearolds) Special education during kindergarten through 3rd grade.Service Comparisons: Shows thepercentage of children receiving earlyintervention and special educationservices by age group at a selected ISD,as compared to the statewide percentagefor children receiving services in the chosen age group.Service Pathways: Shows the numberportion of children receiving specific earlyintervention and special education services by age group. The Service Pathways report makes it easy to see whichage bracket children began or finished receiving services as well as any gaps inservices.MISCHOOLDATA.ORGCREATED AS PART OF THE MISCHOOLDATA TRAIN-THE-TRAINER PROFESSIONAL DEVELOPMENT NETWORK
EARLY CHILDHOODCONTINUITY OF SERVICE IN SPECIAL EDUCATIONSERVICE COMPARISONS & PATHWAYSTo locate these reports:1. Navigate to the Early Childhood menu2. Locate the Continuity of Service in Special Education submenu.3. Choose from the Service Comparisons or Service Pathways. Service Comparisons: Shows the percentage of children receiving early intervention and special education services by age group at a selected ISD, as compared to the statewide percentage for children receivingservices in the chosen age group. Service Pathways: Shows the number portion of children receiving specific early intervention and special education services by age group. The Service Pathways report makes it easy to see which age bracketchildren began or finished receiving services as well as any gaps in services.4. Use the Location and Report Settings to filter your inquiries. Enter a keyword in “ISD name or code”, or use the“ISD, School Year, and/or Report Category” to filter your options.5. To generate results, click on Update Report.6. Change how you view the report, or download/print or share.MISCHOOLDATA.ORGCREATED AS PART OF THE MISCHOOLDATA TRAIN-THE-TRAINER PROFESSIONAL DEVELOPMENT NETWORK
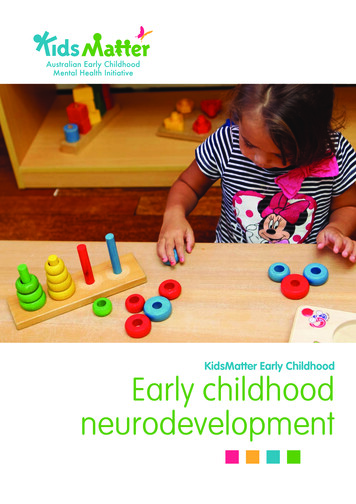
EARLY CHILDHOODK-3 Absenteeism and Early ChildhoodThe K-3 Absenteeism and Early Childhood Participation report shows absence rates for students in kindergartenthrough third grade, and allows users to compare absence rates of students who participated in select early childhood programs with rates for all students. The report is updated in early winter. Research has shown that schoolattendance during the early years of school is one of the keys to academic success. Chronic absenteeism (missing 10percent or more of school days) puts young children at risk for falling behind their peers, especially in reading proficiency.The following state-funded EC programs are included in this report: Early Childhood Special EducationEarly On Great Start Readiness ProgramGSRP/Head Start BlendHead StartDistricts are required to report participation in early childhood special education, Early On , Great Start Readiness Program and GSRP/Head Start Blendto the state. Children who participated in Head Start and Early Head Start arereported optionally. Beginning in 2016-17, these programs are included aspart of an effort under the Race to the Top grant to integrate this data into theearly childhood reports on MI School Data.Early Head StartFamily income must be below a certain threshold for children to be eligible for GSRP and GSRP/Head Start Blend.Because these two programs are income dependent, the report category chosen can impact what results are shown.To explore this area of the Early Childhood menu,1. Use the “Location & Report” settings to keyword search for an ISD/District, Country or EC Service ProviderOR go to Step 22. Use the carat to see a drop-down list where you can choose an ISD3. Use the carat to see a drop-down list where you can choose a (school) District4. Use the carat to see a drop-down list where you can choose a School (building)5. Use the carat to see a drop-down list where you can choose a County6. Use the carat to see a drop-down list where you can choose a School Year7. Use the carat to see a drop-down list where you can choose a Report Category8. Use the carat to see a drop-down list where you can choose a Testing Group9. Click on the blue “Update Report” button to generate results.10. Change how you view the report, or download/print or share.MISCHOOLDATA.ORGCREATED AS PART OF THE MISCHOOLDATA TRAIN-THE-TRAINER PROFESSIONAL DEVELOPMENT NETWORK
EARLY CHILDHOODParticipation by Kindergarten CountThe Early Childhood Participation by Kindergarten Count report shows the number of kindergarten students who were reported as participating in early childhood programs prior to entering kindergarten. The report is updated in late spring/early summer.This may not include every child who was enrolled in early childhood programs in the givenschool years in Michigan. Reporting participation for all other early childhood programsis voluntary, which can cause gaps in the data presented in this report.Entities are required to report participation in the following EC programs to the State of Michigan:Early childhood program reporting is voluntary. Another EarlyOn Early Childhood Special Education point of caution is that it is possible that a child may havebeen enrolled in multiple programs in the same or different Great Start Readiness Programgeographical area at the same time. Because of that, individ GSRP/Head Start Blendual program participation numbers may add up to a total sum 32p Early Childhoodthat exceeds the statewide total of children participating in 32p (4) Home Visitationprograms.Locate the Early Childhood Program Participation by Kindergarten Class in the Early Childhood menu. Use Location and Report Settings to filter your inquiries. View reports as Snapshots or Trends. Download, print, or share a link to reports.MISCHOOLDATA.ORGCREATED AS PART OF THE MISCHOOLDATA TRAIN-THE-TRAINER PROFESSIONAL DEVELOPMENT NETWORK
EARLY CHILDHOODPROGRAM PARTICIPATION BY KINDERGARTEN CLASSINQUIRY & REPORTINGThe Early Childhood Participation by Kindergarten Count report shows the number of kindergarten students who were reported as participating in early childhood programs prior to entering kindergarten. The report is updated in late spring/early summer.To explore this area of the Early Childhood menu:1.2.3.4.5.6.7.8.9.10.11.Navigate to “Location & Report Settings”Enter a keyword search by School/ISD/code OR go to Step 3Use the carat to see a drop-down list where you can choose an ISDUse the carat to see a drop-down list where you can choose a (school) DistrictUse the carat to see a drop-down list where you can choose a School (building)Use the carat to see a drop-down list where you can choose a School YearUse the carat to see a drop-down list where you can choose a Report CategoryClick on the blue “Update Report” button to generate results.Use the “Compare” button with another entity to analyze by up to 20 characteristics.Change how you view the report by choosing Snapshot or Trend.Use the Download/Print to create or print a file; use the Share option for a hyperlink.12. If you wish to change the views on the report, choose from Count or Percent.MISCHOOLDATA.ORGCREATED AS PART OF THE MISCHOOLDATA TRAIN-THE-TRAINER PROFESSIONAL DEVELOPMENT NETWORK
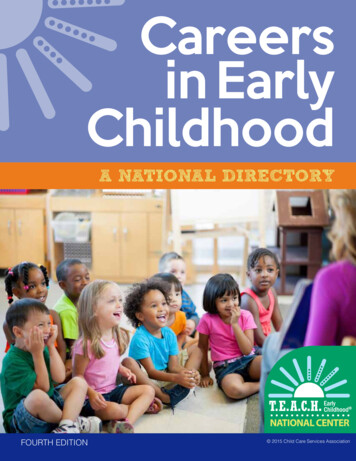
EARLY CHILDHOODPathways to KindergartenThe Pathways to Kindergarten report shows the publiclyfunded early childhood programs children participated in before entering kindergarten.Research shows that early learning programs help preparechildren for learning in kindergarten. The report provides avisual representation of the different early childhood pathways children can take, and the number of children who followed each pathway. The report includes only children whoenrolled in Kindergarten for the selected school year. The report is updated in late spring.The report uses a type of chart called a Sankey diagram. The chart is read from left to right, andshows the program(s) children participated in, in chronological order, before beginning kindergarten. Wider color bands represent larger numbers of children.Hover over an individual pathway or color block to see the program(s) and the total number ofchildren who followed that particular pathway. The Kindergarten Pathways chart illustratesthe number and sequence of state-funded early childhood programs in which children participated before entering Kindergarten in the selected school year. Each pathway begins when children are first reported to CEPI via the Michigan. StudentData System (MSDS) at the left side of the chart and progresses to the right side of thechart as students are reported in Kindergarten.The thickness of each pathway is proportional to the number of students who shared thesame program sequence pathway.The pathways are shown in order from the largest number of students at the top to thesmallest number of students at the bottom.
Early Childhood data can be viewed at the statewide, county, ISD, district or school level or for a specif-ic early childhood service provider. Explore visual representations of the early childhood pathways students take before kindergarten or the im-pact of early childhood participation on K-3 attendance. Switch quickly between data shown as