Transcription
Anantsuksomsri, S. and Tontisirin, N. (2015). The impacts of mass transit improvements on residential land development values: Evidence from theBangkok Metropolitan Region. Urban Policy and Research, vol. 33, no. 2, pp. 195–216. DOI: 10.1080/08111146.2014.982791Downloaded by [Thammasat University Libraries] at 01:12 04 June 2015Urban Policy and Research, 2015Vol. 33, No. 2, 195–216, http://dx.doi.org/10.1080/08111146.2014.982791The Impacts of Mass Transit Improvementson Residential Land Development Values:Evidence from the Bangkok MetropolitanRegionSUTEE ANANTSUKSOMSRI* & NIJ TONTISIRIN***Waseda Institute for Advanced Study, Waseda University, Shinjuku, Tokyo, Japan, **Faculty of Architectureand Planning, Thammasat University, Pathumthani, Thailand(Received 1 November 2013; accepted 24 October 2014)ABSTRACT This study examines the impacts of the new mass transit systems on the land valuesof residential development in the Bangkok Metropolitan Region, Thailand, using geographicinformation systems and spatial econometrics. The study finds that the proximity to mass transitstations spatially correlates with an increase in the prices of residential land. The benefits of the newmass transit stations, however, may not be equally distributed to the residents of Bangkok due to thelack of value-capture mechanisms such as a capital gains tax or a property tax. Policy implicationsregarding property taxation are also 征税的政策意义。KEY WORDS: Spatial analysis, land values, mass transit, GIS, BangkokIntroductionUrban rent theory implies that the value of land is essentially influenced by the trade-offbetween accessibility and transport costs (Alonso, 1964; Muth, 1969; Evans, 1973). Theprice of land in urban rent theory, however, is treated as the price of pure land at a specificlocation, which is contrary to some recent suggestions that land is a composite good, and itsvalue should be based on location-specific characteristics including neighbourhood andlocal public amenities (Cheshire & Sheppard, 1995). Infrastructure improvement thus playsan important role in the rise of land values. In particular, accessibility improvement in theCorrespondence Address: Sutee Anantsuksomsri, Waseda Institute for Advanced Study, Waseda University,1-6-1 Nishi Waseda, Shinjuku-ku, Tokyo, 169-8050 Japan. Email: sutee@aoni.waseda.jpq 2015 Editorial Board, Urban Policy and Research
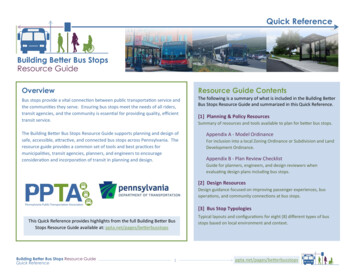
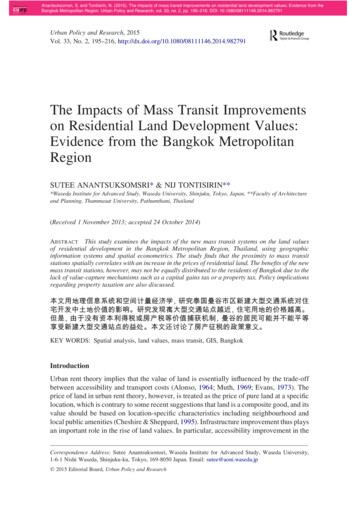
Downloaded by [Thammasat University Libraries] at 01:12 04 June 2015196S. Anantsuksomsri & N. Tontisirinform of public transportation or road improvement is found to cause the value of land to rise(Medda & Modelewska, 2010). Nonetheless, in many urban areas of developing countries inwhich the cities are often characterised as automobile oriented, the improvement in publictransit can cause significant changes in land values that are unevenly distributed amonglandowners and other stakeholders (Smolka, 2013). For these developing countries, valuecapturing mechanisms such as land value tax do not exist, further widening the disparitybetween the value of the land adjacent to infrastructure improvements and the land locatedfarther away. Without knowing the impact of public infrastructure improvement on thevalue of land, the value-capturing mechanism cannot be implemented efficiently.Within the past few decades, Bangkok has faced rapid growth in urban development dueto the improvement in road and highway systems as well as the introduction of new publictransportation. Many new residential developments in Bangkok have grown rapidly. Likemany developing countries, Thailand lacks effective land value-capturing policies(Ratanawaraha, 2010). As a result, the disparity between the land close to new publictransit and the land farther away has not been considered. Nevertheless, there have beenfew detailed studies of residential land in Bangkok—even fewer with spatial effects takeninto consideration—and little is known about the impact of infrastructure improvement onland values.This study examines the impacts of mass transit on land values in Bangkok. It consistsof two major parts. The first part analyses the impact of proximity to mass transit—as wellas to other public amenities including hospitals, schools and parks—on residential landvalues, explicitly taking into consideration the spatial effects of the locations of masstransit stations in spatial hedonic models. The analysis of current housing and real estatedevelopments in the Bangkok Metropolitan Region (BMR) shows the evidence of changesin residential land values and patterns of urban structure with the impacts of existing andproposed rapid transit systems. It is one of the first attempts to examine the spatial relationsof public transit and residential development in the entire BMR using spatial analysismethods. The second part demonstrates how the estimated parameters from the first partcan be used in policy formation of land value taxation in Thailand. The study concludeswith a discussion regarding policy implications and further studies.Study Area: The Bangkok Metropolitan Region (BMR)Within the past two centuries, the urban area of Bangkok has been growing from a settlementon the bank of the Chao Phraya River to one of the major metropolitan areas in Asia. The BMRcovers an area of 7761.66 square kilometres and includes six provinces, namely, Bangkok,Nonthaburi, Nakhon Pathom, Pathum Thani, Samut Prakan and Samut Sakhon (see Figure 1).As shown in Figure 2, since the 1960s, its urban structure has been rapidly expanding due tothe development strategies in Thailand’s national development plans.To improve the quality of life and stimulate economic growth, a large amount ofgovernment expenditure has been invested in public infrastructure such as road networks,mass transit systems and utilities. However, urbanised areas have grown without effectivecontrol from the government, while housing development in the city has been led mainlyby real estate developers. Consequently, the urban areas of the BMR have expanded alongmajor road networks, resulting in strip developments, especially on the outskirts of theregion. BMR’s freeways have been major pathways for people to commute to the citycentre. As a result, traffic congestion has become one of the most serious problems of the
Downloaded by [Thammasat University Libraries] at 01:12 04 June 2015Impacts of Mass Transit Improvements197Figure 1. The Bangkok Metropolitan Region (BMR) in 2010Figure 2. The urban area of the BMR from 1900 to 1981. Source: Adapted from Sternstein (1982).
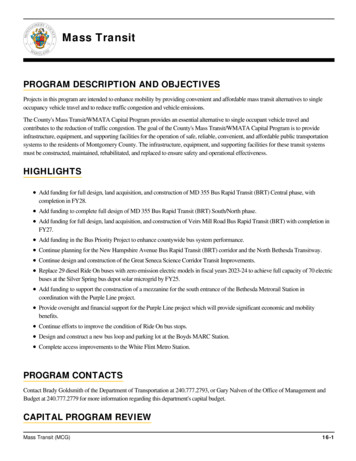
Downloaded by [Thammasat University Libraries] at 01:12 04 June 2015198S. Anantsuksomsri & N. Tontisirincity since the transportation policies in the past concentrated mostly on construction ofnew roads, rather than on traffic management.In order to ease the chronic traffic congestion in the BMR, a rapid transit project wasinitiated in the early 1990s. However, political interference and economic problemscaused the processes of planning and construction of the rail system to be slowlyimplemented. It was not until the late 1990s that the first mass transit system in Bangkok,the Bangkok Mass Transit System (BTS) Skytrain, was introduced. Soon after, the MassRapid Transit (MRT) Subway started operations in 2004. These mass transit systems havenot only alleviated traffic problems, but also assisted economic development and shapedthe urban structure of the BMR.As of 2013, there are three mass transit systems in the BMR: BTS Skytrain, MRTSubway and Airport Link. The current transit systems, however, are quite limited withinthe city centre, covering about 71.5 kilometres in length, which comprises only one sixthof the entire plan. Figure 3 shows the current network of mass transit systems in 2010 andthe full network which is expected to be completed in 2050, consisting of 12 transit linesand covering around 495 kilometres in length (Nara, 2004; Office of Transport and TrafficPolicy and Planning, 2009).Since the 1960s, Bangkok’s urban form has been characterised by automobile-orientedtransportation and urban sprawl toward its periphery. Since the emergence of the masstransit systems in the early 2000s, Bangkok urban development has intensified, especiallyin the inner areas where mass transit is accessible. A great number of new residentialdevelopments, for example, can be seen along mass transit routes. Like the impact of roadimprovement, the impact of the rapid transit systems may affect the values of land in thecity, resulting in greater disparities in land prices between land parcels located near masstransit stations and those located farther away.The impact of proximity to urban amenities and infrastructure on land prices isnot always distributed equally. The prices of land in Bangkok and its vicinity havedramatically increased, yet benefiting only a handful of the urban rich, landlords and realestate speculators. This phenomenon is one of the major factors contributing to increasinginequality in the BMR. These well-off people have received great benefits such as higherland values from public infrastructure investment, while other people like the urban poorhave to bear a higher cost of rent. Nonetheless, these disparities have not been wellunderstood by many stakeholders such as community residents, planners, policymakersand politicians involved in regional and urban planning in Thailand.Literature ReviewStudies of the Impact of Mass Transit Systems on Property ValuesSpatial hedonic models have been widely used in other studies of the impacts of masstransit systems on property values (So et al., 1997; Haider & Miller, 2000; Bae et al., 2003;Armstrong & Rodrı́guez, 2006; Celik & Yankaya, 2006; Chalermpong, 2007; Agostini &Palmucci, 2008). However, there are very few hedonic studies of the effect of transitaccessibility on the residential property market in developing countries due to the limitationof transit investments and the lack of available and reliable data (Chalermpong, 2007).As shown in Table 1, Chalermpong (2007) summarises the relevant studies on hedonicmodelling and accessibility premiums in cities outside North America and Europe. Most of
199Downloaded by [Thammasat University Libraries] at 01:12 04 June 2015Impacts of Mass Transit ImprovementsFigure 3. The mass transit systems in the BMR in 2010 and 2050. Source: Adapted fromChatchawal Phansopa (www.2bangkok.com)the reviewed studies use the Euclidean or straight-line distance from a property location tothe nearest transit station as a measure of accessibility. In a linear regression model, thecoefficient of the distance can be interpreted as the price premium of being located closer to
200S. Anantsuksomsri & N. TontisirinDownloaded by [Thammasat University Libraries] at 01:12 04 June 2015Table 1. Summary of hedonic studies outside North America and EuropeAuthor (publication year)Study area countryChalermpong (2007)Bangkok, ThailandCelik and Yankaya (2006)Izmir, TurkeyAgostini and Palmucci (2008)Bae et al. (2003)Santiago, ChileSeoul, South KoreaSo et al. (1997)Hong Kong, ChinaAccessibility premium(distance to nearest station) 10 per metreElasticity: 2 0.09 4.76 –18.70 per metreElasticity: 2 0.00011 to 2 0.00058 2 – 4.57 per metre3 per cent per kilometreElasticity: 2 0.16 to 20.223.3 per cent (if a property is locatedwithin 10-min walking distance of station)Source: Chalermpong (2007).a transit station. The coefficient is expected to be negative, meaning that the longer thedistance, the lower the property value. However, in the case of a log-linear model, thecoefficient can be interpreted as price elasticity with respect to the change in distance.In the case of Bangkok, Chalermpong (2007) studies relationships of BTS stations andproperty prices in the inner city of Bangkok. He finds that a property price gradientdecreases at approximately US 10 per square metre of liveable area for each additionalmetre away from BTS stations, and that price elasticity of distance is 2 0.09. The areastudied by Chalermpong (2007), however, covers only a part of the BMR, and theestimated parameters may not reflect the true effects of the proximity to public transit onland values. It is the aim of this study to find the true effects of the proximity to publictransit on land value in the entire BMR.Inequality Caused by Public InfrastructureGlaeser et al. (2009) state that people living in cities where there is inequality tend to beunhappy. They claim that inequality in a city can create higher crime rates, resulting innegative effects on the growth of city-level income and population. Urban inequality can stemfrom several causes such as differences in human capital (Glaeser et al., 2009) and unequalaccess to public infrastructure (Calderón & Serven, 2004; Estache, 2006). In developingcountries, one of the primary causes of inequality stems from the accessibility to publicinfrastructure. Ratanawaraha (2010) studied the urban inequality in Bangkok, Thailand.Showing evidence of economic rent-seeking activities created from public infrastructure inthe areas around Suvarnabhumi Airport, the new international airport in the BMR, he foundthat only some groups of people receive benefits from urban infrastructure investment.The concept of rent seeking was originated by Gordon Tullock in 1967. Economic rentseeking starts with economic intervention by a government biased toward special interests.Politicians and policymakers create economic rents by rewarding special interests withfavoured treatment or burdening their competitors with restrictions. This activity is theresult of poor transparency and bad governance in development plans. It not only increasesthe cost of development and investment but also creates uneven distribution of publicimprovement. Only some groups of people receive benefits from higher land value. In thecase of land value, theoretically, the value of land increases when development of nearbyurban infrastructure occurs. This development is done by using taxes or public money and
Impacts of Mass Transit Improvements201should be paid back to society because it is an unearned increment or an additional valuethat is not created from a personal investment. This, however, is not the case in Thailand.The mechanism of value-capture taxation is neither well developed nor effectivelyimplemented, resulting in unfairness between landowners who gain higher land value andtaxpayers who pay for public investments (Ratanawaraha, 2010). In this article, theframework for applying a value-capture mechanism to residential land taxation ispresented and discussed later in the policy implication section.Downloaded by [Thammasat University Libraries] at 01:12 04 June 2015Data and MethodologyThe database for spatial hedonic regressions in this study is drawn from two major datasets: residential land prices from the Real Estate Information Center (REIC) andgeographic information systems (GIS) data from the Department of Public Works andTown & Country Planning. The data from the REIC are market prices of residential land inreal estate projects in the BMR. This study uses market prices instead of official appraisalproperty values for many reasons. In Thailand, access to the official database of propertyvalues from the Department of Land is limited due to confidentiality concerns.Furthermore, the property value database may not be reliable since the data are sometimesbased on an outdated property appraisal value. Rather, a transaction value or a marketprice is more appropriate to represent the real value of land and is a better indicator forevaluating value changes in residential land use. Thus, the data used in this study aremarket prices rather than official appraisal prices.Residential Land PriceThe data of all single-family residential development projects in Thailand are collected bythe REIC. A single-family residential development project is a residential projectdeveloped by a real estate developer. A residential unit is occupied by a single family andincludes a land parcel (with or without a house). In 2010, there were 684 on-marketresidential real estate projects in the BMR. The data include developers’ names, locations,property prices, land prices, number of housing units, number of units sold, averagehousing areas and average land areas. In Thailand, the unit of land area is measured in‘Tarang Wah’ or square wah, which is approximately 4 square metres or 43.0556 squarefeet or 0.000988 acres. In this study, US 1 equals 30 Baht.The descriptive statistics of the attributes of residential development projects in theBMR are shown in Table 2. While the average prices of property in the data range fromTable 2. The descriptive statistics of REIC data in 2010 (number of observations ¼ 684)VariablesProperty price (Baht)Land price (Baht)Number of housing unitsNumber of units soldHouse area (sq. m)Land area (sq. wah)MedianMeanStd. dev.MinMax2 890 00030 0007642421504 014 28135 11011775531645 663 60319 8761361074990190 000300040351879 500 000217 50014651453650815Source: Authors’ calculation, Real Estate Information Center (2011).
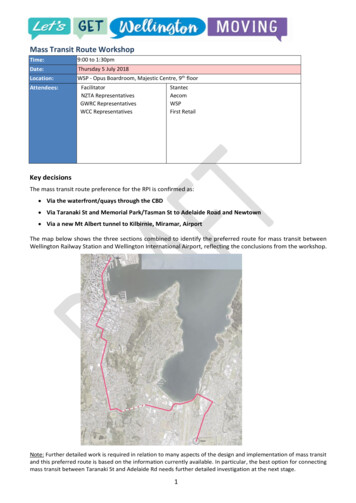
Downloaded by [Thammasat University Libraries] at 01:12 04 June 2015202S. Anantsuksomsri & N. Tontisirin190 000 Baht (US 6333) to 79 500 000 Baht (US 2 650 000), the average prices of land inthe data range from 3000 Baht per square wah (US 2.32 per square foot) to 217 500 Bahtper square wah (US 168 per square foot). The average land price is 35 110 Baht per squarewah (US 27.18 per square foot). The distribution of average land price per square wah inthe BMR is shown in Figure 4.The real estate projects in the BMR generally are developed by various types ofdeveloper, ranging from entrepreneurs who use their personal investments to financesmall-scale projects to international public companies investing in mega projects. As canbe seen in Table 2, the number of units in a project ranges from 4 to 1465. The usable areaor house area and land area represent a variety of residential products from a compacttownhouse to a spacious mansion on a large plot of land. The average house areas are53 square metres (412.62 square feet) and the average land areas are 164 square wah(7061.84 square feet or 0.16 acres).Figure 5 illustrates the land prices of single-family residential land developmentprojects in 2010 in the BMR. The average price of residential land in a real estate projectranges from under 1000 Baht per square wah (US 0.77 per square foot) to more than150 000 Baht per square wah (US 116 per square foot). As shown in the figure, theaverage price is represented in a range from light grey (low) to dark grey (high).The spatial distribution of locations of single-family residential projects in 2010 is alsoshown in Figure 5. Most of the residential developments are located outside the innerring road of the BMR; out of 684, only 5 projects are located within the inner ring road.As shown in Figure 5, the clusters of residential projects can be visually observed alongthe outer ring road, especially in the eastern and western areas of the BMR. A cluster ofhigh-priced land can be found in the east outside the inner ring road.As mentioned earlier about the availability and reliability of the database from theDepartment of Land, the data used in this study are the transaction prices of residentialland development. The observations in the data set are average prices of land in residentialland development projects which comprise the subpopulation of all residential real estateprojects in the market in the BMR in 2010. In addition, REIC reports that newly builtresidential property transactions accounted for 70 per cent of all residential transactionsin the BMR in 2010. Thus, residential land values in this data set are representative ofresidential land values in the city.Figure 4. The distribution of average land price per square wah
Downloaded by [Thammasat University Libraries] at 01:12 04 June 2015Impacts of Mass Transit Improvements203Figure 5. The spatial distribution of land price of single-family residential development projects inthe BMR in 2010GIS Data of the BMRThe GIS data include the locations of urban infrastructure and amenities in the BMR suchas road networks, mass transit stations, airports, hospitals, public parks, top schools,universities and shopping malls. With GIS data, population density is calculated at the subdistrict level, as well as all the distance variables, using ArcGISw software. As shown inFigure 6, most residential projects are located in sub-districts with a high populationdensity represented in darker grey. The density of population can also represent the densityof public infrastructure in the BMR.Table 3 summarises the descriptive statistics of single-family residential real estatedevelopment projects, population density in a sub-district where the project is located anddistances from the project to public amenities in the BMR in 2010. The average populationdensity of these sub-districts is 951 people per square kilometre. The population densityranges from 8 to 3666 people per square kilometre. The range of the population density isvery wide since the BMR by definition includes the less-populated agricultural areas inPathum Thani and heavily populated residential and commercial areas in Bangkok.The central business district (CBD) is usually referred to as the area in the sub-district ofLumphini. In this study, the CBD is located at the south-east corner of Lumphini Park atthe intersection of Rama IV Road and Ratchadamri Road. As mentioned earlier, mostsingle-family residential projects are located outside the inner ring road. The averagedistance from a project to the CBD is approximately 23 kilometres.
Downloaded by [Thammasat University Libraries] at 01:12 04 June 2015204S. Anantsuksomsri & N. TontisirinFigure 6. Population density in the BMRThe distribution of land price by distance to the city centre in Figure 7 also illustratesthat a land parcel located further from the city centre has a lower price. The slope of landprice decreases gradually from the city centre, supporting earlier findings that Bangkok isa monocentric city (Wisaweisuan, 2001). However, there are two small spikes at theranges of 11 – 13 and 35 –45 kilometres away from the city centre. The slope of land priceTable 3. The descriptive statistics of residential projects in the BMR in 2010 (number ofobservations ¼ 684)VariablesMedianMeanStd. dev.MinMaxLand priceNumber of housing unitsPopulation densityDistance toCBDArterial roadMass transit stationAirportHospitalPublic parkTop schoolUniversity30 0007685335 33011795120 716136716300048217 5001465366622 011105710 62731 212287139522951613023 374142711 87530 478371752314016701990061486810714 39137644841421750463655122244925811119061665 14010 14446 14188 70135 53546 76744 49147 260Source: Authors’ calculation.
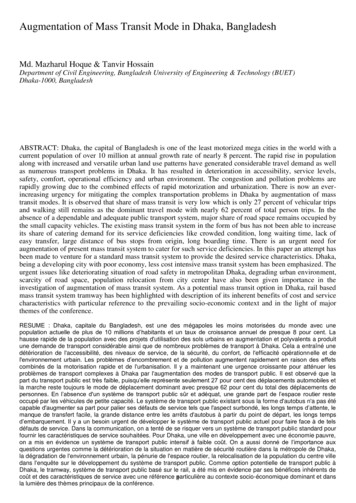
Downloaded by [Thammasat University Libraries] at 01:12 04 June 2015Impacts of Mass Transit Improvements205Figure 7. Average land price by distance to the city centre of the BMRin this figure conforms to the actual physical configuration of the inner and outer ring roadswhich are located at approximately 12 and 40 kilometres from the city centre.As shown in Table 3, the average distance from a project to an arterial road isapproximately 1.4 kilometres. While the closest distance from a project to an arterial roadis 1 metre, the farthest distance is around 10 kilometres. The distribution of land price bydistance to an arterial road in Figure 8 illustrates that a parcel of land located further from aroad has a lower price. The slope of land price within the distance of 0– 5 kilometres issteeper than the slope within the distance of 5 –7 kilometres, suggesting that the impact ofthe road to the land price is higher within 5 kilometres. The flat slope within the distance of5– 7 kilometres may suggest that the impact is very low. The prices of land located withinthese distances are relatively similar.Figure 9 shows that the price of residential land decreases when the land is located awayfrom a mass transit station. The slope of land price is slightly flat within the distance rangefrom 0 to 5 kilometres, suggesting that prices of residential land located within a travellingdistance of approximately 15 minutes to a mass transit station arterial road are relativelysimilar. The steeper slope with the distance of 5 –20 kilometres may indicate the highimpact of proximity to a mass transit station on the land price. Within these distances, theland price declines sharply when the land is located away from a mass transit station.As illustrated in Figure 10, the price of residential land tends to decrease when the landis located away from urban amenities such as hospitals, parks, schools and universities.Figure 8. Average land price by distance to arterial road in the BMR
Downloaded by [Thammasat University Libraries] at 01:12 04 June 2015206S. Anantsuksomsri & N. TontisirinFigure 9. Average land price by distance to mass transit station in the BMRThe price of land adjacent to or located less than 1 kilometre from a hospital or school islower than the land price located 1 kilometre away. This may suggest that living too closeto a hospital or school is not desirable. On the other hand, the price of land dramaticallydeclines if the land parcel is located farther from a university, especially within the firstkilometre. This may suggest that living close to a higher education institute is morepreferable than living close to a school.Model Specification and OLS EstimationThe analysis of land prices in the BMR under a hedonic modelling framework begins withthe specification of an ordinary least squares (OLS) model, which is the base model of thisstudy. After the hedonic OLS model is specified, spatial autocorrelation is examined.If spatial autocorrelation is found to be significant, spatial hedonic models are employed.The dependent variable is land price per square wah. Out of 684 observations, 62 outliersand missing data are excluded, leaving 622 observations for the estimation. Theindependent variables are categorised into three main groups: (1) real estate projectFigure 10. Average land price by distance to urban amenities in the BMR
Downloaded by [Thammasat University Libraries] at 01:12 04 June 2015Impacts of Mass Transit Improvements207characteristics, (2) location characteristics and (3) proximity to public infrastructure.The characteristics of real estate projects include number of housing units, number of unitssold, average house area and land area. The population density of the sub-district in whicha real estate project is located is considered as a location characteristic.Proximity to public infrastructure is measured by the Euclidean distance from a locationof a real estate project to locations of the nearest public amenities such as mass transitstations, major roads, CBD, airports, hospitals, public parks, top schools and universities.These distances may not all be present in a regression model since it violates the ceterisparibus assumption. Thus, only the distance to the nearest mass transit station is used as acontinuous distance. The other distances are classified into distance bands based on thedistribution of proximity to each type of public amenity.The proximity to the nearest arterial road is categorised into five distance bands: (1) lessthan 100 metres, (2) between 100 and 500 metres, (3) between 500 and 1000 metres, (4)between 1 and 5 kilometres, and (5) farther than 5 kilometres. On the other hand, the range ofdistances to the CBD and the nearest airport, hospital, public park, top school and universityis wider than the proximity to the nearest arterial road. The distances to the nearest hospital,park, school and university are grouped into three distance bands: (1) less than 1 kilometre,(2) between 1 and 5 kilometres, and (3) farther than 5 kilometres. In addition, the proximityto the CBD and the nearest airport is divided into three distance bands: (1) less than 10kilometres, (2) between 10 and 20 kilometres, and (3) farther than 20 kilometres.The hedonic OLS model is specified as follows:Y ¼ b0 þ X 1 b1 þ X 2 b 2 þ X 3 b3 þ 1ð1Þwhere Y is an N 1 vector of land price per square wahb0 is an N 1 vector of an interceptX1 is an N K1 matrix of real estate project characteristic variablesb1 is a K1 1 vector of a coefficient of X1X2 is an N K2 matrix of population density of a sub-district in which a realestate project is locatedb2 is a K2 1 vector of a coefficient of X2X3 is an N K3 matrix of proximity to public infrastructure variablesb3 is a K3 1 vector of X31 is an N 1 vector of random errorsK is the number of explanatory variables (K1 ¼ 4, K2 ¼ 1, K3 ¼ 8) andN is the number of observations (622 observations).Several tests were performed during the model selection process including the Bayesianinformation criterion (BIC), Akaike’s information criterion (AIC) and the test ofmulticollinearity. The model selection tests suggest the following explanatory variables:(1) distance to the nearest mass transit station, (2) sub-district population density, anddummy variables of distances to (3) arterial roads, (4) CBD, (5) airports, (6) hospitals,(7) public parks, (8) top schools and (9) universities. Appendix A shows the test results formulticollinearity. None of the variance inflation factors (VIFs) of predictor variables isgreater than 10, and the average VIF is 2.36, suggesting no serious multicollinearity.
208S. Anantsuksomsri & N. TontisirinDownloaded by [Thammasat University Libraries] at 01:12 04 June 2015Testing for Spatial AutocorrelationIn addition to the OLS estimation, spatial autocorrelation is examined. As illustrated inFigure 5, the geographic cluster of land prices can be visually inspected. To formally identifythe presence
transportation and urban sprawl toward its periphery. Since the emergence of the mass transit systems in the early 2000s, Bangkok urban development has intensified, especially in the inner areas where mass transit is accessible. A great number of new residential developments, for example, can be seen along mass transit routes. Like the impact .