Transcription
IN BRIEFTHE STATE OFFOOD SECURITYAND NUTRITIONIN THE WORLDTRANSFORMING FOOD SYSTEMSFOR AFFORDABLE HEALTHY DIETS
Required citation:FAO, IFAD, UNICEF, WFP and WHO. 2020. In Brief to The State of Food Security and Nutrition in the World 2020.Transforming food systems for affordable healthy diets. Rome, FAO.https://doi.org/10.4060/ca9699enThis booklet contains the key messages and content from the publication The State of Food Security andNutrition in the World 2020. The numbering of the table and figures corresponds to that publication.COVER PHOTOGRAPH Mint ImagesTHAILAND. Floating market on a canal in Bangkok, where local boats are laden with fresh food. 2
CONTENTSKEY MESSAGES4FOREWORD7PART 1FOOD SECURITY AND NUTRITIONAROUND THE WORLD IN 20201.1 Progress towards hungerand food insecurity targets} FIGURE 1 The number of undernourished peoplein the world continued to increase in 2019. If recenttrends are not reversed, the SDG 2.1 Zero Hungertarget will not be met} FIGURE 5 If recent trends persist, the distributionof hunger in the world will change substantially,making Africa the region with the highest numberof undernourished in 2030} FIGURE 7 Moderate or severe food insecurityaffects one quarter of the world population, and ithas been increasing over the past six years. Over halfof the population in Africa, almost one-third inLatin America and the Caribbean and more thanone-fifth in Asia are food insecure1.2 Progress towards global nutrition targets} FIGURE 10 Despite some progress for most indicators,only the 2025 target for exclusive breastfeeding ison track to be achieved. Childhood overweight andadult obesity trends need to be reversed1.3 The critical link between food security andnutrition outcomes: food consumptionand diet quality} FIGURE 20 The proportions of different foodgroups available for human consumption differacross country income groups: a snapshot of 20171.4 ConclusionsPART 2TRANSFORMING FOOD SYSTEMSTO DELIVER AFFORDABLEHEALTHY DIETS FOR ALL2.1 The cost and affordability of healthydiets around the world11} TABLE 7 The cost of a healthy diet is 60 percenthigher than the cost of the nutrient adequate diet,and almost 5 times the cost of the energy sufficientdiet in 2017} FIGURE 28 A healthy diet is unaffordable for thepoor in every region of the world in 201711122.2 The hidden health and environmentalcosts of what we eat} FIGURE 34 Adoption of any of the four alternativehealthy diet patterns would dramatically decreasediet-related health costs by 2030} FIGURE 37 Adoption of plant-based dietary patternswould reduce the social cost of GHG emissions by41–74 percent in 203014232327282931322.3 What is driving the cost of nutritious food?34} FIGURE 39 Protectionary trade policies protectand incentivize domestic production of staple foods,such as rice, but often to the detriment of nutritiousfoods in low-income countries37172.4 Policies to reduce the cost of nutritiousfoods and ensure affordability of healthy diets3819} FIGURE 41 Policy options to reduce the costof nutritious foods and enhance affordability ofhealthy diets with complementary policiesto promote healthy diets4015162122 3
KEY MESSAGESè Updates for many countries have made itè The world is not on track to achieve Zero Hungerpossible to estimate hunger in the world withgreater accuracy this year. In particular, newlyaccessible data enabled the revision of the entireseries of annual undernourishment estimates forChina back to 2000, resulting in a substantialdownward shift of the series of the number ofundernourished in the world. Nevertheless, therevision confirms the trend reported in past editions:the number of people affected by hunger globallyhas been slowly on the rise since 2014.by 2030. If recent trends continue, the number ofpeople affected by hunger would surpass840 million by 2030.è A preliminary assessment suggests that theCOVID-19 pandemic may add between 83 and132 million people to the total number ofundernourished in the world in 2020 depending onthe economic growth scenario.è Globally, the burden of malnutrition in all itsforms remains a challenge. According to currentestimates, in 2019, 21.3 percent (144.0 million) ofchildren under 5 years of age were stunted,6.9 percent (47.0 million) wasted and 5.6 percent(38.3 million) overweight.è Current estimates are that nearly 690 millionpeople are hungry, or 8.9 percent of the worldpopulation – up by 10 million people in one yearand by nearly 60 million in five years. The numberof people affected by severe food insecurity, which isanother measure that approximates hunger, shows asimilar upward trend. In 2019, close to 750 million– or nearly one in ten people in the world – wereexposed to severe levels of food insecurity.è The world is making progress but is not ontrack to achieve the 2025 and 2030 targets forchild stunting and low birthweight, and forexclusive breastfeeding, is on track only for the2025 target. The prevalence of wasting is notablyabove the targets. Most regions are not on track toachieve the targets for child overweight. Adultobesity is on the rise in all regions. Urgent actionis needed to reverse these upward trends.è Considering the total affected by moderate orsevere food insecurity, an estimated 2 billion peoplein the world did not have regular access to safe,nutritious and sufficient food in 2019. 4
è The nutritional status of the most vulnerablefive times more expensive than diets that meet onlydietary energy needs through a starchy staple.population groups is likely to deteriorate furtherdue to the health and socio-economic impacts ofCOVID-19.è The cost of a healthy diet exceeds theinternational poverty line (established at USD 1.90purchasing power parity (PPP) per person per day),making it unaffordable for the poor. The cost alsoexceeds average food expenditures in mostcountries in the Global South: around 57 percent ormore of the population cannot afford a healthy dietthroughout sub-Saharan Africa and Southern Asia.è Food insecurity can worsen diet quality andconsequently increase the risk of various forms ofmalnutrition, potentially leading to undernutritionas well as overweight and obesity.è Low-income countries rely more on staplefoods and less on fruits and vegetables and animalsource foods than high-income countries. Only inAsia, and globally in upper-middle-incomecountries, are there enough fruits and vegetablesavailable for human consumption to be able tomeet the FAO/WHO recommendation ofconsuming a minimum of 400 g/person/day.è All diets have hidden costs, which must beunderstood to identify trade-offs and synergiesin relation to other SDGs. Two hidden costs thatare most critical relate to the health (SDG 3) andclimate-related (SDG 13) consequences of ourdietary choices and the food systems thatsupport these.è While we still face significant challenges in justè Under current food consumption patterns,accessing food, challenges are even more importantin terms of accessing healthy diets.diet-related health costs linked to mortality andnon-communicable diseases are projected to exceedUSD 1.3 trillion per year by 2030. On the otherhand, the diet-related social cost of greenhouse gasemissions associated with current dietary patternsis estimated to be more than USD 1.7 trillion peryear by 2030.è Healthy diets are unaffordable to many people,especially the poor, in every region of the world. Themost conservative estimate shows they areunaffordable for more than 3 billion people in theworld. Healthy diets are estimated to be, on average, 5
KEY MESSAGESè Shifting to healthy diets can contribute tofood supply chain, within the food environment,and in the political economy that shapes trade,public expenditure and investment policies.Tackling these cost drivers will require largetransformations in food systems with noone-size-fits-all solution and different trade-offsand synergies for countries.reducing health and climate-change costs by 2030,because the hidden costs of these healthy diets arelower compared to those of current consumptionpatterns. The adoption of healthy diets is projectedto lead to a reduction of up to 97 percent in directand indirect health costs and 41–74 percent in thesocial cost of GHG emissions in 2030.è Countries will need a rebalancing ofagricultural policies and incentives towards morenutrition-sensitive investment and policy actionsall along the food supply chain to reduce foodlosses and enhance efficiencies at all stages.Nutrition-sensitive social protection policies willalso be central for them to increase the purchasingpower and affordability of healthy diets of themost vulnerable populations. Policies that moregenerally foster behavioural change towardshealthy diets will also be needed.è However, not all healthy diets are sustainableand not all diets designed for sustainability arealways healthy. This important nuance is not wellunderstood and is missing from ongoing discussionsand debates on the potential contribution ofhealthy diets to environmental sustainability.è To increase the affordability of healthy diets,the cost of nutritious foods must come down. Thecost drivers of these diets are seen throughout the 6
FOREWORDFive years after the world committed to end hunger, food insecurity and all formsof malnutrition, we are still off track to achieve this objective by 2030. Data tellus that the world is progressing neither towards SDG target 2.1, of ensuringaccess to safe, nutritious and sufficient food for all people all year round, nor towardstarget 2.2, of eradicating all forms of malnutrition.There are many threats to progress. The 2017 and 2018 editions of this report showedthat conf lict and climate variability and extremes undermine efforts to end hunger,food insecurity and malnutrition. In 2019, the report showed that economic slowdownsand downturns also undercut these efforts. In 2020, the COVID-19 pandemic, as well asunprecedented Desert Locust outbreaks in Eastern Africa, are obscuring globaleconomic prospects in ways no one could have anticipated, and the situation may onlyget worse if we do not act urgently and take unprecedented action.The most recent estimate for 2019 shows that prior to the COVID-19 pandemic, almost690 million people, or 8.9 percent of the global population, were undernourished. Thisestimate is based on new data on population, food supply and more importantly, newhousehold survey data that enabled the revision of the inequality of food consumptionfor 13 countries, including China. Revising the undernourishment estimate for Chinagoing back to the year 2000 resulted in a significantly lower number of undernourishedpeople worldwide. This is because China has one-fifth of the global population. Despitethis, the trend reported in past editions of this report still stands: since 2014, thenumber of hungry people worldwide has been slowly rising. The new estimate for 2019has revealed that an additional 60 million people have become affected by hunger since2014. If this trend continues, the number of undernourished people will exceed840 million by 2030. Hence, the world is not on track to achieve Zero Hunger, evenwithout the negative effects that COVID-19 will likely have on hunger. Preliminaryprojections based on the latest available global economic outlooks, also presented inthis report, suggest that the COVID-19 pandemic may add an additional 83 to132 million people to the ranks of the undernourished in 2020. 7
FOREWORDBeyond hunger, a growing number of people have had to reduce the quantity and qualityof the food they consume. Two billion people, or 25.9 percent of the global population,experienced hunger or did not have regular access to nutritious and sufficient food in2019. This situation could deteriorate if we do not act immediately and boldly.These trends in food insecurity contribute to increasing the risk of child malnutrition,as food insecurity affects diet quality, including the quality of children’s and women’sdiets, and people’s health in different ways. Hence, as painful as it is to accept, it isunsurprising that the burden of child malnutrition remains a threat around the world:in 2019, 21.3 percent (144.0 million) of children under 5 years of age were estimated tobe stunted, 6.9 percent (47.0 million) wasted and 5.6 percent (38.3 million) overweight,while at least 340 million children suffered from micronutrient deficiencies. The goodnews is that between 2000 and 2019, the global prevalence of child stunting declined byone-third. However, the world is not on track to achieve the global nutrition targets,including those on child stunting, wasting and overweight by 2030. Furthermore, adultobesity is on the rise in all regions. Projections for 2030, even without considering apotential global recession, serve as an added warning that the current level of effort isnot anywhere near enough to end malnutrition in the next decade.We can still succeed, but only by ensuring all people’s access not only to food, but tonutritious foods that make up a healthy diet. With this report, all five agencies aresending a strong message: A key reason why millions of people around the world sufferfrom hunger, food insecurity and malnutrition is because they cannot afford the cost ofhealthy diets. Costly and unaffordable healthy diets are associated with increasing foodinsecurity and all forms of malnutrition, including stunting, wasting, overweight andobesity. Food supply disruptions and the lack of income due to the loss of livelihoodsand remittances as a result of COVID-19 means that households across the globe arefacing increased difficulties to access nutritious foods and are only making it even moredifficult for the poorer and vulnerable populations to have access to healthy diets.It is unacceptable that, in a world that produces enough food to feed its entirepopulation, more than 1.5 billion people cannot afford a diet that meets the requiredlevels of essential nutrients and over 3 billion people cannot even afford the cheapesthealthy diet. People without access to healthy diets live in all regions of the world; thus,we are facing a global problem that affects us all.Current food consumption patterns also generate what this year’s report calls “hiddencosts” related to health costs (SDG 3) and climate-change costs (SDG 13). If current foodconsumption patterns continue, diet-related health costs linked to mortality anddiet-related non-communicable diseases are projected to exceed USD 1.3 trillion per 8
T H E S TAT E O F FO O D S ECU RI T Y A N D N U T RI T I O N I N T H E WO RL D 2020IN BRIEFyear by 2030. The diet-related social cost of greenhouse gas emissions associated withcurrent dietary patterns is estimated to reach more than USD 1.7 trillion per year by2030. Both of these hidden costs are a significant underestimation. The environmentalcosts do not account for other negative environmental impacts and the health costs donot account for the negative impacts of undernutrition due to data constraints. In lightof this evidence, it is clear that the adoption of healthy diets that include sustainabilityconsiderations can significantly reduce these hidden costs, generating importantsynergies with other SDGs.We must look throughout the food system to address the factors that are driving up thecost of nutritious foods. This means supporting food producers – especially small-scaleproducers – to get nutritious foods to markets at low cost, making sure people haveaccess to these food markets, and making food supply chains work for vulnerable people– from small-scale producers to the billions of consumers whose income is simplyinsufficient to afford healthy diets.Clearly, then, we face the challenge of transforming food systems to ensure that no oneis constrained by the high prices of nutritious foods or the lack of income to afford ahealthy diet, while we ensure that food production and consumption contribute toenvironmental sustainability. However, there is no one-size-fits-all solution forcountries, and policymakers will need to assess the context-specific barriers, managetrade-offs and maximize synergies – such as potential environment gains – to achievethe required transformations.We trust that the recommendations in this report, once tailored to each country context,will help governments to reduce the cost of nutritious foods, make healthy dietsaffordable for everyone and enable vulnerable people working in food systems to earndecent incomes that enhance their own food security. This will set in motion atransformation of existing food systems that makes them resilient and sustainable.Areas of policy emphasis should include rebalancing of agricultural policies andincentives towards more nutrition-sensitive investment; and policy actions all alongfood supply chains, with a focus on nutritious foods for healthy diets, to reduce foodlosses, create opportunities for vulnerable small-scale producers and others working infood systems, and enhance efficiencies. Nutrition-sensitive social protection policies willalso be central to increase the purchasing power and affordability of healthy diets bythe most vulnerable populations. An enabling environment should also be promoted bypolicies that, more generally, improve the nutritional quality of the food produced andavailable on the market, support the marketing of diverse and nutritious food, andprovide education and information for fostering individual and social behaviour changetowards healthy diets. 9
FOREWORDThese policy recommendations are in line with key recommendations under theUnited Nations Decade of Action on Nutrition, 2016–2025. We believe that the analysisconducted and policy recommendations provided in this report will also help set theagenda for the first UN Food Systems Summit, which will take place in 2021 with theoverarching goal of helping stakeholders better understand and manage complexchoices that affect the future of food systems and their needed transformation tosignificantly accelerate progress towards achieving the SDGs by 2030.Our agencies stand firmly committed to support a shift that makes healthy dietsaffordable to all and contributes to the eradication of hunger, food insecurity and allforms of malnutrition in children and adults. Our efforts shall ensure that this shiftunfolds in a sustainable way, for people and the planet, and creates synergies to spurprogress on other SDGs.Qu DongyuGilbert F. HoungboHenrietta H. ForeFAO Director-GeneralIFAD PresidentUNICEF Executive DirectorDavid BeasleyTedros Adhanom GhebreyesusWFP Executive DirectorWHO Director-General 10
PART 1FOOD SECURITY AND NUTRITION AROUND THE WORLD IN 2020Five years into the 2030 Agenda,it is time to assess progress andto question whether continuingefforts implemented thus far will allowcountries to reach SDG 2 targets. Forthis reason, this year’s reportcomplements the usual assessment ofthe state of food security and nutritionin the world with projections of whatthe world may look like in 2030 iftrends of the last decade continue.Importantly, as the COVID-19 pandemiccontinues to evolve, this reportattempts to foresee some of the impactsof this global pandemic on foodsecurity and nutrition. However, giventhat the full extent of the devastationthat COVID-19 will cause is still largelyunknown, it is important to recognizethat any assessment at this stage issubject to a high degree of uncertaintyand should be interpreted with caution.1.1 PROGRESS TOWARDSHUNGER AND FOODINSECURITY TARGETSKEY MESSAGESè Updates for many countries have made itpossible to estimate hunger in the world with greateraccuracy this year. In particular, newly accessible dataenabled the revision of the entire series of annualundernourishment estimates for China back to 2000,resulting in a substantial downward shift of the seriesof the number of undernourished in the world.Nevertheless, the revision confirms the trendreported in past editions of this report: the number ofpeople affected by hunger globally has been slowlyon the rise since 2014.è Current estimates are that nearly 690 millionpeople are hungry, or 8.9 percent of the worldpopulation – up by 10 million people in one yearand by nearly 60 million in five years.è Despite the re-assessment of the extent of hunger inChina, the majority of the world’s undernourished –381 million – are still found in Asia. More than250 million live in Africa, where the number ofundernourished people is growing faster than in anyother region of the world.è The number of people affected by severe foodinsecurity, which is another measure that approximateshunger, also shows an upward trend. In 2019, close to750 million – or nearly one in ten people in the world– were exposed to severe levels of food insecurity.è Considering the total affected by moderate or severelevels of food insecurity, an estimated 2 billion people inthe world did not have regular access to safe, nutritiousand sufficient food in 2019.è The world is not on track to achieve Zero Hunger by2030. If recent trends continue, the number of peopleaffected by hunger will surpass 840 million by 2030,or 9.8 percent of the population. 11
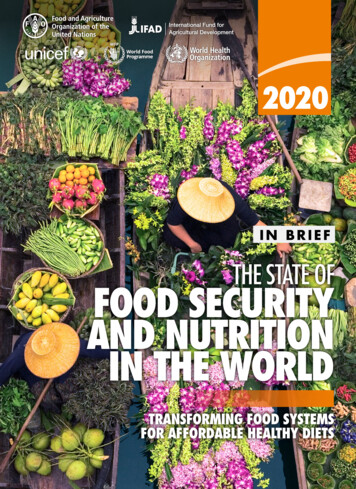
PART 1FIGURE 1 THE NUMBER OF UNDERNOURISHED PEOPLE IN THE WORLD CONTINUED TO INCREASE IN 2019.IF RECENT TRENDS ARE NOT REVERSED, THE SDG 2.1 ZERO HUNGER TARGET WILL NOT BE MET1 *.2030**YEARSPrevalence of undernourishment (percentage)Number of undernourished (millions)NOTES: Projected values in the figure are illustrated by dotted lines and empty circles. The shaded area represents projections for the longer period from 2019to the 2030 target year. The entire series was carefully revised to reflect new information made available since the publication of the last edition of the report;it replaces all series published previously. * See Box 2 in the report for a description of the projection method. ** Projections to 2030 do not consider thepotential impact of the COVID-19 pandemic.SOURCE: FAO.è A preliminary assessment suggests that the COVID-19pandemic may add between 83 and 132 million peopleto the total number of undernourished in the world in2020. The expected recovery in 2021 would bring thenumber of undernourished down but still above what wasprojected in a scenario without the pandemic.SDG Indicator 2.1.1Prevalence of undernourishment (PoU)The three most recent editions of thisreport already presented evidence thatthe decades-long decline in hunger inthe world, as measured using theprevalence of undernourishment (PoU),had unfortunately ended. Additionalevidence and several important dataupdates, including a revision of theentire PoU series for China back to 2000,shows that almost 690 million people inthe world (8.9 percent of the worldpopulation) are estimated to have beenundernourished in 2019 (Figure 1). Revisionin light of the new data, which results ina parallel downward shift of the entireglobal PoU series, confirms theconclusion of past editions of this report:the number of people affected by hunger 12
T H E S TAT E O F FO O D S ECU RI T Y A N D N U T RI T I O N I N T H E WO RL D 2020IN BRIEFin the world continues to increaseslowly. This trend started in 2014 andextends to 2019. There are nearly60 million more undernourished peoplenow than in 2014, when the prevalencewas 8.6 percent – up by 10 millionpeople between 2018 and 2019.in 2019. Yet, the PoU in the populationfor the region is 8.3 percent, below theworld average (8.9 percent), and lessthan half of that of Africa. Asia hasshown progress in reducing the numberof hungry people in recent years, downby 8 million since 2015.The reasons for the observed increase ofthe last few years are multiple. Much ofthe recent increase in food insecurity canbe traced to the greater number ofconf licts, often exacerbated byclimate-related shocks. Even in somepeaceful settings, food security hasdeteriorated as economic slowdownschallenge access to food for the poor.In Latin America and the Caribbean, thePoU was 7.4 percent in 2019, below theworld prevalence of 8.9 percent, whichstill translates into almost 48 millionundernourished people. The region hasseen a rise in hunger in the past fewyears, with the number of undernourishedpeople increasing by 9 million between2015 and 2019.The evidence also reveals that the worldis not on track to achieve the SDG 2.1Zero Hunger target by 2030. Combinedprojections of recent trends in the sizeand composition of the population, in thetotal food availability, and in the degreeof inequality in food access point to anincrease of the PoU by almost 1 percentagepoint. As a result, the global number ofundernourished people in 2030 wouldexceed 840 million.In terms of the outlook for 2030, Africais significantly off track to achieve theZero Hunger target in 2030. If recentrates of increase persist, the PoU willrise from 19.1 to 25.7 percent. LatinAmerica and the Caribbean is also offtrack, even though at a much lower level.Mostly due to deterioration in recentyears, the trend will bring the PoU from7.4 percent in 2019 to 9.5 in 2030. Asia,while making progress, will also notachieve the target by 2030 based onrecent trends.The PoU in Africa was 19.1 percent ofthe population in 2019, or more than250 million undernourished people,up from 17.6 percent in 2014. Thisprevalence is more than twice theworld average (8.9 percent) and is thehighest among all regions.Asia is home to more than half of thetotal undernourished people in theworld – an estimated 381 million peopleOverall, and without considering theeffects of COVID-19, projected trends inundernourishment would change thegeographic distribution of world hungerdramatically (Figure 5, right chart).While Asia would still be home to almost330 million hungry people in 2030, itsshare of the world’s hunger would shrinksubstantially. Africa would overtake 13
PART 1FIGURE 5 IF RECENT TRENDS PERSIST, THE DISTRIBUTION OF HUNGER IN THE WORLD WILL CHANGESUBSTANTIALLY, MAKING AFRICA THE REGION WITH THE HIGHEST NUMBER OF UNDERNOURISHED IN 2030OCEANIA2.4 (0.4%)LATIN AMERICAAND THE CARIBBEANOCEANIANORTHERN AMERICAAND EUROPEn.r. (0.9%)47.7 (6.9%)3.4 (0.4%)LATIN AMERICAAND THE CARIBBEANNORTHERN AMERICAAND EUROPEn.r. (1.0%)66.9 (7.9%)AFRICA250.3 (36.4%)ASIA329.2 (39.1%)ASIAAFRICA433.2 (51.5%)381.1 (55.4%)2019*: TOTAL 687.8 MILLION2030**: TOTAL 841.4 MILLIONNOTES: Number of undernourished people in millions. * Projected values. ** Projections to 2030 do not consider the potential impact of the COVID-19 pandemic.n.r. not reported, as the prevalence is less than 2.5 percent.SOURCE: FAO.Asia to become the region with thehighest number of undernourishedpeople (433 million), accounting for51.5 percent of the total.At the time of this writing, theCOVID-19 pandemic was spreadingacross the globe, clearly posing aserious threat to food security.Preliminary assessments based on thelatest available global economicoutlooks suggest that the COVID-19pandemic may add between 83 and132 million people to the total numberof undernourished in the world in 2020depending on the economic growthscenario (losses ranging from 4.9 to10 percentage points in global GDPgrowth). The expected recovery in 2021would bring the number ofundernourished down but still abovewhat was projected in a scenariowithout the pandemic. It is important torecognize that any assessment at thisstage is subject to a high degree ofuncertainty and should be interpretedwith caution. 14
IN BRIEFT H E S TAT E O F FO O D S ECU RI T Y A N D N U T RI T I O N I N T H E WO RL D 2020FIGURE 7 MODERATE OR SEVERE FOOD INSECURITY AFFECTS ONE QUARTER OF THE WORLD POPULATION, AND ITHAS BEEN INCREASING OVER THE PAST SIX YEARS. OVER HALF OF THE POPULATION IN AFRICA, ALMOST ONE-THIRDIN LATIN AMERICA AND THE CARIBBEAN AND MORE THAN ONE-FIFTH IN ASIA ARE FOOD INSECURE6049.45051.4 50.6 51.646.3 46.531.233.0 32.4 32.632.0 31.6 31.729.7 29.725.8 25.925.119.4 18.9 18.92014.1 14.4 15.116.322.921.416.4 16.311.4 11.4 11.8 13.01022.6 22.313.5 13.215.822.7 22.4 22.118.718.5 18.3 19.016.7 16.8 .39.29.6WORLDModerate food insecurityAFRICAASIALATIN AMERICAAND THE 31.21.01.1201920.6201824.8201723.2201622.4 22.429.42015302014PERCENTAGE40NORTHERN AMERICAAND EUROPESevere food insecurityNOTES: Differences in total are due to rounding of figures to the nearest decimal point.SOURCE: FAO.SDG Indicator 2.1.2Prevalence of moderate or severe foodinsecurity in the population, based on the FIESThe latest estimates suggest that9.7 percent of the world population(slightly less than 750 million people) wasexposed to severe levels of foodinsecurity in 2019. In all regions of theworld except Northern America andEurope, the prevalence of severe foodinsecurity has increased from 2014 to2019. This is also broadly consistent withrecent trends in the PoU in the world andacross regions, with the partial exceptionof Asia (Figure 7).While the 746 million people facingsevere food insecurity are of utmostconcern, an additional 16 percent of theworld population, or more than1.25 billion people, have experiencedfood insecurity at moderate levels. 15
PART 11.2 PROGRESS TOWARDSGLOBAL NUTRITION TARGETSPeople who are moderately foodinsecure do not have regular access tonutritious and sufficient food, even ifnot necessarily suffering from hunger.KEY MESSAGESè Globally, the burden of malnutrition in all its formsremains a challenge. According to estimates, in 2019,21.3 percent (144.0 million) of children under 5 yearsof age were stunted, 6.9 percent (47.0 million) wastedand 5.6 percent (38.3 million) overweight.The prevalence of both moderate andseve
diet in 2017 27} FIGURE 28 A healthy diet is unaffordable for the poor in every region of the world in 2017 28 2.2 The hidden health and environmental costs of what we eat 29}FIGURE 34 Adoption of any of the four alternative healthy diet patterns would dramatically decrease 31 FIGURE 37 Adoption of plant-based dietary patterns 32