Transcription
Using D2K Data Mining Platform for Understanding the DynamicEvolution of Land-Surface VariablesPraveen Kumar1, Peter Bajcsy2, David Tcheng2, David Clutter2, Vikas Mehra1, Wei-Wen Feng2, PratyushSinha1, and Amanda B. White11Department of Civil and Environmental Engineering, 2National Center of Supercomputing Applications,University of Illinois at Urbana-Champaign, Urbana, Illinois 61801 [e-mail:kumar1@uiuc.edu]Abstract- The objective of our project is to develop datamining and knowledge discovery in databases (KDD) techniques,using the “Data to Knowledge” (D2K) platform developed byNational Center for Supercomputing Application (NCSA), tofacilitate analysis, visualization and modeling of land-surfacevariables obtained from the TERRA and AQUA platforms insupport of climate and weather applications. The project isdeveloping capacity to access very large multivariate datasets;represent heterogeneous data types; integrate multiple GIS datasets stored in many GIS file formats; analyze variablerelationships and model their dependencies using cluster andgrid computing; and visualize input data, as well, as extractedfeatures, integrated data sets and data mining results.I. INTRODUCTIONThe objective of our research project is to develop datamining and knowledge discovery in databases (KDD)techniques, using the “Data to Knowledge” (D2K) platformdeveloped by National Center for SupercomputingApplication (NCSA), to facilitate analysis, visualization andmodeling of land-surface variables obtained from the TERRAand AQUA platforms in support of climate and weatherapplications.The project targets to address the science question: “How isthe global Earth system changing?” In particular it focuses onthe theme: What factors influence/modulate the changes inglobal ecosystem? The specific science questions that thisproject is focused on are:1) How are evolving surface variables such as vegetationindices, temperature, and emissivity, as obtained fromthe TERRA and AQUA platforms, dynamically linked?2) How do they evolve in response to climate variabilitysuch as ENSO (El Niño Southern Oscillation)? and3) How are they dependent on temporally invariantfactors such as topography (and derived variables suchas slope, aspect, nearness to streams), soilcharacteristics, land cover classification, etc?Answers to these questions, at the continental to global scaleswill enable us to develop better parameterization of therelevant processes in forecast models for weather, and interseasonal to inter-annual climate prediction. However,answering these questions at the continental to global scalerequires the ability to perform analysis of a multitude ofvariables using very large datasets. The proposed data miningsystem is targeted to build this capability for Earth sciencedatasets being collected by NASA.The salient features of the project are:Science: The project will explore scientific questions thathave not been addressed before and utilize new spatiotemporal data mining algorithms on remote-sensing andrelated data. The scientific novelty of our work consists of (1)data driven exploration of relationships between ecosystemand topography related variables, and (2) enabling improvedparameterization for climate and weather models. Thecomputer science novelty of the project includes (1) large datasize processing using cluster and grid computing, and (2) theapplication of data mining techniques to land-surface variablesand scientific modeling.Technology: The project will develop capacity to accessvery large multivariate datasets; represent heterogeneous datatypes; integrate multiple GIS data sets stored in many GIS fileformats; analyze variable relationships and model theirdependencies using cluster and grid computing; and visualizeinput data, as well, as extracted features, integrated data setsand data mining results.The strengths of our project lie in (1) NCSAsupercomputing power and storage available for processingand large data storage, (2) the well-established D2Kenvironment as a platform for software development, (3) theGIS library of software tools called I2K (Image toKnowledge) that enables us to perform GIS data ingestion,data integration and data visualization, (4) HDF file formatdevelopment at NCSA and supported in I2K, and (4)implementations of several data mining techniques in D2K.II. BACKGROUNDVery large volumes of data have been collected forhydroclimatological studies through satellites such as TERRAand AQUA and numerous other sources. However, the volumeof available data has far out stretched our ability to effectivelyuse them for hypothesis testing, modeling and prediction. Thisis primarily because we continue to use traditional tools ofscientific inquiry, such as statistical analysis or dataassimilation, over these large datasets. There are severallimitations of these methods. These techniques do not workvery well for incomplete, inconclusive, or heterogeneousdatasets. The use of these datasets are limited to smallfragments of the entire volume because the data reside onmultiple nodes of various organizations and are available indifferent formats that are not easy to integrate. This limits our
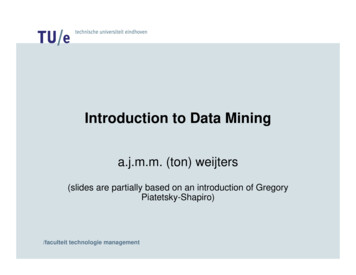
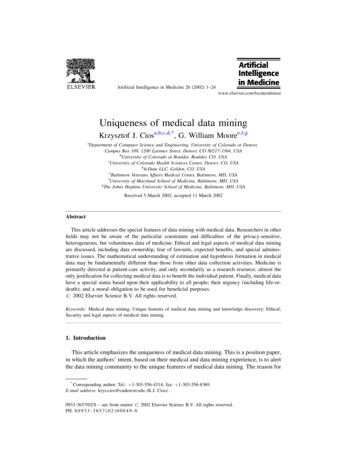
ability for formulating and testing hypothesis. In addition, ourscientific vision is stymied due to the use of fragmented andlimited datasets, and our ability to handle only "few variables"at a time. This limits the nature of hypothesis that areproposed and tested. The value of data is typically predicatedon the ability to extract higher level information: informationuseful for decision support, for exploration, and for betterunderstanding of the phenomena generating the data. Ourtraditional physics based and data driven approaches ofscientific inquiry breakdown as the volume and dimensionalityof data increases, thereby reducing the value of observed data.The premise of the project is: techniques for exploring largedatasets are now becoming available but have not beenextensively applied for the exploration of scientific data, andin particular for hydroclimatological studies; scientific inquirymethods developed for small datasets or “few variable''problems may not be effective for large datasets or “manyvariable'' problems; and there are pressing scientific questionsthat need answers and can be answered by effectivelyexploring the available observational data. During the lastseveral years, data mining or automatic knowledge discoveryin databases (KDD) tools capable of identifying implicitknowledge in databases have become available and these toolsaddress some of the limitations identified above. Their use incommercial settings has lead to very successful applications.However, their specialized use for various scientific problemsis limited, but initial work is underway [1, 2, 3, 4]. Datamining application to scientific data will enable us to develophypothesis about relationships of variables from observeddata. These new hypothesis combined with the existingunderstanding of the physical processes we already have canresult in an improved understanding and novel formulations ofphysical laws and an improved predictive capability, for bothclimate and (http://alg.ncsa.uiuc.edu/do/tools/d2k)environment for data mining. D2K is a rapid, flexible datamining and machine learning system that integrates analyticaldata mining methods for prediction, discovery, and deviationdetection, with data and information visualization tools. Itoffers a visual programming environment that allows users toconnect programming modules together to build data miningapplications and supplies a core set of modules, applicationtemplates, and a standard API for software componentdevelopment. All D2K components are written in Java formaximum flexibility and portability. Major features that D2Kprovides to an application developer include:1) Visual Programming System Employing a ScalableFramework2) Robust Computational Infrastructurea. Enables processor intensive applicationsb. Supports distributed computingc. Enables data intensive applicationsd. Provides low overhead for module execution3) Flexible and Extensible Architecturea. Provides plug and play subsystem architecturesand standard APIsb. Promotes code reuse and sharingc. Expedites custom software developmentsd. Relieves distributed computing burden4) Rapid Application Development (RAD) Environment5) Integrated Environment for Models and Visualizatio6) D2K Module Development: NCSA’s AutomatedLearning Group (ALG) has developed hundreds ofmodules that address every part of the KDD process.Some data mining algorithms implemented includeNaive Bayesian, Decision Trees, and apriori, as well asvisualizations for the results of each of theseapproaches. In addition, ALG has developed modulesfor cleaning and transforming data sets and a numberof visualization modules for deviation detectionproblems. Modules have also been created for specificprojects and collaborations.ALG NCSA is continuing development of moduleswith the short-term goal of enhancing the cleaning andtransformation modules, improving the data miningalgorithms and continuing development of featuresubset selection modules. Long-term, ALG plans tocontinue development of modules for predictivemodeling, image analysis and textual analysis,particularly toward enabling them for distributed andparallel computing. This type of work expedites theprocess of applying the latest research developments tobe used on real-world applications.7) D2K-driven Applications: D2K can be used as a standalone application for developing data miningapplications or developers can take advantage of theD2K infrastructure and D2K modules to build D2Kdriven applications such as the ALG application I2KImage to Knowledge. These applications employ D2Kfunctionality in the background, using modulesdynamically to construct applications. They presenttheir own specialized user interfaces specific to thetasks being performed. Advantages of coupling withD2K to build highly functional data mining applicationssuch as these include reduced development timethrough module reuse and sharing, and access to D2Kdistributed computing and parallel processingcapabilities.III. METHODOLOGY AND RESULTSTo support various data formats, a common interface isdesigned to visualize, preprocess and analyze the data. Someof the supported data formats include hierarchical data formats(HDF), digital elevation model (DEM), and geographicalinformation system (GIS) supported vector files. The overallsystem architecture has been divided into four parts (Fig. 1).These components are explained below:
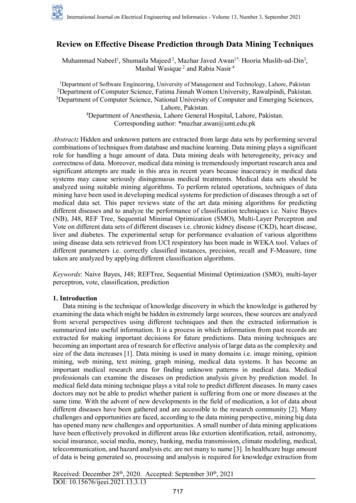
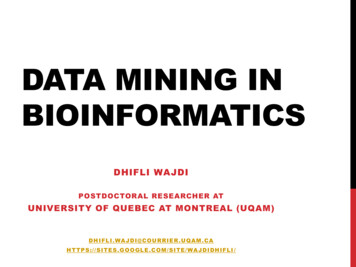
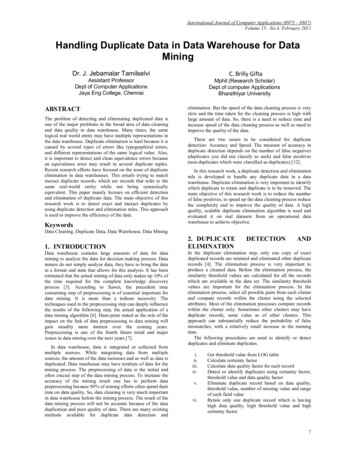
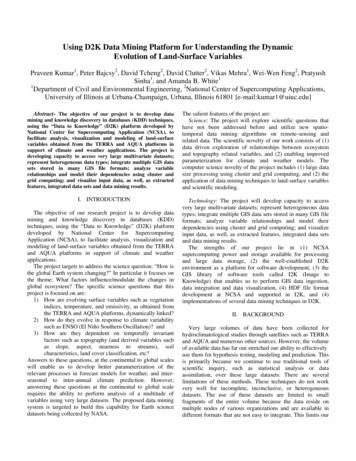
1) Read raster data using I2K: I2K is an image analysistool, designed to automate processing of huge datasets and iscapable of analyzing multi-dimensional and multivariateimage data. When analyzing multiple geographic datasets overthe same geographic area, it is necessary to preprocess andintegrate heterogeneous datasets. I2K is a key component forpreprocessing, visualizing and integrating the diverse datasets.I2K uses HDF libraries to load HDF data, and links to ArcGISEngine functionalities to operate on GIS data formats. Fig. 1shows the visualization of different scientific data sets: Snowcover, Albedo, LST (Land Surface Temperature), FPAR(fraction of Photosynthetic active radiation) and DEM.Fig. 2 shows Graphical User Interface (GUI) associatedwith the visualization of HDF data in I2K. An HDF file maycontain more than one scientific data set. User can select thescientific dataset (SDS) for display. Once the image is loaded,user can zoom, crop and play all spectral bands. Geographicalinformation and image related information associated with thedata sets can also be viewed by selecting GeoInfo andImageInfo options respectively in the menu bar.2) ArcGIS Engine: It is a complete library of GIScomponents which can be embedded into custom applications.I2K links to these libraries for features extractions e.g.calculation of slope, aspect, and flow accumulation grid fromDEM. These derived variables are used for analysis along withthe remote sensing data sets.3) Create Relational Database: Creating a user Database(Fig. 3) is a data preprocessing and integration step. Differentscientific datasets such as Enhanced Vegetation Index (EVI),Albedo, Leaf Area Index (LAI), Emissivity and Sea SurfaceTemperature (SST) are at different spatial and temporalresolution. Also there is quality assurance and quality control(QA/QC) data associated with each scientific variable. QA/QCdata provide information about the quality of data for eachpixel inside a scientific dataset.Fig. 1. Illustration of overall system architecture for data ingestion, preprocessing, integration, visualization and data analysis using various data miningalgorithms. I2K reads all data sets from different data sources and visualize (snow cover, Albedo). It calls GIS functions using ArcGIS engine interface toperform feature extraction tasks (slope, aspects). All measured and derived variable are ingested in to database after preprocessing (spatial and temporaladjustment, removing bad pixels using QA/QC). D2K is used to analyze this database and results are visualized in I2K.
Fig. 2. Generic tool for loading different datasets. Interactive visualization environment (zoom, crop, geographical information, play all spectral bands of data)for integrating data mining and visualization processes.To create an analysis database, we need to choose a uniquespatial and temporal resolution. This is done by upscaling ordownscaling the data. The unique spatial and temporalresolution is supplied by user as an input before creating thedatabase. User may be interested in analyzing the data for aparticular region only (Fig. 3). In that case (s)he can create amask by selecting the area that (s)he wants to analyze. QA/QCdata is used to remove bad pixel values e.g. no data values orbad pixel data received by satellite due to clouds. This optionis again provided by the user. After all the above processing isdone, integrated scientific and derived data sets are writteninto a database (Fig. 3).4) Use D2K for data mining: This task plays the central roleto enable automatic knowledge discovery through datamining. D2K uses database created in the above step as aninput. It has modules for a variety of algorithms like multipleregression, Naïve Bayes, Decision Tree, and Neural Networkto find various characteristic of data sets. Scientific questionwhich we aim to answer are: (1) identify the dependence ofthe dynamically evolving variables on each other and theirtemporal scales of variability; and identify the roles of climatevariability as a determinant of the variability in thedynamically observed quantities (2) identify how land-surfacecharacteristics (elevation, slope, aspects, soil properties etc)further modulate the dynamical evolution of vegetation.Overall procedure can be summarized as follows (Fig. 1):STEP 1. Ingest all data sets using I2KSTEP 2. Visualize each scientific data set as necessarySTEP 3. Use native I2K functions along with ArcGISEngine links to perform various featureextraction tasks.STEP 4. Use QA/QC to remove bad quality pixelSTEP 5. Perform upscaling or downscaling of SDS to getunique spatial and temporal resolutionSTEP 6. Mask the data setSTEP 7. Integrate data by writing all SDS and derivedvariables from SDS into databaseSTEP 8. Use D2K to run data mining algorithms ondatabase created in above step.STEP 9. Visualize results in I2K or GIS.
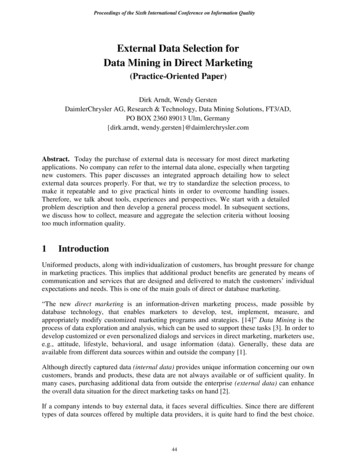
Fig. 3. Database Table: includes scientific data and derived variables (slope, aspects) after performing multiple preprocessing operations (use QA/QC data toremove bad pixel or no data values, spatial and temporal sampling adjustments, masking data sets, and error checking) and data integration.REFERENCESIV. SUMMARY AND CONCLUSIONWith the recent emergence of field of data mining, there is aneed for a system that can handle large data sets and dataassembly, preprocessing, and integration tasks. We aredeveloping I2K as a common interface which can load HDFdata from NASA data sources, supports visualization as wellas data preprocessing and integration tasks. Further, it can useand extend functionalities present in ArcGIS using ArcEngine.Data mining algorithms present in D2K are applied onintegrated data sets to find various patterns and relationsbetween different variables. The understanding developedthrough our analyses will enable us to better parameterize thevarious natural processes for weather and climate models andthereby improving their predictability.ACKNOWLEDGMENTThe support of this work is provided by the NationalAeronautics and Space Administration (NASA) (Grantnumbers NNG04GP78G and ESSF/O2-0000-0216) andNational Science Foundation (NSF) (Grant number EAR 0412859). Any opinions, findings, and conclusions orrecommendations expressed in this publication are those of theauthors and do not necessarily reflects the views of NASA orNSF.[1] Bajcy, P., P. Groves, S. Saha, T.J. Alumbaugh, and D.Tcheng, “ A system for territorial partitioning based onGIS raster and vector data,” Technical Report NCSAALG-03-0002, February 2003.[2] Koperski, K., “A progressive refinement approach tospatial data mining,”, Ph.D thesis , Simon FraserUniversity, pp. 175, April 1999.[3] Mesrobian et al., “Mining geophysical data forknowledge,” IEEE EXPERT, pp. 34-44, 1996.[4] White, A. B., P. Kumar, and D. Tcheng, “A data miningapproach for understanding topographic control onclimate-induced inter-annual vegetation variability overthe United States,” to appear in Remote Sensing ofEnvironment, 2005. iTo appear in the Proceedings of the 2005 NASA Earth-SunSystem Technology Conference, Maryland.
The proposed data mining system is targeted to build this capability for Earth science datasets being collected by NASA. The salient features of the project are: Science: The project will explore scientific questions that have not been addressed before and utilize new spatio-temporal data mining algorithms on remote-sensing and related data.