Transcription
Proceedings of the 2007 IEEE Symposium onComputational Intelligence and Data Mining (CIDM 2007)ADMIRAL: A Data Mining Based Financial Trading SystemGil Rachlin1 ,Mark Last1 , Dima Alberg1 and Abraham Kandel2Abstract— This paper presents a novel framework forpredicting stock trends and making financial trading decisionsbased on a combination of Data and Text Mining techniques.The prediction models of the proposed system are based on thetextual content of time-stamped web documents in addition totraditional numerical time series data, which is also availablefrom the Web. The financial trading system based on the modelpredictions (ADMIRAL) is using three different tradingstrategies. In this paper, the ADMIRAL system is simulatedand evaluated on real-world series of news stories and stocksdata using the C4.5 Decision Tree Induction Algorithm. Themain performance measures are the predictive accuracy of theinduced models and, more importantly, the profitability of eachtrading strategy using these predictions.I. INTRODUCTIONTheEfficient Market Hypothesis (EMH), as stated byFama ([7], [10], [11]), assumes that ‘Stock prices fullyreflect all their relevant information at any given point intime’. As the basis for growth and development of a moderneconomy this means that no information or analysis can beexpected to outperform the market and that stock pricesfollow ‘Random Walks’ ([9]), where a change in stock priceover time is purely random and statistically independent ofthe stock price in the past. However, to this day no one canexplain the anomalies in the market, which can be utilized toassure some short term predictive power ([6], [9], [12]).In making their own forecasts most financial specialiststry to exploit the time gap of the market's adjustment to newinformation. They reduce their risk by combining bothtechnical (base future price predictions on past prices) andfundamental (base predictions on real economy factors, suchas inflation, trading volume, organizational changes in thecompany etc.) analysis strategies, which are mentioned byGidófalvi ([4]) and fully explained by [9]. In order to obtainthe data required by both strategies, one can refer to variouspublicly available resources like the stock market itself, thecompanies, news articles, etc.A rather new source for information in the late 20th and the21st centuries is, of course, the Internet. In order to exploitManuscript received November 25, 2006. This work was partiallysupported by the National Institute for Systems Test and Productivity atUniversity of South Florida under the USA Space and Naval WarfareSystems Command Grant No. N00039-01-1-2248.1- Ben-Gurion University of the Negev, Department of InformationSystems Engineering, Beer-Sheva 84105, Israel, {gilrach, mlast, alberg}@bgu.ac.il2- Dept. of Computer Science and Engineering, University of SouthFlorida, Tampa, Florida 33620, USA, kandel@csee.usf.edu1-4244-0705-2/07/ 20.00 2007 IEEEthis relatively new media as an additional tool supporting theforecasting task, we need to combine techniques from bothtime series data mining and web content mining.The conventional approach to modeling stockmarket returns is to model the univariate time-series withautoregressive (AR) and moving average (MA) models.Recently, Engle [13] and Bollereslev [1,2] provided a newvery powerful tool for the modeling of financial data ingeneral and stock market returns in particular. The newprocess suggested by Engle and Bollereslev [14] is differentfrom earlier conventional time series models [7] in that,instead of making the assumption that the variances areconstant they allow the conditional variances to change overtime as functions of past errors. These models aredeterministic in the sense that they attempt to usemathematical equations to describe the process thatgenerates the time-series. A disadvantage of these modelslays in the assumption that trader or financial analyst needsto determine the appropriate number of lags and sometimesthe successful analysis is based on the experience ofanalyzing the enormous variety of time series econometricalmodels. The advantage of these models lays in their ultimateinterpretability.Most studies ([8], [13], [23]) agree that the process ofKnowledge Discovery in Databases (KDD), involvesiterating over four general steps each using independenttools: 1) data cleaning and preprocessing (create a commondata representation from different sources and different datatypes ranging from relational, transactional and spatialdatabases to large repositories of unstructured data such asthe World Wide Web), 2) discover relationships in the datausing data and text mining algorithms, 3) post processing ofdiscovered patterns, 4) Use the model to perform actions inthe real world.When adding the aspect of time to the Data Miningprocess, it is understood ([8]) that database records are timestamped and meaningful only as part of a time segment ortime series. In [8], Last et al. use a signal processingtechnique to pre-process the raw time series data.Most of the studies done in order to combine inferencefrom time-stamped news stories and time series stock dataare different in their concepts and methods. Each study usesa different time series, text classifier, features, targetattributes, time window length, weighting method etc.However, they do go through the following common stages: Define stock trends from the raw Time Series stock datausing similar methods to those used by [6]. Define a Window of Influence, which is a time frametaken before and after the publication time, t, of a web720
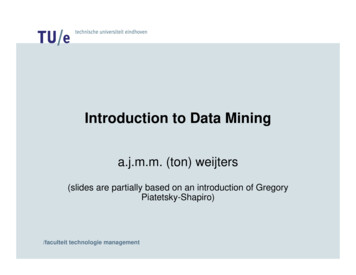
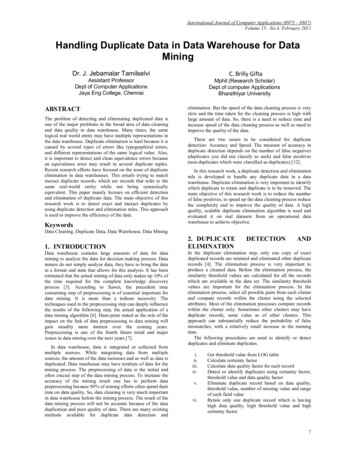
Proceedings of the 2007 IEEE Symposium onComputational Intelligence and Data Mining (CIDM 2007)article ([Window Start Point], [Window End Point]): In[2], Gidófalvi defined it as [-20, 20] minutes from thepublication time t. Lavrenko et al. ([3]) define theWindow as 5 hours before t ([-300, 0] minutes) and [15]use a one-hour Window before t ([-60, 0] minutes). Align the time stamped news articles to stock trendsaccording to the Window of Influence and score them: in[2] the news articles are scored relative to the change instock price and the change in the price of the index itbelongs to ( stock-price, index-price) and labels themin reference to a threshold value. Both [19] and [16]compare a predefined list of key words, which were givenby experts, to the occurrence of words in the text. According to the common KDD practice, induce a model,which learns how to classify an article with a predefinedtrend and use the prediction model to detect future trendoccurrences: [4] uses the Rainbow Naïve Bayesian textclassifier package and [5] also uses the Bayes theorem tofind trend relevance probability, but they compare a newarriving document about a certain stock against arepresentative 'language model' of five possible trends.Both [19] and [20] follow a rule base approach to createprobabilistic classification data-log rules, which areapplied to one or more backward time periods (one hourto one day). Evaluate the model prediction ability: [4] showed lowpredictive power explained by the existence of duplicatestories in the dataset. After running a 40-day simulationon the real market, [5] showed better results than randomactions. Predictions made by [19] outperformedconventional time series analysis, two different neuralnets and random guessing. [20] tried to predict the indicesof five global markets and the importance of their resultsis in showing that the best accuracy (sometimes over60%) was achieved in the US market indices.In this paper, we present a new system (Admiral) fordetecting stock trends based on the combination of DataMining and Web Content Mining techniques. Admiral - is anew Financial Trading System which: 1) creates a "meltingpot" of numeric and textual data before running an inductionalgorithm, 2) extracts automatically key words and phrasesinstead of using a prior expert list of phrases, 3) eliminatesthe need for word independence assumption by usingDecision Trees rather than Naïve Bayes, 4) extends theWindow of Influence of news articles in the prediction taskfrom minutes to days.The rest of this paper is organized as follows: In section IIwe describe the stages needed for ADMIRAL to beoperationally useful. Section III describes the evaluation ofthe system in a simulated environment. Section IV presentsthe evaluation results and finally, Section V provides theconclusions.II. ADMIRAL – PERFORMING THE PREDICTION STEPSThe ADMIRAL system is designed as a full cycleprediction system for stock trends according to past numericvalues of the stocks as well as their related textual webarticles. ADMIRAL goes through six steps, as shown in Fig.1, which are: Step 1: Data Collection from the Web. Step 2: Feature Extraction. Step 3: Textual Weighting. Step 4: Combined Data-Set Construction. Step 5: Classification Model (Decision Tree) Induction. Step 6: Market Action Recommendation.WebDocumentsFeature ExtractionTextualInformationExtractionSet of RawNumericalandTextual extualWeightingCombinedData SetRepresentationCreateDecision TreeSuggestMarketActionFig. 1. Prediction Scheme with Mixed Numerical and Textual DataMost steps are supported by various tools to perform thetask at hand. The preferred configuration of tools forADMIRAL's task can either be set manually orautomatically. The automatic setting aims at finding the bestconfiguration, which will eventually bring more accuratepredictions of the stock market. In this paper, the systemrecommendations are compared against actual market resultsin order to evaluate the predictive power of several systemconfigurations. Following is a brief description of each stepin the system.A. Step 1: Data CollectionIn this research, our system needs to collect data fromfinancial web sites, which are considered to have accuratereal-time data (numerical and textual). Good choices offinancial sites, which are also being used by financialprofessionals and can be used in our system are:http://www.forbes.com and http://today.reuters.com. Inorder to extract the relevant data from each one of theselected sites we created a configuration XML file, whichincludes its structural characteristics. Thus our systembecomes generic and whenever we are interested to collectdata from a new financial site the only addition will be thedefinition of an appropriate configuration XML file.The frequency of data collection for the textual trainingdata is once a day after the end of trade. For each textualarticle we keep its publication time stamp, its header andcontent. Numerical data is collected three times a day: after721
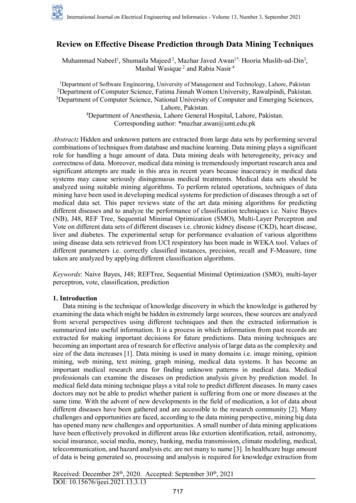
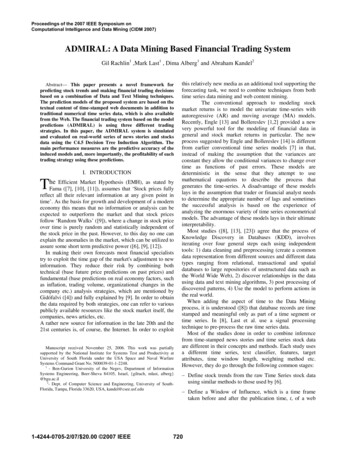
Proceedings of the 2007 IEEE Symposium onComputational Intelligence and Data Mining (CIDM 2007)the trade opens, in the middle of the day and after the tradeis closed.B. Step 2: Feature ExtractionThe feature extraction is done for both textual andnumerical data. Feature Extraction for Textual Data includestwo activities: first is the automatic extraction of key wordsand key phrases from a predefined Window of Influence.Second is the creation of a word vocabulary, which includesthe most influential words in all our past Web articles.Feature Extraction for the Numerical data also includes twoactivities: first is the calculation of additional commonlyused financial values. Second is the long term stock pricetrend discovery.The Automatic Key Word Extraction is done by theExtractor software package ([24]). The Extractor is a textsummarization engine, which uses a patented geneticextraction algorithm, GenEx. GenEx analyzes the recurrenceof words and phrases, their proximity to each other, and theuniqueness of the words in a particular document. Itremoves all stop words from the document, applies astemming procedure and selects a limited number of themost influential words in the document. In ADMIRAL, weconstruct each document, d, to be analyzed by the Extractor,as a set of the Web articles related to a specific stock withina backward Window of Influence.The Term Dictionary has a predefined number of words,which we define as N. It is rebuilt each time a new trainingset is evaluated for creating a new classification model. Eachword in the word dictionary receives a score S, whichdetermines its degree of membership inside the dictionaryand only the K highest ranking words will eventually beused from the final dictionary (K N). As seen in Equation1, the score, S, is calculated based on several parameters.S 1 TF 1 P B* ( * )2 N 2 L L(1)Where:L: the time frame, in days, for the word dictionary.B: the time window between the first and last occurrenceof a word.P: the number of days to the last occurrence of a word.TF: the number of occurrences of a word during L (knownas Term Frequency).N: the number of words in the dictionary.The Target Trends Definition is obtained by following themethod introduced by Last et al. in [8]. We are interested inthe value (stock rate) for each stock at each point ofmeasurement, t. Every such point is part of a trend of values(mostly increasing, mostly decreasing, mostly remain thesame) which has a starting point and an end point (the lengthof the trend is determined in day units), a slope degree and afluctuation of the values, which constitute the trend.We gave an equal importance to the Term Frequency vs.the multiplication of the last occurrence of a word and theblock of days where it occurred. As an example, let usdefine the final number of words to be entered into the worddictionary as 20,000 (N 20,000) and the total number ofdays for creating the word dictionary as 30 (L 30). Let usassume that the phrase "High Volume" appeared 8 times inall the previously collected documents (TF 8). The lastoccurrence of the phrase was 3 days ago (P 3). Its firstoccurrence was 10 days ago (B 7). Thus after substitutingthe values into Equation 1, the Grade of Membership S, forthe key phrase "High Volume" is set to 0.0118.C. Step 3: Term WeightingIn order to later use the extracted textual features withineach Window of Influence, [t-i, t] we need to assign anormalized value between zero and one to each key phrase.The normalization is done by dividing the weights, whichwere either provided by the Extractor or calculated using TFor Boolean methods ([16, 19]), by the overall grade ofmembership in the word dictionary, which was alsocalculated in Step 2 above.D. Step 4: Data Set ConstructionAfter having prepared both numerical and textual data andassigned a trend to each one of the stock's prices, we need tocombine the data, which we want to include in ourprediction task.Our goal is to predict the forthcoming trend, which willlast more than a predefined time length. Hence our targetattribute is the trend, which can take the following fivevalues: Up, Slight-Up, Expected, Slight-Down and Down.We assume that the target trend is influenced by the twolatest periods of textual data prior to its occurrence: [t-2i, t-i]and [t-i, t] and the extracted numerical trend information.We create a training dataset by concatenating all thatextracted data. The final dataset structure is shown in Table1.E. Step 5: Decision Tree InductionWe use a Decision Tree Induction algorithm, whichdoesn't assume attribute independence, The algorithm isC4.5 developed by Quinlan in [22]. This algorithm willyield a set of trend and length predicting rules on which wecan rely in order to perform our next step ofrecommendation. In order to show the effect of thecombination between Numerical and Textual data, we haveevaluated the algorithm on each separate type of data.An example of an induced decision tree is shown in Fig.2. Each path, which goes from the root node through thedifferent layers of nodes to a target node, can be viewed as adecision rule.722
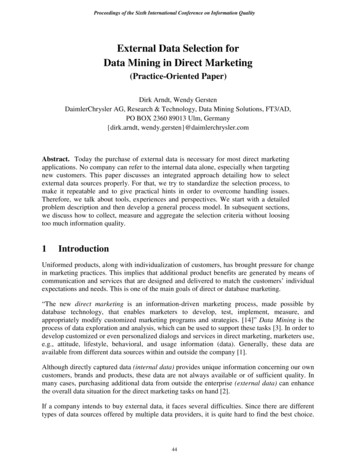
Proceedings of the 2007 IEEE Symposium onComputational Intelligence and Data Mining (CIDM 2007)TABLE 1. DATA SET STRUCTURETARGETCandidate Articles Windows of Influence (24 hours).number of key words/Phrases predefined (30 * 2).Data Set is for two consecutive backward windows.Date/TimeStamp(t)Stock01/01/2006 09:45MSFTGOOGGeneralNumerical DataTime window (t-2i)ßProfitRatioTerm11.7191.914 Time window (t-i)Term29Term 30Term1 Term29Term 270.35Down:.01/10/2006 17:45 .the expected future price. If the trend is Expected (stableprices) we do nothing.TABLE 2. REAL TIME MARKET ACTIONS BASED ON THE PREDICTED TRENDSTrend in the ModelActionUpBuyDownSell ShortExpectedNo ActionIII. SYSTEM EVALUATIONFig. 2. Example of a Decision Tree with two Target TrendsF. Step 6: Trading RecommendationAfter running the induction algorithms on the training set,the system can run on real-time data in order to recommendtrading actions. New data collected from the web sites areput through the above mentioned steps 1-4. After predictinga trend and its length from the induced model, a good andobjectively measurable trading strategy should be followed.We currently formulated three different, non random,trading strategies to be compared in this research:We decided to evaluate ADMIRAL on stocks from theUS NASDAQ index on a three months period time frame offinancial stock data from February 7th through May 7th 2006.We collected data on 40 stocks and later chose the fivestocks which had the largest amount of associated textualdata and which are listed in Table 3.TABLE 3: THE 5 STOCKS, WHICH WERE CHOSEN FOR OUR EXPERIMENTS Buy and Hold –at the beginning of a predefined timeperiod, we buy the recommended stocks and hold themuntil the end of the predefined time period. Automatic – We follow the exact recommendations of thesystem's rules defined in Table 2 below. Semi Automatic – We combine actions based on therecommendations of the system with our own assessment,which is based on our prior knowledge and guesses.As shown in Table 2, when an automatic strategy is usedthe recommended action is set according to the trend. If thetrend is Up we will buy the stock expecting to earn from theincrease. If the trend is Down we sell short, hoping to makemoney on the ability it gives us to sell at a higher price thanStockNumberStockSymbolStock CompanyStock Sector1CSCOCISCO SYSTEMS INC.Technology2EBAYEBAY INC.Services3MSFTMICROSOFT HOOYAHOO! INC.TechnologyThe data was collected from the two financial .forbes.com and http://today.reuters.com. Inaddition to their high reputation in the financial world, twomore reasons made us to choose them: first is that, at thetime of our experiments, the articles on each web site weremutually exclusive, which means that a comparison betweenthe information gathered from them would not overlap.Second, they allow data filtering according to requestedstocks, which reduced our information extraction efforts.723
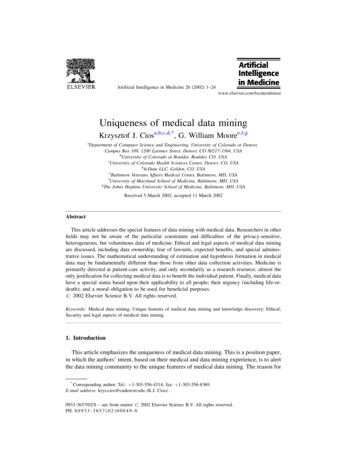
Proceedings of the 2007 IEEE Symposium onComputational Intelligence and Data Mining (CIDM 2007)TABLE 5: ROI RESULTS OF RANDOM, SYSTEM, AND BUY AND HOLD[SDTS] STRATEGIESIV. RESULTS AND COMPARISONSTable 4 lists the prediction accuracy results based ontextual and numeric data collected from two financialinternet sites: Forbes and Reuters. From this table, we notethat both sources gave us the same highest accuracy result(83.3%) for numeric data. In our opinion, this result is quiteexpected since both web sites are supposed to provide thesame numeric information on stock prices.On the whole, the most efficient source for textual andnumeric analysis is Reuter's site (reported accuracies are:82.4% for join textual and numeric analysis and 80.6% fortextual analysis) and on other hand we also note that the bestaccuracy result for pure textual analysis (80.6%) is notsignificantly lower than the best numeric and joint textualnumeric accuracy results. However, contrary to our initialexpectations, these results do not indicate that the textualinformation can improve the predictive accuracy of thenumeric analysis.TABLE 4: PREDICTION RESULTS ACCURACY (C4.5, .4%83.3%77.5%81.5%83.3%77.0%82.4%83.3%80.6%Table 5 shows the configurations, which had thehighest Return on Investment. It should be noted that inorder to compute the expected profit we needed to avoidovernight risk during hours when the market was closed.Thus we employed a Single Day Trading Strategy (SDTS),which was also used in other studies and was mentioned inthe literature ([15, 24]). This means that at the end of eachday all our short term stocks holdings were sold. We need tocompare our results against a random activity scheme, wherean arbitrary daily action is taken on each stock. The overallROI which was obtained on our data, was 2,091 inRandom Strategy, 2,000 in System RecommendationStrategy and 23,341 in Buy and Hold Day Trading Strategy(SDTS). The main drawback of random strategy stems fromits random nature, since a stockholder cannot change hisstockholding position, for instance he is unable to turn hissell position into a short sell position (TEVA -760.15), andvise versa.At the same time the other strategies allow thestockholder to execute switching in his stockholdingposition (sign of asterisks *- means that system hasperformed switching in stockholding position recently).From this aspect, the System Recommendation Strategylooks more preferable than Buy and Hold Day TradingStrategy (SDTS) because it required less switches ofstockholding position for the experimental period.StockRandomStrategyMSFTYHOOEBSYCSCOTEVA 911.8 2091 763.8 160.9 -760.1 SystemRecommendationStrategy 1280.5 2000.4 11264.2 * 16845.7 * 6850 *Buy and HoldStrategy [SDTS] 1969 20729.2 * 17626.8 * 16845.7 * 23341.4 *V. CONCLUSIONIn this research a new model for discovering future stocktrends by using data mining and web content miningtechniques was developed. The research study aimed atshowing an improvement in the stock trend profitability byfinding the best configuration of prediction and tradingstrategies. The methods to improve the profitability include:1. Combination of both numeric and textual data.2. The use of an automatic text extraction mechanisminstead of a predefined expert list.3. The use of decision tree prediction model instead ofNaïve Bayes classification.4. The use of smart trading strategies.5. The implementation of a full cycle prediction system(ADMIRAL).The components of the method were also evaluated andcompared against existing techniques on data from twomutually exclusive financial web sites. The proposedingredients of the method showed improved predictionability as well as improved profitability with a relatively lownumber of attributes necessary to achieve them.Future research may enhance the capabilities ofADMIRAL to take into account factors like different stockmarkets and different time zones, which can have criticalaffect on the prediction ability and should eliminate theassumption that the longer the time frame the better thepossible prediction results by using different sets of timeframes both consecutive and overlapping.Eventually, we believe that this research study makes asignificant contribution to the interaction of data mining andweb content mining fields with real time financial problemsfaced by financial analysts and it demonstrates a firstattempt to enhance the current methods.VI. ACKNOWLEDGMENTWe wish to thank the research participants Liat Suissa, OrliMorad, Itai Oksenfeld and Eyal Solomon for theircontribution to the Admiral's software coding andevaluation. This work was partially supported by theNational Institute for Systems Test and Productivity atUniversity of South Florida under the USA Space and NavalWarfare Systems Command Grant No. N00039-01-1-2248.724
Proceedings of the 2007 IEEE Symposium onComputational Intelligence and Data Mining (CIDM [11][12][13][14][15][16][17][18][19][20]T. Bollerslev, Generalized Autoregressive ConditionalHeteroscedasticity, Journal of Econometrics, 31, 307-327,1986.T. Bollerslev, A Conditionally Heteroscedastic Time SeriesModel For Speculative Prices and Rates of Return, Reviewof Economics and Statistics, 69(3), 542-546, 1987.E.F. Fama, Random Walks in Stock Market Prices, FinancialAnalysts Journal, September/ October 1965 (reprinted inJanuary-February 1995).G. Gidófalvi, 2001. Using News Articles to Predict c.com/517027.html] .V. Lavrenko, M. Schmill, D. Lawrie, P. Ogilvie, D. Jensenand J. Allan, Language Models for Financial NewsRecommendation, CIKM 2000, McLean, VA USA, ACM2000.M.A. Kaboudan, Genetic Programming Prediction of StockPrices, Computational Economics 16: 207-236, 2000.E.F. Fama, Long Term Returns and Behavioral Finance,Social Science Research Network.M. Last, Y. Klein and A. Kandel, Knowledge Discovery inTime Series Databases, IEEE Transactions on Systems, Manand Cybernetics – Part B: Cybernetics, Vol. 31 No. 1,February 2001.Z. Bodie, A. Kane, A.J. Marcus, Investments, 4th Edition,McGraw Hill, 2001.E.F. Fama, Efficient Capital Markets: A Review of Theoryand Empirical Work, Journal of Finance, 25 (May 1970):383-417.E.F. Fama, Efficient Capital Markets: II, Journal of Finance,46 (December 1991): 1575-1617.R.A. Huagen, The New Finance: The Case Against EfficientMarkets. Prentice-Hall, 1995.R.Engle and T. Bollerslev, Modelling the Persistence inConditional Variances, Econometric Reviews, 5, 81-87,1986.R. Engle, Autoregressive Conditional Hetroscedasticity withEstimates of the Variance of United Kingdom Infation,Econometrica, 50(4), 987-1007, 1982.A.K. Jain, M.N. Murty, P.J. Flynn, Data Clustering: AReview, ACM Computing Surveys, Volume 31, No. 3,September 1999.R. Cooley, B. Mobasher and J. Srivastava, Web Mining:Information and Pattern Discovery on the World Wide Web,In Proceedings of the IEEE International Conference onTools with Artificial Intelligence (ICTAI'97), NewportBeach, CA, November 1997.R. Kosala and H. Blockeel, Web Mining Research: ASurvey, SIGKDD Explorations, Volume 2, Issue 1.O. Maimon, A. Kandel and M. Last, Knowledge Discoveryand Data Mining, The Info-Fuzzy Network (IFN)Methodology, Norwell, MA: Kluwer, 2000.D. Peramunetilleke, R.K. Wong, Currency Exchange RateForecasting from News Headlines, Thirteenth AustralasianDatabase Conference (ADC2002), Melbourne, Australia,Conferences in Information Technology, Vol. 5.B. Wuthrich, V. Cho, S. Leung, D. Permunetilleke, K.Sankaran, J. Zhang, W. Lam, Daily Stock Market Forecastfrom Textual Web Data, In IEEE International Conferenceon Systems, Man. and Cybernetics, Volume: 3, Page(s):2720 -2725, 1998.[22][23][24]725L.Torgo, the TNT Financial Trading System: a midtermreport, ECML-PKDD Workshop on Data Mining forBusiness, 2005.J.R. Quinlan, C4.5: Programs for Machine Learning,Morgan Kaufman Publishers Inc., San Francisco, CA,1993.R Landry Jr., R. Debreceny, G.L. Grey, Grab Your Picksand Shovels! There's Gold in Your Data, Strategic Finance,January 2004, (85, 7).Extractor DBI technologies (2003) [http://www.dbitech.com]
The frequency of data collection for the textual training data is once a day after the end of trade. For each textual article we keep its publication time stamp, its header and content. Numerical data is collected three times a day: after 721 Proceedings of the 2007 IEEE Symposium on Computational Intelligence and Data Mining (CIDM 2007)