Transcription
Cleveland State UniversityBuilding a Data Mining Model usingData Warehouse and OLAP CubesSS Chung14
A data warehouse is a centralized repository that stores data from multiple information sources andtransforms them into a common, multidimensional data model for efficient querying and analysis. OLAPand Data Mining are two complementary technologies for Business Intelligence. Online AnalyticalProcessing (OLAP) is a technology that is used to organize large business databases and support businessintelligence. OLAP is a database technology that has been optimized for querying and reporting, instead ofprocessing transactions OLAP databases are divided into one or more cubes, and each cube is organizedand designed by a cube administrator to fit the way that you retrieve and analyze data. OLAP is used fordecision-support systems to analyze aggregated information for sales, finance, budget, and many othertypes of applications. OLAP is about aggregating measures based on dimension hierarchies and storingthese pre-calculated aggregations in a special data structure. With the help of pre-aggregations and specialindexes, you can query aggregated data and get decision-support query results back in real timeOLAP provides us with a very good view of what is happening, but can not predict what will happen inthe future or why it is happening. This part is done by datamining.Data Mining is a combination ofdiscovering techniques prediction techniques.The sequence of steps that will be followed in this project is1. Understand the Adventure works database which will be used in this project (fully understand thetransactional data available in the database).2. Getting familiar with Sql Server Analysis Services (SSAS) tools and various dataminingalgorithms such as Clustering,Association,Time Series etc in the SSAS tool3. The next step will be to come up with a list of questions: what questions need to be answered,what metrics will help business managers monitor and grow the business.4. Based on the business questions that need to be answered, data staging layer in a star schemaformat will be designed.5. Then the cube will be built to extract data from the Star schema staging layer and we perform ourdata mining on the cube.6. Perform Datamining in the Adventure works database to find hidden patterns and informationusing DMX and MDX.1. Adventure works database:In this section we will try to understand the Adventureworks database that will be usedas a part of the project.We try to understand scope of the business its various components andproducts etc.1.1. Business Overview:Adventure Works Cycles is a large multinational bicycle manufacturer, with headquarters located inBothell, Washington. The company has approximately 300 employees, 29 of which are salesrepresentatives. The primary distribution channel for Adventure Works Cycles through the retail stores oftheir resellers. These resellers are located in Australia, Canada, France, Germany, the United Kingdom,and the United States. Adventure Works Cycles also sells to individual customers worldwide by means ofthe Internet.Adventure Works Cycles has five major product offerings: Bikes – Three primary bike product lines: Mountain, Road, and Touring. Accessories – Examples include helmets and water bottles. Clothing – Examples include jerseys and biking shorts.Sunnie S Chung CIS 611
Components – Examples include bottom brackets and frames. Services – Examples include premium service and standard service.The version of Adventure works database that will be used in this project is Adventure works 2012/2014Sunnie S Chung CIS 611
2. Building Data Mining Project with Data Warehouse and CubeIn the following section we will understand what a star schema is and the various terms in star schemasuch as fact table, dimension table, measures, groups, etc and then design a star schema based on a list ofquestions. This understanding will be the first step in our Data mining activity we will be performing as apart of this project.5.1. Star schema, Fact Tables and Dimension TablesThe star schema architecture is the simplest data warehouse schema. It is called a star schema because thediagram resembles a star, with points radiating from a center. The center of the star consists of fact tableand the points of the star are the dimension tables.A fact table typically has two types of columns: foreign keys to dimension tables and measures those thatcontain numeric facts. A fact table can contain fact's data on detail or aggregated level.A dimension is a structure usually composed of one or more hierarchies that categorizes data. If adimension hasn't got a hierarchies and levels it is called flat dimension or list. The primary keys of eachof the dimension tables are part of the composite primary key of the fact table. Dimensional attributeshelp to describe the dimensional value. They are normally descriptive, textual values. Dimension tablesare generally small in size then fact table.Typical fact tables store data about sales while dimension tables data about geographic region (markets,cities), clients, products, times, channels.5.2. Steps in Star Schema Design:1.2.3.4.5.Identify a business process for analysis (like sales)Identify measure or facts (sales dollar)Identify dimensions for facts (product dimension, location dimension, etc)List the columns that describe each dimension (region name, branch dimension, etc)Determine the lowest level of summary in a fact table (sales dollar)3. Cube AND MDX:3.1.Cube:OLAP Cube is the basic unit of storage for Multidimensional data, on which we can do analysis on storeddata and study the various patterns.Sunnie S Chung CIS 611
3.2.Dimensions:The primary functions of dimensions are to provide Filtering, Grouping and Labeling on your data.Dimension tables contain textual descriptions about the subjects of the business. Dimensions in generalwe can say are the Master entities with related member attributes using which we can study data stored inOLAP Cube Quickly and effectively.3.3.Measure & Measure GroupsMetrics value stored in your Fact Tables is called Measure. Measures are used to analyze performance ofthe Business.Measure usually contains numeric data, which can be aggregated against usage of associateddimensions. Measure Group holds collection of related Measure3.4.Steps in Building and Deploying a cube:To build an SSAS cube, you must first start a project by following these steps:All Programs - Microsoft SQL Server - SQL Server BIDSCreate an Analysis Services project.Name your project FirstCube and click OK.You’re now presented with an empty window, which seems like a rare beginning to a project with atemplate; really, you have nothing to start with, so it’s time to start creating. The first component you’llneed is somewhere to retrieve data from: a data source.Building a Data SourceTo create the data source you’ll use for your first cube, follow these steps:Sunnie S Chung CIS 611
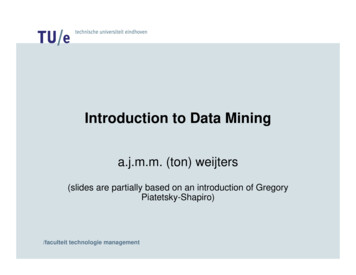
Navigate to the Solution Explorer pane on the right, right-click Data Sources, and click New Data Source.This will bring up the Data Source Wizard, which will walk you through the creation process.The next component you’ll create is the data source view.Meanwhile, go ahead and click Next to continue creating your data source. In this next screen, it’s time toset up a connection string.If your AdventureWorksDW database is visible as a selection already, go ahead and choose it; if not,click New.For your server name, enter (local), and then drop down the box labeled Select or Enter a Database Nameand chooseAdventureWorksDW.Click OK to return to the wizard and then click Next.You can now enter the user you want SSAS to impersonate when it connects to this data source. SelectUse the Service Account and click Next. Using the service account (the account that runs the SQL ServerAnalysis Server service) is fairly common even in production, but make sure that service account hasprivileges to read your data source.For your data source name, type AdventureWorksDW and then click Finish.Building a Data Source ViewFollow the below steps:Right-click Data Source Views and choose New Data Source View. Predictably, up comes the DataSource View Wizard to walk you through the process. Click Next.Make sure the AdventureWorksDW data source is selected and then click Next.On the Select Tables and Views screen, choose FactInternetSales under Available objects and then clickthe right arrow to move it into the Included Objects column on the right.To add its related dimensions, click the Add Related Tables button as shown in Figure 18-3 and then clickNext. Note that one of the related tables is a fact, not a dimension. There’s no distinction made at thislevel. Later, you will be able to select and edit dimensions individually.Sunnie S Chung CIS 611
On the last screen, name your data source view according to its contents: Internet Sales.Click Finish to create the Internet Sales data source view.Sunnie S Chung CIS 611
Creating an Analysis Services Cube. Right-click Cubes in the Solution Explorer and select New Cube tobring up the Cube Wizard. This will walk you through choosing measure groups, the measures withinthem, and your dimensions for this cube, click Next. On the Select Creation Method screen, make sureUse Existing Tables is selected, and click Next.The wizard will now want you to tell the wizard where to find measure groups. You could help it out bytelling the wizard that those are in your fact tables and then click Next.Sunnie S Chung CIS 611
Now the wizard would like to know which measures from your measure groups (fact tables) you’d like tostore in the cube. By default, it’s got them all selected; go ahead and accept this by clicking Next.At this point, you have measures, but you still need some dimensions; the wizard will select thedimension tables from your data source view to create as new dimensions. Again, by default they’re allselected, and you can click Next.The wizard is now ready to complete. Verify everything is done as per above steps. If everything appearsto be in order, click Finish.Sunnie S Chung CIS 611
Deploying the CubeDeploying process can be started by following these steps.Select Deploy First Cube on the Build menu. You’ll see a series of status messages as the cube is built,deployed, and processed for the first time. You’ll receive a few warnings when you deploy FirstCube,and if they’re warnings and not errors, you can safely ignore them for now.When it’s done and you see Deployment Completed Successfully in the lower right, your first cube isready to browse.Sunnie S Chung CIS 611
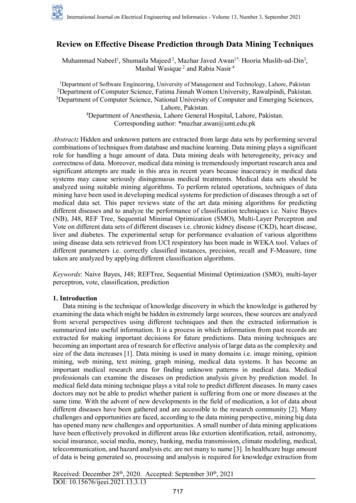
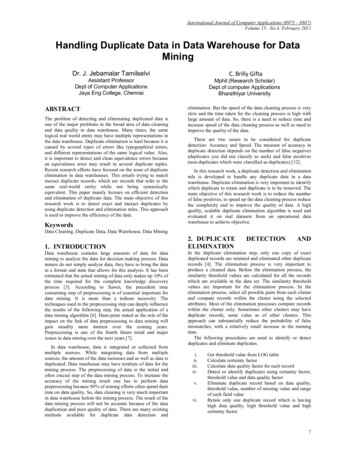
4. Querying On Cubes Using MDX-Examples4.1.Queries:What is sales amount in all the countries?select non empty([Dim Sales Territory].[Sales Territory Country].children) on rows,[Measures].[Sales Amount]on columnsfrom [star sale trend analysis]Sunnie S Chung CIS 611
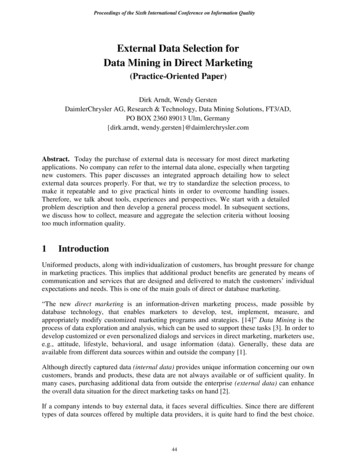
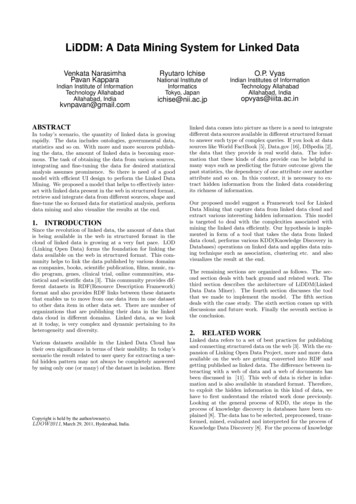
What is total sales amount in all countries for the year 2007?select non empty([Dim Sales Territory].[Sales Territory Country].children) onrows,[Measures].[Sales Amount]on columns from [star sale trend analysis] where [OrderDate].[Calendar Year].&[2007]Sunnie S Chung CIS 611
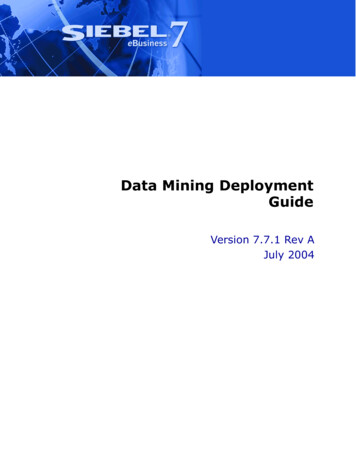
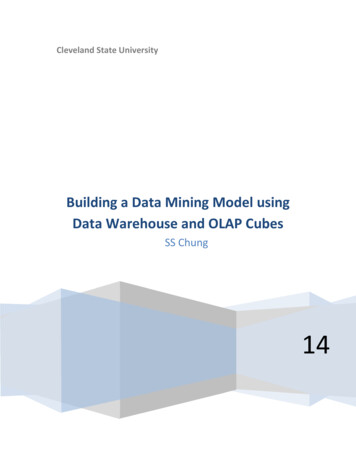
Retrieve all the products in descending order of their Internet sales amount of year 2007select nonempty([Measures].[Sales Amount]) on columns,order([Dim Product].[English Product Name].members ,[Measures].[Sales Amount],desc) on rowsfrom [star sale trend analysis]where {[Fact Internet Sales - Order Date].[Calendar Year].&[2007]}Sunnie S Chung CIS 611
What is the product wise sales in United States?select non empty([Dim Product].[English Product Name].children) on rows,[Measures].[Sales Amount] on columns from [star sale trend analysis]where [Dim Sales Territory].[Sales Territory Country].&[United States]Sunnie S Chung CIS 611
5. References1.2.3.4. Data-Mining-With-Sql-Server-2008SQL Server 2012 Tutorials - Analysis Services Data MiningData Mining: Concepts and Techniques by Jiawei Han (Author), Micheline Kamber (Author)Internet rv o-Write-Custom-MDX-Query-First-Time spx ap-cubes e-marketing-analysis-part-1/ spx5. Software Used:Microsoft SQL Server,Microsoft Visual Studio 2012 or any higherMicrosoft SQL Server 2012 Business IntelligenceSunnie S Chung CIS 611
Building a Data Source View Follow the below steps: Right-click Data Source Views and choose New Data Source View. Predictably, up comes the Data Source View Wizard to walk you through the process. Click Next. Make sure the AdventureWorksDW data source is selected and then click Next.