Transcription
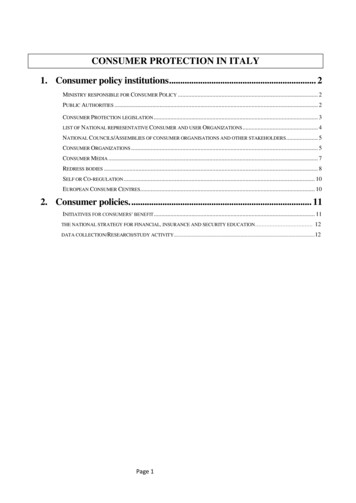
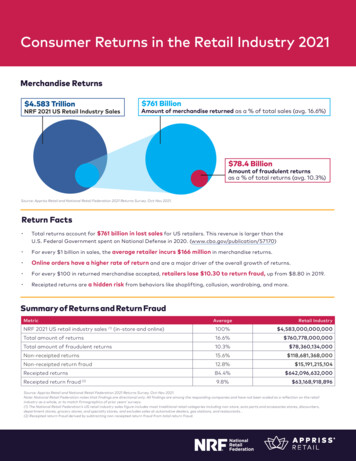
oC nsumer Returns in the Retail Industry 2021Merchandise Returns 4.583 TrillionNRF 2021 US Retail Industry Sales 761 BillionAmount of merchandise returned as a % of total sales (avg. 16.6%) 78.4 BillionAmount of fraudulent returnsas a % of total returns (avg. 10.3%)Source: Appriss Retail and National Retail Federation 2021 Returns Survey. Oct-Nov 2021.Return Facts T otal returns account for 761 billion in lost sales for US retailers. This revenue is larger than theU.S. Federal Government spent on National Defense in 2020. (www.cbo.gov/publication/57170) For every 1 billion in sales, the average retailer incurs 166 million in merchandise returns. Online orders have a higher rate of return and are a major driver of the overall growth of returns. For every 100 in returned merchandise accepted, retailers lose 10.30 to return fraud, up from 8.80 in 2019. Receipted returns are a hidden risk from behaviors like shoplifting, collusion, wardrobing, and more.Summary of Returns and Return FraudMetricNRF 2021 US retail industry salesAverage(in-store and online)Retail Industry100% 4,583,000,000,000Total amount of returns16.6% 760,778,000,000Total amount of fraudulent returns10.3% 78,360,134,000Non-receipted returns15.6% 118,681,368,000(1)Non-receipted return fraud12.8% 15,191,215,104Receipted returns84.4% 642,096,632,000Receipted return fraud (2)9.8% 63,168,918,896Source: Appriss Retail and National Retail Federation 2021 Returns Survey. Oct-Nov 2021.Note: National Retail Federation notes that findings are directional only. All findings are among the responding companies and have not been scaled as a reflection on the retailindustry as a whole, or to match firmographics of prior years’ surveys.(1) The National Retail Federation’s US retail industry sales figure includes most traditional retail categories including non-store, auto parts and accessories stores, discounters,department stores, grocery stores, and specialty stores, and excludes sales at automotive dealers, gas stations, and restaurants. .(2) Receipted return fraud derived by subtracting non-receipted return fraud from total return fraud.1Consumer Returns in the Retail Industry 2021
Holiday Returns 887 BillionNRF 2021 US Holiday Sales 158 BillionAmount of merchandise returned as a % of holiday sales (avg. 17.8%) 17.0 BillionAmount of fraudulent returnsas a % of holiday returns (avg. 10.8%)Source: Appriss Retail and National Retail Federation 2021 Returns Survey Oct-Nov 2021Were you planning to hire more staff to handle returns during the holidays? Yes, significantly more - 14.63% Yes, somewhat more - 41.46% No - 39.02% Unknown - 4.88%Source: National Retail Federation 2021 Returns Survey Oct-Nov 2021Holiday Return ChangesWhat were your plans to offer customers the option to make returns using 3rd party “no box”, “no label”providers to process your returns?ResponseAverageCurrently offer this2.44%Do not currently offer this but plan to roll it out during the 2021 Holiday season12.20%Do not currently offer but plan to roll it out after the 2021 Holiday season2.44%Do not currently offer and have no immediate plans82.93%Source: Appriss Retail and National Retail Federation 2021 Returns Survey Oct-Nov 20212Consumer Returns in the Retail Industry 2021
Online Returns 218 Billion 1.050 TrillionAmount of merchandise returned as a % of online sales (avg. 20.8%)NRF 2021 US Online Sales 23.2 BillionAmount of fraudulent returnsas a % of online returns (avg. 10.6%)Source: Appriss Retail and National Retail Federation 2021 Returns Survey Oct-Nov 2021Returns Can Be Great Opportunities Returns can improve experience. Your best shoppers often make the most returns. In-store returns are a method to meet and convert an online buyer. Returns can be managed. How they are handled impacts experience perceptions. Returns are an opportunity to sell to a known customer.Managing Online ReturnsIs the same department responsible for overseeingboth in-store and mail-in rce35.00%Loss oss PreventionOtherIn-store returns:25.00%0%25.00%50.00%Mail-in returns:8.33%58.33%8.33%25.00%Source: Appriss Retail and National Retail Federation 2021 Returns Survey Oct-Nov 20213MerchandisingConsumer Returns in the Retail Industry 2021
Return IssuesWhich Examples of Return Fraud Have Retailers Experienced in the Past Year?ResponseAverageWardrobing (returns of used, non-defective merchandise)68.42%Return of shoplifted/stolen merchandise56.14%Employee return fraud and/or collusion with external sources35.09%Return of merchandise purchased on fraudulent or stolen tender35.09%Returns using e-receipts28.07%Returns made by ORC groups19.30%Returns using counterfeit receipts10.53%None of the above5.26%Other5.26%Source: Appriss Retail and National Retail Federation 2021 Returns Survey Oct-Nov 2021What Are the Biggest Returns Challenges Retailers Are Facing Right Now? “Cost of processing and increase in volume” “Organized theft rings” “Fraudulent returns, or people using an item andthen returning” “No receipt, or wanting a cash refund with it not beinga credit card purchase” “Logistics costs and long shipping time, moving to multipleDCs and coming up with a standard process” “Lost/damaged packages and shipping delays” “Customer retention and/or converting to exchanges” “To keep track of return inventory and update it back intomy stock list” “Current policies regarding non-receipted returns andexchanges — it is encouraging fraudulent activity” “Timely processing of online returns due to insufficientcustomer documentation” “How to handle the refurbishing or reprocessing to the floor”“Products offered online only returned to stores andimmediately marked down, buying in bulk and returningmerchandise, returning and rebuying at a sale price”Do You Require Receipts for Returns?In-Store returnsMail-In returnsNo12.82%No25.64%Yes74.36%Source: Appriss Retail and National Retail Federation 2021 Returns Survey Oct-Nov 20214Consumer Returns in the Retail Industry 2021Yes87.18%
Post-Pandemic ReturnsReturn VolumesCompared to pre-pandemic levels, has the percentage of returns that are made to abrick-and-mortar store increased, decreased, or stayed the same?ResponseAverageIncreased significantly (More than 5%)26.19%Increased slightly (Between 1% and 5%)19.05%Stayed the same33.33%Decreased slightly (Between -1% and -5%)16.67%Decreased significantly (More than -5%)4.76%Source: Appriss Retail and National Retail Federation 2021 Returns Survey Oct-Nov 2021Managing ReturnsDo you charge for mailed/shipped returns?ResponseAverageYes, we currently charge39.53%No, but we plan to for the holiday season2.33%No, and we don’t plan to39.53%Not yet decided18.60%Source: Appriss Retail and National Retail Federation 2021 Returns Survey Oct-Nov 2021Return ChangesIn light of the recently announced package rate increases, are you changing any of yourreturns policies or providing expanded opportunities for customers to return their orders?ResponseAverageYes4.76%No59.52%Not sure35.71%Source: Appriss Retail and National Retail Federation 2021 Returns Survey Oct-Nov 20215Consumer Returns in the Retail Industry 2021
Lost Sales Tax Impact of Return FraudUS STATE% OFNATIONWIDERETAIL SALES(1)SALESRETURNSSTATE SALESTAX RATE(2)RETURN FRAUD ESTIMATELOSTLOST SALESRETAIL REVENUETAX REVENUEAlabama1.50% 68,745,000,000 13,683,057,5544.000% 1,409,354,928Alaska0.26% 11,915,800,000 2,371,729,9760.000% 244,288,188 56,374,197 0Arizona2.24% 102,659,200,000 20,433,365,9475.600% 2,104,636,693 117,859,655Arkansas0.91% 41,705,300,000 8,301,054,9166.500% 855,008,656 55,575,563California11.90% 545,377,000,000 108,552,256,5956.000% 11,180,882,429 670,852,946Colorado1.70% 77,911,000,000 15,507,465,2282.900% 1,597,268,918 46,320,799Connecticut1.25% 57,287,500,000 11,402,547,9626.350% 1,174,462,440 74,578,365Delaware0.37% 16,957,100,000 3,375,154,1970.000% 347,640,882 0Dist. of Columbia0.15% 6,874,500,000 1,368,305,7556.000% 140,935,493 8,456,130Florida7.30% 334,559,000,000 66,590,880,0966.000% 6,858,860,650 411,531,639Georgia3.01% 137,948,300,000 27,457,335,4924.000% 2,828,105,556 113,124,222Hawaii0.50% 22,915,000,000 4,561,019,1854.000% 469,784,976 18,791,399Idaho0.51% 23,373,300,000 4,652,239,5686.000% 479,180,676 28,750,841Illinois4.05% 185,611,500,000 36,944,255,3966.250% 3,805,258,306 237,828,644Indiana1.99% 91,201,700,000 18,152,856,3557.000% 1,869,744,205 130,882,094Iowa0.92% 42,163,600,000 8,392,275,3006.000% 864,404,356 51,864,261Kansas0.79% 36,205,700,000 7,206,410,3126.500% 742,260,262 48,246,917Kentucky1.26% 57,745,800,000 11,493,768,3456.000% 1,183,858,140 71,031,488Louisiana1.33% 60,953,900,000 12,132,311,0314.450% 1,249,628,036 55,608,448Maine0.51% 23,373,300,000 4,652,239,5685.500% 479,180,676 26,354,937Maryland1.99% 91,201,700,000 18,152,856,3556.000% 1,869,744,205 112,184,652Massachusetts2.34% 107,242,200,000 21,345,569,7846.250% 2,198,593,688 137,412,105Michigan3.10% 142,073,000,000 28,278,318,9456.000% 2,912,666,851 174,760,011Minnesota1.80% 82,494,000,000 16,419,669,0656.875% 1,691,225,914 116,271,782Mississippi0.89% 40,788,700,000 8,118,614,1497.000% 836,217,257 58,535,208Missouri1.97% 90,285,100,000 17,970,415,5884.225% 1,850,952,806 78,202,756Montana0.36% 16,498,800,000 3,283,933,8130.000% 338,245,183 0Nebraska0.62% 28,414,600,000 5,655,663,7895.500% 582,533,370 32,039,335Nevada1.14% 52,246,200,000 10,399,123,7416.850% 1,071,109,745 73,371,018New Hampshire0.67% 30,706,100,000 6,111,765,7070.000% 629,511,868 0New Jersey3.12% 142,989,600,000 28,460,759,7126.515% 2,931,458,250 190,984,505New Mexico0.62% 28,414,600,000 5,655,663,7895.125% 582,533,370 29,854,835New York5.93% 271,771,900,000 54,093,687,5304.000% 5,571,649,816 222,865,993North Carolina2.89% 132,448,700,000 26,362,690,8874.750% 2,715,357,161 128,979,465North Dakota0.25% 11,457,500,000 2,280,509,5925.000% 234,892,488 11,744,624Ohio3.39% 155,363,700,000 30,923,710,0725.750% 3,185,142,137 183,145,673Oklahoma1.00% 45,830,000,000 9,122,038,3694.500% 939,569,952 42,280,648Oregon1.27% 58,204,100,000 11,584,988,7290.000% 1,193,253,839 0Pennsylvania4.07% 186,528,100,000 37,126,696,1636.000% 3,824,049,705 229,442,982Rhode Island0.34% 15,582,200,000 3,101,493,0467.000% 319,453,784 22,361,765South Carolina1.36% 62,328,800,000 12,405,972,1826.000% 1,277,815,135 76,668,908South Dakota0.32% 14,665,600,000 2,919,052,2784.500% 300,662,385 13,529,807Tennessee2.10% 96,243,000,000 19,156,280,5767.000% 1,973,096,899 138,116,783Texas7.49% 343,266,700,000 68,324,067,3866.250% 7,037,378,941 439,836,184Utah0.84% 38,497,200,000 7,662,512,2304.850% 789,238,760 38,278,080Vermont0.25% 11,457,500,000 2,280,509,5926.000% 234,892,488 14,093,549Virginia2.63% 120,532,900,000 23,990,960,9114.524% 2,471,068,974 111,791,160Washington2.26% 103,575,800,000 20,615,806,7156.500% 2,123,428,092 138,022,826West Virginia0.54% 24,748,200,000 4,925,900,7196.000% 507,367,774 30,442,066Wisconsin1.80% 82,494,000,000 16,419,669,0655.000% 1,691,225,914 84,561,296Wyoming0.21% 9,624,300,000 1,915,628,0584.000% 197,309,690TotalSource: Appriss Retail and National Retail Federation 2021 Returns Survey. Oct-Nov 2021.(1) Source: U.S. Census(2) Source: Federation of Tax Administrators (www.taxadmin.org)6Consumer Returns in the Retail Industry 2021 7,892,388 5,161,702,949
Additional InformationReturn Costs A return is a lost sale. Cash, profits, and margin percentage are reduced. Returns increase labor costs due to inspection and re-stocking time. Returns cause markdowns, out-of-stocks, and logistics expenses to increase. Returns cannot always be resold.Return Fraud ImpactsRetailers must offset the negative business impact of return fraud by increasing prices to consumers and by reducing costs.2M LOST RETAIL JOBSAt an average retail salary of 35,800per year (U.S. Bureau of Labor Statistics,Retail Trade sector, October 2021), returnfraud is costing American workers theequivalent of 2,188,861 jobs. 5B LOST STATE TAXESThere are significant retail revenuelosses caused by return fraud – salesthat should not be refunded –therefore, US states are losing 5.161billion in sales tax revenues. 1.6B LOST LOCAL TAXESIt is estimated another 1.644 billionof sales tax revenues are lost atthe local level in the US due toreturn fraud.Survey Demographics Conducted by NRF between October 13, 2021 and November 15, 2021. Responses from 57 retailers. Efforts to include as many retailers as possible, across all segments and sizes.How many retail stores does your company operate?Which of the following best describes your level atyour organization?ResponseAverageResponseLess than 1023.08%C-Suite10 – 255.13%26 – 5051 – 100More than 100Consumer Returns in the Retail Industry 1.03%Other12.82%56.41%Source: Appriss Retail and National Retail Federation 2021 Returns Survey Oct-Nov 20217Average
Returns SummaryReturn Rate by Retail CategoryRetail CategoryReturn Rate by Payment TypeBlended Return Rate (1)Original Payment TypeBlended Return Rate (1)Apparel12.2%Cash12.69%Auto Parts19.4%Credit Card22.78%Beauty4.3%Debit7.04%Department .1%Hard Goods3.8%Home Improvement11.5%Housewares11.5%Sporting GoodsSurvey Average (2) (3)(1) Payment type rates derived from a 2019 Appriss Retail analysis of 40,000stores in the specialty and general merchandise retail segments. Appriss Retailreviews data direct from anonymous ecommerce and POS T-Logs—so all returns,exchanges, on-line returns, employee sale returns, and other refund scenarios areconsidered to build a blended return rate.7.6%10.6%(1) Retail category rates derived from a 2020 Appriss Retail analysis of 44,000 stores in the specialtyand general merchandise retail segments. Appriss Retail reviews data direct from anonymousecommerce and POS T-Logs—so all returns, exchanges, online returns, employee sale returns, andother refund scenarios are considered to build a blended return rate.(2) Survey average is derived from a survey of retailers by Appriss Retail and NRF, Oct - Nov 2021.(3) The survey average return rate is different than the blended return rate in several of the retailcategories because it includes retailers outside of these select categories, like grocery stores.Returns, BORIS, and Total LossIn the competitive world of retail, it is essential to understand how returns and return fraud reduce net sales and contribute toinventory shortage (shrink) and total loss. This information can be used by loss prevention professionals to compare their ownprogram results, with an eye toward developing best practices and reducing losses from returns.Additionally, the increase in buy-online-return-in-store (BORIS) returns is driving new demands—such as offering “frictionless”returns. The ability to offer more flexible and lenient returns, while still mitigating the risk of fraud and abuse, is more criticalthan ever.Engage Your Customers at the Return DeskYour best shoppers make the most returns. Returns are a chance to increase interaction with that consumer, provide themwith a great experience, and engender their loyalty for future shopping trips. Although accounting-wise a return is a lostsale, from a service perspective a return is a “moment of truth” that can be planned for and maximized.Americas 1 949 262 5100Europe/Middle East/Africa 44 (0)20 7430 0715Asia/Pacific 1 949 262 5100 January 2022 Appriss Retail. All rights reserved. Proprietary and confidential. apprissretail.com/legaltextapprissretail.comAR3021
Consumer Returns in the Retail Industry 2021 Metric Average Retail Industry NRF 2021 US retail industry sales (1) (in-store and online) 100% 0005 83, 4, 000, 000, Total amount of returns 16.6% 607 000,778, 000, Non-receipted returns 15.6% 06306881,8, 0, 1 1 Receipted return fraud (2) 9.8% 8986 91, 681 , 63, Merchandise Returns Source: Appriss .