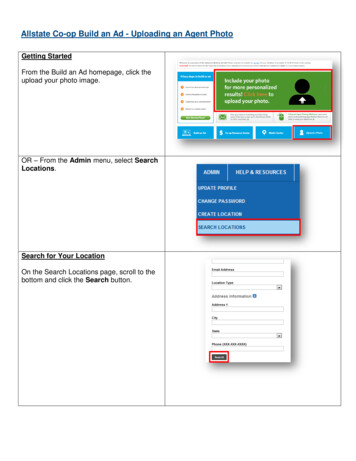
Transcription
Photo: Greg Linhares, City of OaklandCity of2015 Greenhouse Gas Emissions Inventory ReportMarch 2018
Table of ContentsIntroduction . 3Oakland, California . 3Why We Report . 3Inventory Methodology. 4Core Emissions. 5Consumption Emissions . 5GHG Emissions Reporting . 5GHG Reduction Goals . 6Co-Benefits: Enhancing Equity through GHG Reduction. 6Core Emissions Summary . 7Consumption Emissions Summary. 8Per Capita Emissions Comparison to Other Cities .10Emissions Relative to Economic Growth .10Conclusions .11Appendix A: GHG Emissions Data and Methodology .12Appendix B: Materials Use and Waste .25Appendix C: Local Government Emissions Data and Reductions .37
List of FiguresFigure 1: Oakland GHG Reduction Goals .6Figure 2: Core Emissions .7Figure 3: Core Emissions by Sector .7Figure 4: Consumption Emissions .8Figure 5: Consumption Emissions by Sector .8Figure 6: Core and Consumption Emissions by Category .9Figure 7: Core and Consumption Emissions Progress toward 2020 Goal .9Figure 8: Per Capita Emissions of Selected U.S. Cities . 10Figure 9: Emissions Reductions with Economic and Population Growth . 10Credit and AcknowledgmentsThis report was prepared by the Environmental Services Division of Oakland Public Works. The primaryauthors of the report are Daniel Hamilton, Sustainability Program Manager, Mukta Kelkar, ClimateCorps Fellow, and Ben Linthicum, CivicSpark Fellow. For inquiries, please contact Mr. Hamilton atDHamilton2@oaklandnet.comOrganization Which Provided Data or Assistance:California Air Resources BoardCounty of AlamedaAlameda-Contra Costa TransitAmtrakArgonne National LaboratoryBay Area Rapid TransitCalRecycleCarnegie MellonCity of OaklandEast Bay Municipal Utility DistrictFederal Transit AdministrationICLEI – Local Governments for Sustainability USAMetropolitan Transportation CommissionPacific Gas and ElectricPort of OaklandRenewable & Appropriate Energy Laboratory, UC BerkeleyStopWasteUnion Pacific RailroadU.S. Department of TransportationU. S. Environmental Protection AgencyWater Emergency Transportation AuthorityCity of Oakland 2018 Greenhouse Gas Emissions Inventory Report (2015 Data Year)2
IntroductionOakland, CaliforniaNationally recognized as one of America’s greenest cities, Oakland aims its award-winning sustainabilityefforts toward building an ecologically sustainable, economically dynamic, and socially equitable futurefor the community. With 19 miles of shoreline, Oakland is vulnerable to volatile weather patterns,warming oceans, and changing tides; conditions making the city among the most threatened by impactsfrom climate change. The City’s greenhouse gas (GHG) emissions reduction strategies, intended toaddress the ongoing impacts of a warming climate, are established in the Oakland Energy and ClimateAction Plan (ECAP) that was adopted by Oakland City Council in 2012.This GHG Emissions Inventory Report (Report) provides an update on the calculated emissions occurringin Oakland. It includes updates to the City’s three previous GHG Emissions Inventories, covering the years2005, 2010, 2013, and a new calculation of 2015 emissions. Additionally, this Report includes new GHGEmissions Inventories for each of the three subject years (2005, 2010, 2013, and 2015) to calculateconsumption emissions. The differences between the standard core emissions and the new consumptionemissions are described in the Report in detail.Why We ReportThe City calculates and reports its greenhouse gas emissions because addressing the impacts of climatechange is a core value of Oakland and its people. This Report provides an overview of Oakland’s path toemissions reduction and helps guide policy to better protect and provide for our community. By makinga targeted and coordinated approach to reducing emissions, we can work to protect residents,businesses, and properties throughout the region from increased impacts of climate change over time.The City has adopted strong emissions reduction goals of 36 percent fewer emissions by 2020 and 83percent fewer emissions by 2050, relative to a 2005 baseline. The periodic calculation and reporting of3City of Oakland 2018 Greenhouse Gas Emissions Inventory Report (2015 Data Year)
these emissions helps the City to understand whether it is on track to meet its goals, and helps thecommunity understand how well Oakland is responding to this global challenge.Because climate change disproportionately affects low income residents and people of color in Oakland,our City’s sustainability efforts prioritize projects and programs that improve equity while alsoaddressing climate change. Issues such as housing affordability, access to public transit, air quality andcommunity health, and climate justice are all affected by the City’s approach to meeting its GHGemissions goals. By prioritizing strategies to focus on these co-benefits of GHG reduction, the Cityensures that its GHG reduction efforts are also part of our approach to meeting broader communityneeds.Inventory MethodologiesThere are two methods of analyzing GHG emissions across a community. The first method, called a coreemissions approach, looks at direct emissions from a geographical perspective, for example, gasses thatare emitted within city limits. Select indirect emissions may be included, such as the emissions fromcreation of electricity in a distant location for use within city limits. The core emissions approach is thestandard used by cities in the United States, and this Report includes core emissions accordingly.The second method, referred to as a consumption emissions approach, employs a lifecycle perspectivethat includes, for example, gasses that are emitted globally due to demand for goods and servicesgenerated within city limits. The consumption emissions approach provides a more thorough portrayalof the emissions for which the community is responsible, and holds the potential to inspire deeperemissions reductions. For these reasons, the City also conducts a consumption-based analysis.Each approach offers a different lens through which to see what emissions Oakland is responsible for,and provides a method of determining which areas of focus are most appropriate in establishing policiesto minimize these emissions. Since climate change is a global issue that requires solutions on a globalscale, Oakland prioritizes the findings of the consumption emissions approach. As a city, Oakland seeksto have a global impact by affecting not only those emissions resulting from our local activities, but alsoto understand and address how activities within Oakland create emissions around the world.City of Oakland 2018 Greenhouse Gas Emissions Inventory Report (2015 Data Year)4
Core EmissionsCore emissions are GHGs emitted within city limits,such as those that result from using natural gas inhomes or driving gasoline-powered cars.Measurement of core emissions is the typicalmethod used by cities to measure GHG emissions,making comparisons from city to city easy.Consumption EmissionsConsumption emissions are GHGs emitted due tocommunity demand, including those used inproduction, transportation, and eventual disposalof goods and services. Measurement ofconsumption emissions is a relatively new method,and will continue to evolve as better data becomeavailable and more local governments refine andimprove the approach.CORE VS. CONSUMPTION EMISSIONSThese are the two scales of GHG emissions that maybe calculated in a city. For example, when driving acar:Core emissions are the carbon dioxide (CO2) andnitrogen oxide (NOx) that are emitted from vehicleswhile driving within city limits.Consumption emissions include the core tailpipeemissions described above, plus emissions from theextraction, refinement, and distribution of the fuel.This Report provides a summary and details of core emissions in Oakland to maintain consistency withinternational protocols and comparability to similar cities. However, the bulk of the analysis is focusedon presentation of consumption emissions. This approach offers the greatest potential to impact GHGemissions at a global scale, and to ensure that the City and the community have the best and mostapplicable information on the full impacts of decisions and behaviors.GHG Emissions ReportingIn recent years, local and regional governments across the world have been working to unify theapproach to reducing GHG emissions. The City of Oakland has signed onto several of these efforts aspart of its commitment, including the following: 5Compact of Mayors - Launched at the 2014 United Nations Climate Summit, the Compact ofMayors is the world’s largest coalition of city leaders addressing climate change by pledging toreduce their greenhouse gas emissions, tracking their progress and preparing for the impacts ofclimate change. Beginning with the City’s joining the Compact in 2015, this agreement requiresthe City of Oakland to inventory and report GHG emissions at least every three years, discloseclimate vulnerabilities within two years, and disclose climate hazards within one year .Under 2 Memorandum of Understanding (Under 2 MOU) - This agreement was signed by MayorLibby Schaaf in Paris at the U.N. Climate Change Conference of Parties, on December 6, 2015.Each signatory commits to limit emissions to 80 to 95 percent below 1990 levels, or below twometric tons per capita, by 2050, which is the level of emission reduction believed necessary tolimit global warming to less than 2 C by the end of this century.Mayor’s National Climate Action Agenda – This U.S.-based coalition of leading cities addressingclimate change through policy and advocacy was started in 2015, and serves as a platform forfurthering GHG reduction policies at the local and national levels.City of Oakland 2018 Greenhouse Gas Emissions Inventory Report (2015 Data Year)
GHG Reduction GoalsIn 2009, the Oakland City Council adopted GHG reduction goals of 36 percent fewer emissions by 2020and 83 percent fewer emissions by 2050. In pursuit of these goals, and in consistence with agreements,such as the Compact of Mayors and the Under 2 MOU, Oakland has committed to report on city-wideemissions every two years and strategize for meeting the 2020 and 2050 goals. Figure 1 illustrates thesegoals in GHG emissions.Core EmissionsFigure 1: OaklandGHG Reduction GoalsMillion Metric Tons CO2e3.52005 Baseline32020 Goal: 36%Reduction2.521.52050 Goal: 0452050Co-Benefits: Enhancing Equity through GHG ReductionThe City of Oakland strives to make a more livable and equitable city for all. In pursuing reductions ofGHG emissions, the City has adopted a strategy of focusing on the emissions that not only contribute toclimate change, but also create or exacerbate health, equity, and safety impacts for low income residentsand communities of color. Examples of social benefits to be gained from GHG emissions reductionprograms in Oakland include the following: Improved health outcomes, as indicated by measured rates of asthma and life expectancy, fromair quality improvements in neighborhoods adjacent to freeways, industry, and the Port ofOakland Enhanced flood protection for low-lying neighborhoods resulting from lower runoff in the hillareas and reduced sea level rise Greater access to fresh and healthy foods to promote farmers markets, increase urban farmingcapacity, and better coordination among food providers Improved educational outcomes and experiences through collaboration with schools on waterreduction, urban sustainability, and urban food growing efforts Lower utility bills and increased home comfort from energy efficiency retrofits of homes andapartmentsIn assessing new opportunities for programs and policies, the City actively considers these and other cobenefits to ensure that the approach to reducing emissions will also help address the health and equityof the community. While this Report is focused on GHG emissions rather than the co-benefits describedabove, additional discussion and details on social and climate justice considerations can be found in theOakland ECAP.City of Oakland 2018 Greenhouse Gas Emissions Inventory Report (2015 Data Year)6
Core Emissions SummaryFigure 2: Core EmissionsCore emissions are GHGs emitted within city limits,such as those resulting from use natural gas inhomes or gasoline in cars. This is the typical methodcities use, making comparisons from city to city easy.In 2015, core emissions equaled 2,497,088 metrictons of carbon dioxide equivalent (MT CO2e). Asshown in Figure 2, 56.6 percent of core emissionswere generated in the transportation and land usesectors of the community, including both vehicleemissions and stationary emitters such as thewastewater treatment plant. 33.4 percent ofemissions came from buildings and energy use,including electricity and natural gas use in homes,businesses, and other buildings. 2.6 percent camefrom material consumption and waste, specificallyfrom emissions associated with breakdown ofbiological landfill contributions from Oakland homesand businesses. Finally, 6.1 percent came from thePort of Oakland and just 1.3 percent from Citygovernment activities.Figure 3: Core Emissions by SectorCore Emissions by e100000019%80000060000040000020000060%22%21%LOCAL GOVERNMENTOPERATIONS1%MATERIALS USE &WASTE3%PORT (AIR & SEA)6%BUILDINGS & ENERGYUSE33%TRANSPORTATION &LAND USE57%Total Emitted: 2,497,088 MT CO2eOverall, core emissions are down in all activitiescompared to 2005. Figure 3 provides details onthe changes in core emissions since 2005,highlighting the areas in which emissionsreductions have been achieved. It includesemissions associated with activities such astransportation, building energy and water use,solid waste, operating the sea and air ports, andoperating the local government. The largestpercentage reductions come from solid waste (22percent reduction), maritime and airportoperation (60 percent reduction), and localgovernment operations (21 percent reduction).Overall, core emissions are 16.4% lower in 2015than in 2005.0BUILDINGS &ENERGY USETRANSPORTATION PORT (AIR & SEA)LOCAL& LAND USEGOVERNMENTCore Emissions by Sector OPERATIONSMATERIALS USE 00000City of Oakland 2018 Greenhouse Gas Emissions Inventory Report (2015 Data Year)
Consumption Emissions SummaryFigure 4:Consumption emissions are lifecycle GHGs emitteddue to activities occurring within city limits, such asthose required to produce, ship, and dispose ofgoods. In 2015, Oakland’s consumption emissionsequaled 7,482,738 metric tons of carbon dioxideequivalent (MT CO2e). This is more than double thecore emissions shown on the previous page. Asshown in Figure 4, 24 percent of these emissionswere generated in the transportation and land usesectors of the community, compared to 56.6percent in the core emissions analysis. 15.8 percentof emissions came from buildings and energy use,compared to 33.4 percent in the core analysis.Material consumption and waste emissionschanged the most dramatically, increasing from 2.6percent in the core analysis to 45 percent in theconsumption analysis. This is due to the inclusion ofemissionsassociatedwithmanufacturing,processing, packaging, and shipping of productsconsumed by those living and working in Oakland.Consumption EmissionsTotal Emitted: 7,482,738 MT CO2eFigure 5: Consumption Emissions by SectorConsumption Emissions by 00022%0BUILDINGS &ENERGY USETRANSPORTATION & PORT (AIR & SEA)LAND USEConsumption Emissions by S USE &WASTEThe change in emissions associated with eachsector is illustrated in Figure 5. This chartillustrates the changes in emissions associatedwith the same activities outlined in the corebreakdown, but from a consumption perspective.Overall, consumption emissions are down in allactivities except transportation and land useemissions, which are half a percent higher than in2005. While population increases throughout theBay area, there has been a correspondingincreased number of vehicle miles traveled onOakland’s roads. Population growth is a knowndriver of increased emissions. The largestpercentage reductions come from material useand waste, sea and air port operation, andbuilding and energy Cityof Oakland 2018 Greenhouse Gas Emissions Inventory Report (2015 Data Year)200000015000008
Consumption emissions are higher than core emissions due to the addition of upstream emissions, whichinclude all aspects of extracting raw materials, and manufacturing and shipping products to thecommunity. In this analysis, the full impact of materials consumption and waste in Oakland’s emissionsprofile becomes apparent. It can be inferred from this the significant effect that a reduction inconsumption, and particularly in the number of goods manufactured overseas and consumed in Oakland,would have on lowering GHG emissions.Figure 6: Core and ConsumptionEmissions by CategoryAs shown in Figure 6, there is significant differencein upstream emissions across these categories.Solid waste emissions, as described on the previouspage, represent the largest difference between coreand consumption emissions. However, differencesare present in the port/airport, transportation/landuse, and buildings/energy use categories as well.Local government operations do not have asignificant difference between core andconsumption emissions, and are approximately onepercent of total emissions.Chart Title4000000Core EmissionsUpstream Emissions3500000Consumption Core Upstream3000000Metric Tons CO2e250000020000001500000Both emissions summaries illustrate that the Cityhas made substantial progress in reducing overallemissions, but additional progress is needed. Figure7 illustrates the progress made in meeting theemissions reduction goal from both the core andconsumption approaches.10000005000000BUILDINGS &ENERGY USETRANSPORTATION PORT (AIR & SEA)& LAND USELOCALMATERIALS USE &GOVERNMENTWASTEOPERATIONSFigure 7: Core and Consumption Emissions Progress toward 2020 GoalCore EmissionsConsumption Emissions3.3987654Actual EmissionsGoal Emissions3.1Million Metric Tons CO2eMillion Metric Tons CO2e102.9Actual EmissionsGoal Emissions2.72.52.32.11.91.71.5Core emissions are not on track to meet the 2020 goal, though they have been reduced more thansixteen percent since 2005. To meet this goal, Oakland must further reduce emissions by 585,000 MT9City of Oakland 2018 Greenhouse Gas Emissions Inventory Report (2015 Data Year)
CO2e by 2020. Consumption emissions are also not on track to meet the 2020 goal, but have beenreduced more than 16 percent since 2005, due largely to the City’s work in reducing waste-relatedemissions. To meet the 2020 goal from a consumption standpoint, Oakland must reduce emissions by1,782,000 MT CO2e by 2020.Per Capita Emissions Comparison to Other CitiesAnother method of understanding GHG emissions is by comparison of per capita emissions, showingthe rate of emissions per person in the community. This type of comparison allows cities of differentsizes to compare emissions, while also ensuring that emissions are counted using a consistentmethodology. As shown in Figure 8, 2015 per capita core emissions for the City of Oakland are very lowby national standards, averaging 5.90MT CO2e, 46 percent lower than the California average and 71percent lower than the national average.Figure 8: Per Capita Emissions of the U.S., California, and Selected CitiesEmissions Relative to Economic GrowthThe rate of emissions is also trending downward during a time of overall economic growth. Betweenthe baseline year of 2005 and the inventory year of 2015, the population of the city grew by 5.8percent. While no specific Oakland economic activity numbers are available, the Gross RegionalProduct, a composite figure representing overall economic activity in the Bay Area, also increased by43 percent over the same time frame. This indicates that the community is finding ways to reduce itsemissions even as more people live and work in Oakland. Figure 9 illustrates the reduction in emissionsrelative to economic and population growth.City of Oakland 2018 Greenhouse Gas Emissions Inventory Report (2015 Data Year)10
Figure 9: Emissions Reductions with Economic and Population GrowthConclusionsOakland has made substantial progress in reducing GHG emissions across the city. While much workremains to be done to meet the City’s 2020 goal, the City has set in place a wide variety of programs,policies, and efforts that have proven successful in lowering its carbon footprint. In its ongoingimplementation of the ECAP, the City will continue this progress and capitalize on the opportunitiespresented to lower emissions, while continuing to grow and prosper. The ability of City government towork with residents, businesses, coalitions, and community advocates will increase the likelihood thatthe City’s ambitious goals are met.Consistent with the Compact of Mayors and the Under 2 MOU, the City of Oakland is committed toreporting on its GHG emissions every two years, using protocols agreed to by the internationalcommunity and consistent with the best practices in the industry. The City’s ongoing focus on equity asa priority in targeting emissions reductions strategies will serve to further strengthen the community,while addressing its environmental priorities, and ensure that the resources invested in fighting climatechange also help support climate justice.With the progress identified in this GHG Emissions Inventory Report, the City of Oakland is wellpositioned to pursue its targets and continue to report its progress to the community in a timely manner.11City of Oakland 2018 Greenhouse Gas Emissions Inventory Report (2015 Data Year)
Appendix AGHG Emissions Data and MethodologyTable of ContentsEmissions Data and Methodology Overview .13Reporting Protocol .13Demographics of Oakland .14Data Sources .15Core Inventories .16Consumption Inventories.20List of TablesTable 1: Demographics .14Table 2: Sources by Activity .15Table 3: 2005 Core Inventory – Community and Local Government .16Table 4: 2010 Core Inventory – Community and Local Government .17Table 5: 2013 Core Inventory – Community and Local Government .18Table 6: 2015 Core Inventory – Community and Local Government 19Table 7: 2005 Consumption Inventory – Community .20Table 8: 2005 Consumption Inventory – Local Government Operations .21Table 9: 2010 Consumption Inventory – Community .22Table 10: 2010 Consumption Inventory – Local Government Operations .23Table 11: 2013 Consumption Inventory – Community.24Table 12: 2013 Consumption Inventory – Local Government Operations .25Table 13: 2015 Consumption Inventory – Community .26Table 14: 2015 Consumption Inventory – Local Government Operations 27
Emissions Data and Methodology OverviewThe updates to the 2005, 2010, and 2013 GHG Emissions Inventories, and the newly created 2015Inventory, were conducted following a review of similar inventories in U.S. cities, discussions andguidance from ICLEI Local Governments for Sustainability, and in coordination with a wide range of localand regional partners who maintain data necessary to complete a comprehensive analysis. This appendixsets forth the details regarding how each of the inventories were completed, the sources and details ofthe data used, and the demographic information used in completing the analysis.Following the presentation of demographics and data sources used in the inventories, tables areprovided showing the raw data, emissions in each of the major categories, and total carbon dioxideequivalent (CO2e) emissions for each activity type. These files are summaries of a broader range ofinputs associated with the emissions model used. For more information on the model files, pleasecontact the Environmental Services Division of Oakland Public Works.Reporting ProtocolThe City of Oakland used ICLEI U.S. Community Protocol for Accounting and Reporting Greenhouse GasEmissions Version 1.1 as the overarching inventory methodology. ICLEI’s ClearPath tool was used formany calculations and as a database. When applicable, updates were made per instruction from sourcesused within ICLEI protocol. The City has committed to measuring progress on a regular basis throughvarious programs including the Compact of Mayors, Under 2 MOU, and the Mayor’s National ClimateAction Agenda. Per these requirements, the Core Inventory was also analyzed using the Global Protocolfor Community-Scale Emissions (GPC). Both versions have been published and shared through theCompact of Mayors and Carbonn.13City of Oakland 2018 Greenhouse Gas Emissions Inventory Report (2015 Data Year)
Demographics of OaklandTable 1: Demographics2000 Census#PopulationPopulationRace & EthnicityWhite AloneBlack or African American AloneAmerican Indian or Alaska Native AloneAsian AloneNative Hawaiian and Other PacificIslander AloneTwo or More RacesHispanic or Latino (of any race)HousingHousing UnitsHouseholdsPersons per Household% of Total397,9312010 Census#% of Total390,7242013 ACS Estimates 2015 ACS Estimates % Increase#% of Total#% of Total from ,7902.52169,710155,9182.47170,9772.52City of Oakland 2018 Greenhouse Gas Emissions Inventory Report (2015 Data Year)169,213161,1042.567%7%2%14
Data SourcesTable 2: Sources by ActivityActivityResidential EnergyCommercial EnergyIndustrial EnergyWater and WastewaterState Highway GasolineState Highway DieselOn-Road GasolineOn-Road DieselAirport & Sea PortPublic TransitSolid WasteCore SourcesBuildings and Energy UsePacific Gas & ElectricPacific Gas & ElectricUnable to I
Action Plan (ECAP) that was adopted by Oakland City Council in 2012. This GHG Emissions Inventory Report (Report) provides an update on the calculated emissions occurring in Oakland. It includes updates to the City's three previous GHG Emissions Inventories, covering the years 2005, 2010, 2013, and a new calculation of 2015 emissions.