Transcription
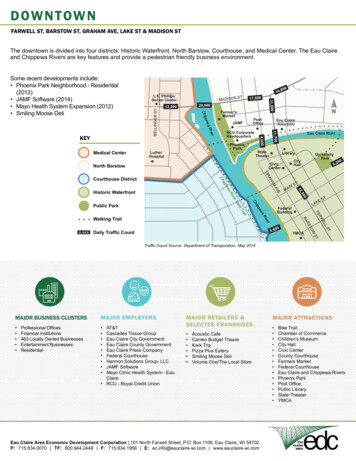
DOW NTOW NFARWELL ST, BARSTOW ST, GRAHAM AVE, LAKE ST & MADISON STThe downtown is divided into four districts: Historic Waterfront, North Barstow, Courthouse, and Medical Center. The Eau Claireand Chippewa Rivers are key features and provide a pedestrian friendly business nixParkLutherHospitalEau Claire River11,700RCU CorporateHeadquartersEau ClaireArea EDC4,600BELLINGER STST11,80012,200riveMedical CenterMADISON16,20,000RwappeKEY800L.E. PhillipsSenior CenterChiSome recent developments include: Phoenix Park Neighborhood - Residential(2013) JAMF Software (2014) Mayo Health System Expansion (2012) Smiling Moose DeliStateTheaterLibraryCivicCenterNorth BarstowAAHGRChCourthouse District0STYMCASTWTORSBAriveaR009,6Daily Traffic CountSTKELALELRWFAFederalBuildingewilTraWalking TrailX,XXX,90ippChetatPublic ParkSTINMA006,312rSveRiEAVaewMippHistoric WaterfrontUniversityParkCityHallTraffic Count Source: Department of Transporation, May 2014MAJOR BUSINESS CLUSTERSMAJOR EMPLOYERS Professional OfficesFinancial Institutions463 Locally Owned BusinessesEntertainment BusinessesResidentialAT&TCascades Tissue GroupEau Claire City GovernmentEau Claire County GovernmentEau Claire Press CompanyFederal CourthouseHarmon Solutions Group, LLCJAMF SoftwareMayo Clinic Health System - EauClaire RCU - Royal Credit UnionMAJOR RETAILERS &SELECTED FRANCHISES Acoustic CafeCameo Budget TheareKwik TripPizza Plus EaterySmiling Moose DeliVolume One/The Local StoreEau Claire Area Economic Development Corporation 101 North Farwell Street, P.O. Box 1108, Eau Claire, WI 54702P: 715.834.0070 TF: 800.944.2449 F: 715.834.1956 E: ec.info@eauclaire-wi.com www.eauclaire-wi.comMAJOR ATTRACTIONS Bike TrailChamber of CommerceChildren’s MuseumCity HallCivic CenterCounty CourthouseFarmers MarketFederal CourthouseEau Claire and Chippewa RiversPhoenix ParkPost OfficePublic LibraryState TheaterYMCA
2010 Census Profile203 S Farwell St, Eau Claire, Wisconsin, 54701 2203 S Farwell St, Eau Claire, Wisconsin, 54701Ring: 1 mile radiusLatitude: 44.81197Longitude: -91.498882000-2010201013,7855,7426,090Annual %0.6%2.1%2802.0%Population by SexMaleFemale6,9346,85150.3%49.7%Population by AgeTotalAge 0 - 4Age 5 - 9Age 10 - 14Age 15 - 19Age 20 - 24Age 25 - 29Age 30 - 34Age 35 - 39Age 40 - 44Age 45 - 49Age 50 - 54Age 55 - 59Age 60 - 64Age 65 - 69Age 70 - 74Age 75 - 79Age 80 - 84Age 85 91,02286.0%7.4%PopulationHouseholdsHousing Units200014,3285,8446,172Population by RaceTotalPopulation Reporting One RaceWhiteBlackAmerican IndianAsianPacific IslanderSome Other RacePopulation Reporting Two or More RacesTotal Hispanic PopulationAge 18 Age 65 Median Age by Sex and Race/Hispanic OriginTotal PopulationMaleFemaleWhite AloneBlack AloneAmerican Indian AloneAsian AlonePacific Islander AloneSome Other Race AloneTwo or More RacesHispanic PopulationData Note: Hispanic population can be of any race. Census 2010 medians are computed from reported data distributions.Source: U.S. Census Bureau, Census 2010 Summary File 1. Esri converted Census 2000 data into 2010 21.5August 20, 2014 2014 EsriPage 1 of 12
2010 Census Profile203 S Farwell St, Eau Claire, Wisconsin, 54701 2203 S Farwell St, Eau Claire, Wisconsin, 54701Ring: 1 mile radiusHouseholds by TypeTotalHouseholds with 1 PersonHouseholds with 2 PeopleFamily HouseholdsHusband-wife FamiliesWith Own ChildrenOther Family (No Spouse Present)With Own ChildrenNonfamily HouseholdsAll Households with ChildrenMultigenerational HouseholdsUnmarried Partner HouseholdsMale-femaleSame-sexAverage Household SizeLatitude: 44.81197Longitude: 5133216.9%1.3%9.5%8.9%0.6%2.25Family Households by SizeTotal1,958100.0%2 People91846.9%3 People46723.9%4 People33116.9%5 People1336.8%6 People552.8%542.8%7 PeopleAverage Family SizeNonfamily Households by SizeTotal1 Person2 People3 People4 People5 People6 People7 PeopleAverage Nonfamily SizePopulation by Relationship and Household TypeTotalIn HouseholdsIn Family HouseholdsHouseholderSpouseChildOther relativeNonrelativeIn Nonfamily HouseholdsIn Group QuartersInstitutionalized PopulationNoninstitutionalized .2%9.2%16.2%1.8%2.1%50.2%6.4%3.2%3.2%Data Note: Households with children include any households with people under age 18, related or not. Multigenerational households are families with 3 or moreparent-child relationships. Unmarried partner households are usually classified as nonfamily households unless there is another member of the household related tothe householder. Multigenerational and unmarried partner households are reported only to the tract level. Esri estimated block group data, which is used to estimatepolygons or non-standard geography. Average family size excludes nonrelatives.Source: U.S. Census Bureau, Census 2010 Summary File 1.August 20, 2014 2014 EsriPage 2 of 12
2010 Census Profile203 S Farwell St, Eau Claire, Wisconsin, 54701 2203 S Farwell St, Eau Claire, Wisconsin, 54701Ring: 1 mile radiusFamily Households by Age of HouseholderTotalHouseholder Age 15 - 44Latitude: 44.81197Longitude: ds by Race of HouseholderTotalHouseholder is White AloneHouseholder is Black AloneHouseholder is American Indian AloneHouseholder is Asian AloneHouseholder is Pacific Islander AloneHouseholder is Some Other Race AloneHouseholder is Two or More RacesHouseholds with Hispanic 0.6%2.2%0.1%0.5%1.4%1.4%Husband-wife Families by Race of derHouseholderHouseholderHouseholderAgeAgeAgeAge45 - 5455 - 6465 - 7475 Nonfamily Households by Age of ouseholderHouseholderAgeAgeAgeAgeAge15 45 55 65 75 44546474Householder is White AloneHouseholder is Black AloneHouseholder is American Indian AloneHouseholder is Asian AloneHouseholder is Pacific Islander AloneHouseholder is Some Other Race AloneHouseholder is Two or More RacesHusband-wife Families with Hispanic HouseholderOther Families (No Spouse) by Race of HouseholderTotalHouseholder is White AloneHouseholder is Black AloneHouseholder is American Indian AloneHouseholder is Asian AloneHouseholder is Pacific Islander AloneHouseholder is Some Other Race AloneHouseholder is Two or More RacesOther Families with Hispanic HouseholderNonfamily Households by Race of HouseholderTotalHouseholder is White AloneHouseholder is Black AloneHouseholder is American Indian AloneHouseholder is Asian AloneHouseholder is Pacific Islander AloneHouseholder is Some Other Race AloneHouseholder is Two or More RacesNonfamily Households with Hispanic Householder19.0%15.9%7.1%6.1%Source: U.S. Census Bureau, Census 2010 Summary File 1.August 20, 2014 2014 EsriPage 3 of 12
2010 Census Profile203 S Farwell St, Eau Claire, Wisconsin, 54701 2203 S Farwell St, Eau Claire, Wisconsin, 54701Ring: 1 mile radiusTotal Housing Units by OccupancyTotalOccupied Housing UnitsVacant Housing UnitsLatitude: 44.81197Longitude: .8%0.3%0.3%0.0%1255.7%2.1%Households by Tenure and Mortgage StatusTotalOwner OccupiedOwned with a Mortgage/LoanOwned Free and ClearAverage Household SizeRenter OccupiedAverage Household %9.1%Owner-occupied Housing Units by Race of HouseholderTotalHouseholder is White 4%0.7%2.2%0.1%0.5%1.8%1.6%For RentRented, not OccupiedFor Sale OnlySold, not OccupiedFor Seasonal/Recreational/Occasional UseFor Migrant WorkersOther VacantTotal Vacancy RateHouseholder is Black AloneHouseholder is American Indian AloneHouseholder is Asian AloneHouseholder is Pacific Islander AloneHouseholder is Some Other Race AloneHouseholder is Two or More RacesOwner-occupied Housing Units with Hispanic HouseholderRenter-occupied Housing Units by Race of HouseholderTotalHouseholder is White AloneHouseholder is Black AloneHouseholder is American Indian AloneHouseholder is Asian AloneHouseholder is Pacific Islander AloneHouseholder is Some Other Race AloneHouseholder is Two or More RacesRenter-occupied Housing Units with Hispanic HouseholderAverage Household Size by Race/Hispanic Origin of HouseholderHouseholder is White AloneHouseholder is Black AloneHouseholder is American Indian AloneHouseholder is Asian AloneHouseholder is Pacific Islander AloneHouseholder is Some Other Race AloneHouseholder is Two or More RacesHouseholder is e: U.S. Census Bureau, Census 2010 Summary File 1.August 20, 2014 2014 EsriPage 4 of 12
Household Income Profile203 S Farwell St, Eau Claire, Wisconsin, 54701 2203 S Farwell St, Eau Claire, Wisconsin, 54701Ring: 1 mile radiusSummaryPopulationHouseholdsMedian AgeAverage Household Size201414,0555,92824.72.22Latitude: 44.81197Longitude: 16725.22.212014Households by IncomeHouseholdBaseIncome 15,000 15,000- 24,999 25,000- 34,999 35,000- 49,999 50,000- 74,999 75,000- 99,999 100,000- 149,999 150,000- 199,999 200,000 Number5,9281,6721,2626748478023312584238Median Household IncomeAverage Household IncomePer Capita Income 25,323 36,338 15,8642014-2019Annual 9%13.0%7.6%6.3%1.2%0.8% 28,788 42,039 18,517Data Note: Income reported for July 1, 2019 represents annual income for the preceding year, expressed in current (2018) dollars, including an adjustment for inflation.Source: U.S. Census Bureau, Census 2010 Summary File 1. Esri Forecasts for 2014 and 2019.August 20, 2014 2014 EsriPage 1 of 9
Household Income Profile203 S Farwell St, Eau Claire, Wisconsin, 54701 2203 S Farwell St, Eau Claire, Wisconsin, 54701Ring: 1 mile radiusHH Income Base 251,8132014 Households by Income and Age of Householder25-3435-4445-5455-641,145734670769 15,000 15,000- 24,999 25,000- 34,999 35,000- 49,999 50,000- 74,999 75,000- 99,999 100,000- 149,999 150,000- 199,999 200,000 73045720021311845369522920915619819974561410Median HH IncomeAverage HH Income 17,705 25,427 33,238 42,260 %0.3%20.0%18.3%13.6%17.3%17.4%6.5%4.9%1.2%0.9%HH Income Base 15,000 15,000- 24,999 25,000- 34,999 35,000- 49,999 50,000- 74,999 75,000- 99,999 100,000- 149,999 150,000- 199,999 200,000 Latitude: 44.81197Longitude: -91.498881091249111615668566965-7444175 43231432132118402518121000 39,475 37,334 49,050 46,127Percent Distribution35-4445-54100%100% 27,069 39,271 26,067 34,352 17,511 24,42655-64100%65-74100%75 %0.6%Data Note: Income reported for July 1, 2019 represents annual income for the preceding year, expressed in current (2018) dollars, including an adjustment for inflation.Source: U.S. Census Bureau, Census 2010 Summary File 1. Esri Forecasts for 2014 and 2019.August 20, 2014 2014 EsriPage 2 of 9
Household Income Profile203 S Farwell St, Eau Claire, Wisconsin, 54701 2203 S Farwell St, Eau Claire, Wisconsin, 54701Ring: 1 mile radiusHH Income Base 251,7432019 Households by Income and Age of Householder25-3435-4445-5455-641,153807646816 15,000 15,000- 24,999 25,000- 34,999 35,000- 49,999 50,000- 74,999 75,000- 99,999 100,000- 149,999 150,000- 199,999 200,000 n HH IncomeAverage HH Income 18,182 28,840 36,031 47,980 %0.2%19.3%14.9%14.1%17.3%16.7%8.2%6.4%1.9%1.1%HH Income Base 15,000 15,000- 24,999 25,000- 34,999 35,000- 49,999 50,000- 74,999 75,000- 99,999 100,000- 149,999 150,000- 199,999 200,000 Latitude: 44.81197Longitude: -91.49888111114911211661018491065-7459275 135614531134159102483624191901 44,825 42,571 55,423 53,413Percent Distribution35-4445-54100%100% 32,394 45,209 33,492 42,826 18,197 29,73655-64100%65-74100%75 2.2%0.8%Data Note: Income reported for July 1, 2019 represents annual income for the preceding year, expressed in current (2018) dollars, including an adjustment for inflation.Source: U.S. Census Bureau, Census 2010 Summary File 1. Esri Forecasts for 2014 and 2019.August 20, 2014 2014 EsriPage 3 of 9
2010 Census Profile203 S Farwell St, Eau Claire, Wisconsin, 54701 2203 S Farwell St, Eau Claire, Wisconsin, 54701Ring: 3 mile radiusLatitude: 44.81197Longitude: -91.498882000-2010201059,53624,09925,227Annual .0%0.6%1.8%1,1812.0%Population by SexMaleFemale28,90230,63448.5%51.5%Population by AgeTotalAge 0 - 4Age 5 - 9Age 10 - 14Age 15 - 19Age 20 - 24Age 25 - 29Age 30 - 34Age 35 - 39Age 40 - 44Age 45 - 49Age 50 - 54Age 55 - 59Age 60 - 64Age 65 - 69Age 70 - 74Age 75 - 79Age 80 - 84Age 85 ulationHouseholdsHousing Units200058,08322,71723,468Population by RaceTotalPopulation Reporting One RaceWhiteBlackAmerican IndianAsianPacific IslanderSome Other RacePopulation Reporting Two or More RacesTotal Hispanic PopulationAge 18 Age 65 Median Age by Sex and Race/Hispanic OriginTotal PopulationMaleFemaleWhite AloneBlack AloneAmerican Indian AloneAsian AlonePacific Islander AloneSome Other Race AloneTwo or More RacesHispanic PopulationData Note: Hispanic population can be of any race. Census 2010 medians are computed from reported data distributions.Source: U.S. Census Bureau, Census 2010 Summary File 1. Esri converted Census 2000 data into 2010 21.7August 20, 2014 2014 EsriPage 5 of 12
2010 Census Profile203 S Farwell St, Eau Claire, Wisconsin, 54701 2203 S Farwell St, Eau Claire, Wisconsin, 54701Ring: 3 mile radiusHouseholds by TypeTotalHouseholds with 1 PersonHouseholds with 2 PeopleFamily HouseholdsHusband-wife FamiliesWith Own ChildrenOther Family (No Spouse Present)With Own ChildrenNonfamily HouseholdsAll Households with ChildrenMultigenerational HouseholdsUnmarried Partner HouseholdsMale-femaleSame-sexAverage Household SizeLatitude: 44.81197Longitude: mily Households by SizeTotal12,767100.0%2 People6,26449.1%3 People2,85122.3%4 People2,23717.5%5 People8907.0%6 People3192.5%7 People2061.6%Average Family Size2.86Nonfamily Households by SizeTotal1 Person2 People3 People4 People5 People6 People7 PeopleAverage Nonfamily SizePopulation by Relationship and Household TypeTotalIn HouseholdsIn Family HouseholdsHouseholderSpouseChildOther relativeNonrelativeIn Nonfamily HouseholdsIn Group QuartersInstitutionalized PopulationNoninstitutionalized ta Note: Households with children include any households with people under age 18, related or not. Multigenerational households are families with 3 or moreparent-child relationships. Unmarried partner households are usually classified as nonfamily households unless there is another member of the household related tothe householder. Multigenerational and unmarried partner households are reported only to the tract level. Esri estimated block group data, which is used to estimatepolygons or non-standard geography. Average family size excludes nonrelatives.Source: U.S. Census Bureau, Census 2010 Summary File 1.August 20, 2014 2014 EsriPage 6 of 12
2010 Census Profile203 S Farwell St, Eau Claire, Wisconsin, 54701 2203 S Farwell St, Eau Claire, Wisconsin, 54701Ring: 3 mile radiusFamily Households by Age of HouseholderTotalHouseholder Age 15 - geAgeAge45 - 5455 - 6465 - 7475 Nonfamily Households by Age of ouseholderHouseholderAgeAgeAgeAgeAge15 45 55 65 75 44546474Households by Race of HouseholderTotalHouseholder is White AloneHouseholder is Black AloneHouseholder is American Indian AloneHouseholder is Asian AloneHouseholder is Pacific Islander AloneHouseholder is Some Other Race AloneHouseholder is Two or More RacesHouseholds with Hispanic HouseholderHusband-wife Families by Race of HouseholderTotalHouseholder is White AloneHouseholder is Black AloneHouseholder is American Indian AloneHouseholder is Asian AloneHouseholder is Pacific Islander AloneHouseholder is Some Other Race AloneHouseholder is Two or More RacesHusband-wife Families with Hispanic HouseholderOther Families (No Spouse) by Race of HouseholderTotalHouseholder is White AloneHouseholder is Black AloneHouseholder is American Indian AloneHouseholder is Asian AloneHouseholder is Pacific Islander AloneHouseholder is Some Other Race AloneHouseholder is Two or More RacesOther Families with Hispanic HouseholderNonfamily Households by Race of HouseholderTotalHouseholder is White AloneHouseholder is Black AloneHouseholder is American Indian AloneHouseholder is Asian AloneHouseholder is Pacific Islander AloneHouseholder is Some Other Race AloneHouseholder is Two or More RacesNonfamily Households with Hispanic HouseholderLatitude: 44.81197Longitude: .5%1.3%0.0%0.4%1.0%1.1%20.5%17.9%9.8%7.9%Source: U.S. Census Bureau, Census 2010 Summary File 1.August 20, 2014 2014 EsriPage 7 of 12
2010 Census Profile203 S Farwell St, Eau Claire, Wisconsin, 54701 2203 S Farwell St, Eau Claire, Wisconsin, 54701Ring: 3 mile radiusTotal Housing Units by OccupancyTotalOccupied Housing UnitsVacant Housing UnitsLatitude: 44.81197Longitude: 0.1%1.0%0.2%0.4%0.0%3114.5%1.2%Households by Tenure and Mortgage StatusTotalOwner OccupiedOwned with a Mortgage/LoanOwned Free and ClearAverage Household SizeRenter OccupiedAverage Household %39.0%17.0%Owner-occupied Housing Units by Race of HouseholderTotalHouseholder is White 421392.7%1.3%0.7%3.0%0.0%0.7%1.5%2.0%For RentRented, not OccupiedFor Sale OnlySold, not OccupiedFor Seasonal/Recreational/Occasional UseFor Migrant WorkersOther VacantTotal Vacancy RateHouseholder is Black AloneHouseholder is American Indian AloneHouseholder is Asian AloneHouseholder is Pacific Islander AloneHouseholder is Some Other Race AloneHouseholder is Two or More RacesOwner-occupied Housing Units with Hispanic HouseholderRenter-occupied Housing Units by Race of HouseholderTotalHouseholder is White AloneHouseholder is Black AloneHouseholder is American Indian AloneHouseholder is Asian AloneHouseholder is Pacific Islander AloneHouseholder is Some Other Race AloneHouseholder is Two or More RacesRenter-occupied Housing Units with Hispanic HouseholderAverage Household Size by Race/Hispanic Origin of HouseholderHouseholder is White AloneHouseholder is Black AloneHouseholder is American Indian AloneHouseholder is Asian AloneHouseholder is Pacific Islander AloneHouseholder is Some Other Race AloneHouseholder is Two or More RacesHouseholder is e: U.S. Census Bureau, Census 2010 Summary File 1.August 20, 2014 2014 EsriPage 8 of 12
Household Income Profile203 S Farwell St, Eau Claire, Wisconsin, 54701 2203 S Farwell St, Eau Claire, Wisconsin, 54701Ring: 3 mile radiusSummaryPopulationHouseholdsMedian AgeAverage Household Size201460,41324,73730.72.26Latitude: 44.81197Longitude: 25,60032.02.242014Households by IncomeHouseholdBaseIncome 15,000 15,000- 24,999 25,000- 34,999 35,000- 49,999 50,000- 74,999 75,000- 99,999 100,000- 149,999 150,000- 199,999 200,000 490Median Household IncomeAverage Household IncomePer Capita Income 40,354 54,568 22,8832014-2019Annual %12.3%10.2%13.4%16.3%13.2%12.3%3.3%2.8% 47,146 64,223 27,144Data Note: Income reported for July 1, 2019 represents annual income for the preceding year, expressed in current (2018) dollars, including an adjustment for inflation.Source: U.S. Census Bureau, Census 2010 Summary File 1. Esri Forecasts for 2014 and 2019.August 20, 2014 2014 EsriPage 4 of 9
Household Income Profile203 S Farwell St, Eau Claire, Wisconsin, 54701 2203 S Farwell St, Eau Claire, Wisconsin, 54701Ring: 3 mile radius2014 Households by Income and Age of 9HH Income Base 253,398 15,000 15,000- 24,999 25,000- 34,999 35,000- 49,999 50,000- 74,999 75,000- 99,999 100,000- 149,999 150,000- 199,999 200,000 Median HH IncomeAverage HH Income 19,353 28,537 41,195 53,040 %0.2%15.3%14.9%11.6%16.4%19.3%10.6%8.5%1.8%1.6%HH Income Base 15,000 15,000- 24,999 25,000- 34,999 35,000- 49,999 50,000- 74,999 75,000- 99,999 100,000- 149,999 150,000- 199,999 200,000 Latitude: 44.81197Longitude: -91.49888325388346474805501595778865-742,72575 282179 56,005 55,982 68,003 69,190Percent Distribution35-4445-54100%100% 51,947 65,570 42,764 55,506 25,307 33,94755-64100%65-74100%75 .2%3.5%3.0%Data Note: Income reported for July 1, 2019 represents annual income for the preceding year, expressed in current (2018) dollars, including an adjustment for inflation.Source: U.S. Census Bureau, Census 2010 Summary File 1. Esri Forecasts for 2014 and 2019.August 20, 2014 2014 EsriPage 5 of 9
Household Income Profile203 S Farwell St, Eau Claire, Wisconsin, 54701 2203 S Farwell St, Eau Claire, Wisconsin, 54701Ring: 3 mile radius2019 Households by Income and Age of 3HH Income Base 253,227 15,000 15,000- 24,999 25,000- 34,999 35,000- 49,999 50,000- 74,999 75,000- 99,999 100,000- 149,999 150,000- 199,999 200,000 100Median HH IncomeAverage HH Income 20,612 32,890 47,122 62,464 %0.2%14.4%11.6%10.9%15.4%17.4%13.5%11.1%3.5%2.2%HH Income Base 15,000 15,000- 24,999 25,000- 34,999 35,000- 49,999 50,000- 74,999 75,000- 99,999 100,000- 149,999 150,000- 199,999 200,000 Latitude: 44.81197Longitude: -91.4988832832632347078867681913511265-743,33475 1211454629 64,955 65,792 77,195 80,761Percent Distribution35-4445-54100%100% 58,965 77,581 50,268 67,125 28,029 41,11455-64100%65-74100%75 0%5.9%4.1%Data Note: Income reported for July 1, 2019 represents annual income for the preceding year, expressed in current (2018) dollars, including an adjustment for inflation.Source: U.S. Census Bureau, Census 2010 Summary File 1. Esri Forecasts for 2014 and 2019.August 20, 2014 2014 EsriPage 6 of 9
2010 Census Profile203 S Farwell St, Eau Claire, Wisconsin, 54701 2203 S Farwell St, Eau Claire, Wisconsin, 54701Ring: 10 mile radiusLatitude: 44.81197Longitude: -91.498882000-20102010106,82942,97345,361Annual %0.0%0.5%1.6%1,9321.8%Population by SexMaleFemale52,31154,51849.0%51.0%Population by AgeTotalAge 0 - 4Age 5 - 9Age 10 - 14Age 15 - 19Age 20 - 24Age 25 - 29Age 30 - 34Age 35 - 39Age 40 - 44Age 45 - 49Age 50 - 54Age 55 - 59Age 60 - 64Age 65 - 69Age 70 - 74Age 75 - 79Age 80 - 84Age 85 opulationHouseholdsHousing Units200099,25738,54939,969Population by RaceTotalPopulation Reporting One RaceWhiteBlackAmerican IndianAsianPacific IslanderSome Other RacePopulation Reporting Two or More RacesTotal Hispanic PopulationAge 18 Age 65 Median Age by Sex and Race/Hispanic OriginTotal PopulationMaleFemaleWhite AloneBlack AloneAmerican Indian AloneAsian AlonePacific Islander AloneSome Other Race AloneTwo or More RacesHispanic PopulationData Note: Hispanic population can be of any race. Census 2010 medians are computed from reported data distributions.Source: U.S. Census Bureau, Census 2010 Summary File 1. Esri converted Census 2000 data into 2010 21.7August 20, 2014 2014 EsriPage 9 of 12
2010 Census Profile203 S Farwell St, Eau Claire, Wisconsin, 54701 2203 S Farwell St, Eau Claire, Wisconsin, 54701Ring: 10 mile radiusHouseholds by TypeTotalHouseholds with 1 PersonHouseholds with 2 PeopleFamily HouseholdsHusband-wife FamiliesWith Own ChildrenOther Family (No Spouse Present)With Own ChildrenNonfamily HouseholdsAll Households with ChildrenMultigenerational HouseholdsUnmarried Partner HouseholdsMale-femaleSame-sexAverage Household SizeLatitude: 44.81197Longitude: 7Family Households by SizeTotal25,721100.0%2 People12,43448.3%3 People5,55621.6%4 People4,79618.6%5 People1,9027.4%6 People6542.5%7 People3791.5%Average Family Size2.92Nonfamily Households by SizeTotal1 Person2 People3 People4 People5 People6 People7 PeopleAverage Nonfamily SizePopulation by Relationship and Household TypeTotalIn HouseholdsIn Family HouseholdsHouseholderSpouseChildOther relativeNonrelativeIn Nonfamily HouseholdsIn Group QuartersInstitutionalized PopulationNoninstitutionalized 9%Data Note: Households with children include any households with people under age 18, related or not. Multigenerational households are families with 3 or moreparent-child relationships. Unmarried partner households are usually classified as nonfamily households unless there is another member of the household related tothe householder. Multigenerational and unmarried partner households are reported only to the tract level. Esri estimated block group data, which is used to estimatepolygons or non-standard geography. Average family size excludes nonrelatives.Source: U.S. Census Bureau, Census 2010 Summary File 1.August 20, 2014 2014 EsriPage 10 of 12
2010 Census Profile203 S Farwell St, Eau Claire, Wisconsin, 54701 2203 S Farwell St, Eau Claire, Wisconsin, 54701Ring: 10 mile radiusFamily Households by Age of HouseholderTotalHouseholder Age 15 - 44Latitude: 44.81197Longitude: 4.8%9.6%16.5%Households by Race of HouseholderTotalHouseholder is White AloneHouseholder is Black AloneHouseholder is American Indian AloneHouseholder is Asian AloneHouseholder is Pacific Islander AloneHouseholder is Some Other Race AloneHouseholder is Two or More RacesHouseholds with Hispanic .0%0.6%0.4%1.9%0.0%0.3%0.7%1.1%Husband-wife Families by Race of seholderAgeAgeAgeAge45 - 5455 - 6465 - 7475 Nonfamily Households by Ag
2010 Census Profile 203 S Farwell St, Eau Claire, Wisconsin, 54701 2 203 S Farwell St, Eau Claire, Wisconsin, 54701 Latitude: 44.81197 Ring: 1 mile radius Longitude: -91.49888