Transcription
2019ANNUALSTATISTICALREPORTNew Series, Volume 1Report of theGeneral Conference ofSeventh-day Adventists2018 StatisticsSeventh-dayAdventist Church
2019ANNUALSTATISTICALREPORTNew Series, Volume 1Report of theGeneral Conference ofSeventh-day Adventists2018 StatisticsSeventh-dayAdventist Church12501 Old Columbia Pike, Silver Spring, MD 20904
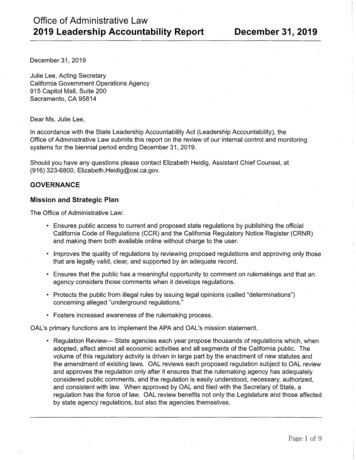
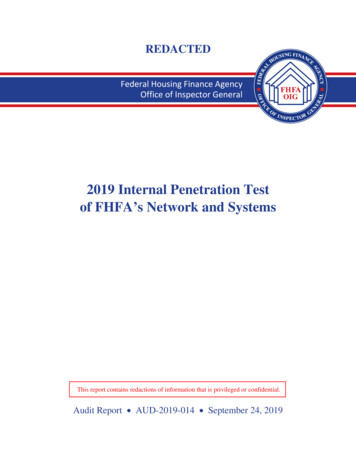
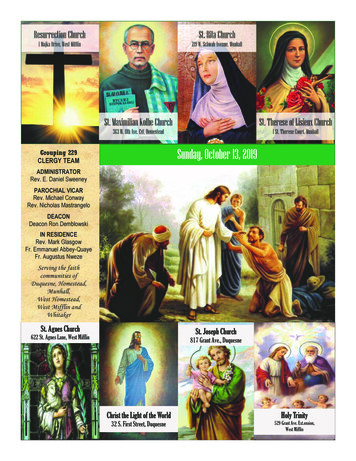
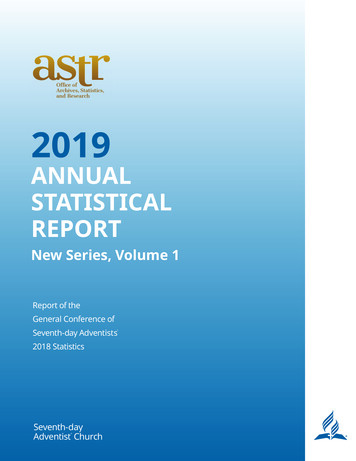
STATISTICAL REPORTof Seventh-day Adventist Conferences, Missions, and Institutions throughout the worldfor the year ending 2018ABOUT THIS REPORT: A New ApproachAbout this Edition of the ASR. This is the first in a new series ofthe annual reports of Seventh-day Adventist statistics that have been produced since first mandated by the General Conference Session on May16, 1866. It reports membership, congregational, institutional, financial,and personnel statistics as of December 31, 2018. The report includescolor charts illustrating key statistics and statistical trends (pp. 5–6) anda map of the 10/40 Window (p. 97), which continues to be a key priorityfor the Adventist Church.Earlier this year the 2018 membership statistics were issued as anelectronic-only “early release.” Now those statistics are included with therest of the 2018 statistics in this hardcopy edition. This will be the regularpattern henceforth: membership and congregational statistics will bereleased in a digital edition in the spring following the year in question,and also included in a print edition at the end of the year along with allthe departmental, institutional, financial, and personnel statistics.Because this represents a significant new departure, we have adopted anew enumeration, with this edition being Annual Statistical Report, NewSeries, Volume 1.New Members Joining the Church. 2018 was another landmarkyear for Adventist church growth: a total of 1,383,427 people becameSeventh-day Adventists by baptism and profession of faith. This was theseventeenth year in all and fifteenth in succession in which more thanone million new members joined the Seventh-day Adventist Church.These numbers, while strong, have been leveling off in recent years, asseen in Chart 2. Throughout the year, on average, one new person joinedthe Seventh-day Adventist Church every 22.81 seconds, an average of157.82 accessions every hour. This joy is tempered by the fact that 2018also saw 611,467 members removed from church rolls, making the netgain only 687,432.The geographic areas in which the church is growing being a topicof frequent interest, Chart 1 demonstrates accessions by division overthe last five years. Charts 3 and 4 demonstrate the extent to which thoseaccessions are offset by losses and deaths.Adventist Mortality. This year Charts 5 and 6 illustrate the 10year trend in the reporting of church member deaths; as in the past, theyare shown in terms of the “mortality rate” (deaths per thousand people),and analyzed in comparison to the mortality of the wider population,which provides a check on the accuracy of our reported membershipstatistics. We are pleased to note that there was a modest uptick in 2018in the Adventist mortality as a percentage of general mortality. This is asign of greater integrity in terms of the membership being reported andhence is to be welcomed. We hope that the trend might continue, but thereality is that there has been very little change over the last ten years.Languages. We are happy to observe that the change to the datagathering process for Table 33, Languages and Dialects in Which SDAPublications are Now in Print, which was first introduced for the 2017data, appears to have had the desired effect in increasing the accuracyand completeness of this table.Attendance. Despite being a standard data point in membershipreports for some years now, attendance figures continue to besubstantially inaccurate. This renders them less valuable as tools forunderstanding the activity of the church and laying future plans. Everypastor should want to know their church’s attendance; the officers ofevery conference should want to know. We are pleased that certainterritories that were not reporting attendance have started to do so. Welook forward to this becoming the established pattern, as this will allowmore substantial and meaningful analysis of trends, whether at the local,union, or General Conference levels.Healthcare Report. We can also happily observe that after lastyear’s hiatus the healthcare report is once again a feature of the ASR.Completeness has been a challenge with this report for many years.There was marked improvement with the 2018 data, but thatimprovement was not uniform. The hospitals section is the mostcomplete. Nursing homes, clinics, and orphanages are somewhat betterthan before, but still need work. The airplanes and medical launchessection is laughable for its lack of data.A Seventh-day Adventist statistical archive consisting of paststatistical reports, tables, and documents is available online at:www.adventiststatistics.org.Dr. D. J. B. Trim—Statistics within this report compiled by Kathleen Jones, Lisa Rasmussen, andRoger Bello.Office of Archives, Statistics,and Research Staff.
STATISTICAL REPORT3TABLE OF CONTENTSAlphabetical Index - Page 105Key to Seventh-day Adventist Divisions, Table 1 . . . . . . . . . . . . . . . . . . . . . . . . 3Scheduled Meetings, Table 2. . . . . . . . . . . . . . . . . . . . . . . . . . . . . . . . . . . . . . . 3Accessions, Table 3 . . . . . . . . . . . . . . . . . . . . . . . . . . . . . . . . . . . . . . . . . . . . . . 4Church Membership by World Divisions, Table 4. . . . . . . . . . . . . . . . . . . . . . . . 4General Survey of Organizations, Table 5 . . . . . . . . . . . . . . . . . . . . . . . . . . . . . 4Summary of Institutions, Table 6 . . . . . . . . . . . . . . . . . . . . . . . . . . . . . . . . . . . . 4Tithe and Offerings 2018, Table 7 . . . . . . . . . . . . . . . . . . . . . . . . . . . . . . . . . . . 4Tithe and Offerings, Table 8 . . . . . . . . . . . . . . . . . . . . . . . . . . . . . . . . . . . . . . . . 4Accessions by Division Over Five Years, Chart 1 . . . . . . . . . . . . . . . . . . . . . . . 5Accessions Over 10 Years, Chart 2 . . . . . . . . . . . . . . . . . . . . . . . . . . . . . . . . . . 5Accessions and Losses Over 10 Years, Chart 3 . . . . . . . . . . . . . . . . . . . . . . . . 5Changes in Membership Over Five Years, Chart 4 . . . . . . . . . . . . . . . . . . . . . . 6Adventist Mortality - A 10-Year Trend, Chart 5. . . . . . . . . . . . . . . . . . . . . . . . . . 6Adventist Mortality as a Percent of General Mortality A 10-Year Trend, Chart 6 . . . . . . . . . . . . . . . . . . . . . . . . . . . . . . . . . . . . . . . . 6General and Institutional Employees, Table 9 . . . . . . . . . . . . . . . . . . . . . . . . . . 7Literature Evangelists, Table 10. . . . . . . . . . . . . . . . . . . . . . . . . . . . . . . . . . . . . 7Food Industries, Table 11. . . . . . . . . . . . . . . . . . . . . . . . . . . . . . . . . . . . . . . . . . 7Publishing, Table 12. . . . . . . . . . . . . . . . . . . . . . . . . . . . . . . . . . . . . . . . . . . . . . 7Women’s Ministries, Table 13 . . . . . . . . . . . . . . . . . . . . . . . . . . . . . . . . . . . . . . 7Youth Ministries, Table 14 . . . . . . . . . . . . . . . . . . . . . . . . . . . . . . . . . . . . . . . . . 7Children’s Ministries, Table 15 . . . . . . . . . . . . . . . . . . . . . . . . . . . . . . . . . . . . . . 8Healthcare Institutions, Table 16 . . . . . . . . . . . . . . . . . . . . . . . . . . . . . . . . . . . . 8Count of Unions, Conferences, and Local Fields, Table 17 . . . . . . . . . . . . . . . . 8Broadcast Ministries, Table 18 . . . . . . . . . . . . . . . . . . . . . . . . . . . . . . . . . . . . . . 8Sabbath School and Personal Ministries, Table 19 . . . . . . . . . . . . . . . . . . . . . . 9Education, Table 20 . . . . . . . . . . . . . . . . . . . . . . . . . . . . . . . . . . . . . . . . . . . . . . 9Missionaries, Table 21 . . . . . . . . . . . . . . . . . . . . . . . . . . . . . . . . . . . . . . . . . . . . 9Denominationally Employed Workers Classified by Type of Employment2018, Table 22 . . . . . . . . . . . . . . . . . . . . . . . . . . . . . . . . . . . . . . . . . . . . . 10Denominationally Employed Workers Classified by Credentials Carried 2018,Table 23 . . . . . . . . . . . . . . . . . . . . . . . . . . . . . . . . . . . . . . . . . . . . . . . . . . 10Membership Statistics by Division for 2018, Table 24 . . . . . . . . . . . . . . . . . . . 12Tithes and Offerings by Division 2018, Table 25 . . . . . . . . . . . . . . . . . . . . . . . 31Denominational Employees by Division 2018, Table 26 . . . . . . . . . . . . . . . . . 50Institutional Statistics for 2018 . . . . . . . . . . . . . . . . . . . . . . . . . . . . . . . . . . . . . 77Section I–Educational Institutions and Primary Schools, Table 27 . . . . . . . . 77Section II–Healthcare Institutions, Table 28 . . . . . . . . . . . . . . . . . . . . . . . . . 81Section III–Publishing Houses, Table 29. . . . . . . . . . . . . . . . . . . . . . . . . . . . 88Section IV–Food Industries, Table 30 . . . . . . . . . . . . . . . . . . . . . . . . . . . . . . 89Adventist Development and Relief Agency International (ADRA),Tables 31, 32. . . . . . . . . . . . . . . . . . . . . . . . . . . . . . . . . . . . . . . . . . . . . . . 90Global Mission . . . . . . . . . . . . . . . . . . . . . . . . . . . . . . . . . . . . . . . . . . . . . . . . . 91The Church’s Presence, Outreach, and Mission . . . . . . . . . . . . . . . . . . . . . 91GM Table 1–Conf/Miss Where Each Church Serves More Than OneMillion Persons . . . . . . . . . . . . . . . . . . . . . . . . . . . . . . . . . . . . . . . . . . . . . 91GM Table 1a–Countries and Areas Where SDA Work is Not CurrentlyEstablished . . . . . . . . . . . . . . . . . . . . . . . . . . . . . . . . . . . . . . . . . . . . . . . . 92GM Table 2–Seventh-day Adventist Presence in Countriesand Areas of the World . . . . . . . . . . . . . . . . . . . . . . . . . . . . . . . . . . . . . . . 93GM Table 3–10/40 Window. . . . . . . . . . . . . . . . . . . . . . . . . . . . . . . . . . . . . . 9610/40 Window Map . . . . . . . . . . . . . . . . . . . . . . . . . . . . . . . . . . . . . . . . . . . . 97Languages and Dialects in Which SDA Publications are Now in Print,Table 33 . . . . . . . . . . . . . . . . . . . . . . . . . . . . . . . . . . . . . . . . . . . . . . . . . . 98Summary of Seventh-day Adventist World Statistics, Table 34 . . . . . . . . . . . 100A General Survey of Statistical and Financial Summaries Over a Periodof Years, Table 35 . . . . . . . . . . . . . . . . . . . . . . . . . . . . . . . . . . . . . . . . . . 101Total Tithe and Offerings From Date of Organization to the Present Time,Table 36 . . . . . . . . . . . . . . . . . . . . . . . . . . . . . . . . . . . . . . . . . . . . . . . . . 102Sessions of the General Conference of Seventh-day Adventists, Table 37. . 104Officers of the General Conference of Seventh-day Adventists, Table 38 . . . 104Alphabetical Index . . . . . . . . . . . . . . . . . . . . . . . . . . . . . . . . . . . . . . . . . . . . . 105Note—Adventist and Seventh-day Adventist are the registered trademarks of the General Conference of Seventh-day Adventists .KEY TO SEVENTH-DAY ADVENTIST DIVISIONS AND GC ATTACHED UNION/FIELDECDESDIADEUDNADEast-Central Africa DivisionEuro-Asia DivisionInter-American DivisionInter-European DivisionNorth American DivisionNSDSADSPDSIDSUDNorthern Asia-Pacific DivisionSouth American DivisionSouth Pacific DivisionSouthern Africa-Indian Ocean DivisionSouthern Asia DivisionSSDTEDWADMENAISRFTable 1Southern Asia-Pacific DivisionTrans-European DivisionWest-Central Africa DivisionMiddle East and North Africa Union MissionIsrael FieldSCHEDULED MEETINGSMeetingDateLocationSpring Meeting . . . . . . . . April 14 and 15, 2020 . . . Silver Spring, MarylandGeneral Conf Session . . . June 25 to July 4, 2020 . Indianapolis, IndianaAnnual Council . . . . . . . . October 8 to 14, 2020. . . Silver Spring, MarylandMeetingTable 2DateLocationSpring Meeting . . . . . . . . April 13 and 14, 2021. . . . Silver Spring, MarylandAnnual Council . . . . . . . . October 7 to 13, 2021 . . . Silver Spring, MarylandSpring Meeting . . . . . . . . April 12 and 13, 2022. . . . Silver Spring, Maryland
4GENERAL STATISTICS.ACCESSIONS(Additions to the Church by Baptism and Profession of Faith)Division/Attached Fields2015201620172018Accessionsas Percent ofWorld Total2018East-Central Africa . . . . . . . . . . . .274,011343,365388,035380,271Euro-Asia . . . . . . . . . . . . . . . . . . .3,2672,9293,0692,478Inter-American . . . . . . . . . . . . . . .177,490186,594184,943197,904Inter-European . . . . . . . . . . . . . . .4,3204,0544,2573,720North American . . . . . . . . . . . . . .37,60737,02837,58034,460Northern Asia-Pacific . . . . . . . . . .18,91023,37718,17215,586South American . . . . . . . . . . . . . .254,768254,857231,406218,921South Pacific . . . . . . . . . . . . . . . .26,73061,73139,46844,096Southern Africa-Indian Ocean . . .270,664278,070268,121266,055Southern Asia. . . . . . . . . . . . . . . .32,54124,35831,28020,875Southern Asia-Pacific. . . . . . . . . .97,89482,14981,417127,023Trans-European . . . . . . . . . . . . . .2,7232,1042,2882,447West-Central Africa . . . . . . . . . . .59,75655,62462,63269,312Attached to the General Conf:Middle East and North Africa Un173182203218Israel Field. . . . . . . . . . . . . . . . .26546061Totals . . . . . . . . . . . . . . . . . . . . . . 1,260,880 1,356,476 1,352,931 1,383,427Note—Beginning with 2015, accessions also include the “adjustments added” st-Central Africa . . . . . . . . . . . . 3,046,313Euro-Asia . . . . . . . . . . . . . . . . . . .114,879Inter-American . . . . . . . . . . . . . . . 3,608,385Inter-European . . . . . . . . . . . . . . .178,460North American . . . . . . . . . . . . . . 1,201,366Northern A
seen in Chart 2. Throughout the year, on average, one new person joined the Seventh-day Adventist Church every 22.81 seconds, an average of 157.82 accessions every hour. This joy is tempered by the fact that 2018 also saw 611,467 members removed from church rolls, making the net gain only 687,432. The geographic areas in which the c hurch is growing being a topic of frequent interest, Chart 1 .