Transcription
Academic Program Viability ReportUpper Division Programs 2012-13St. Petersburg CollegeMarch 2014
St. Petersburg CollegeP.O. Box 13489St. Petersburg, FL 33733Table of ContentsIntroduction. 1Viability Measure Descriptions . 3SPC Vocational Programs . 5Program Viability Reports . 7Biology . 7College of Business . 19Business Administration . 19International Business . 29Management and Organizational Leadership . 39Sustainability Management. 49College of Computer & Information Technology . 59Technology Management . 59College of Education . 68Educational Studies/Pre-K Primary Education . 68Elementary Education . 78Exceptional Student Education . 87Mathematics Education . 96Science Education . 105College of Health Sciences . 114Dental Hygiene . 114Health Services Administration . 125College of Nursing . 137Nursing . 137Orthotics and Prosthetics. 147College of Policy and Legal Studies . 158Paralegal Studies . 158Public Policy Administration . 168College of Public Safety Administration . 181Public Safety Administration. 181School of Veterinary Technology . 192Veterinary Technology . 192Contact Information . 201
IntroductionThe Academic Program Viability Report (APVR) was designed as anabbreviated yearly summative evaluation of a program’s viability andproductivity. It provides key College stakeholders such as thePresident’s Strategic Issues Council members a snapshot of relevantprogram specific information in order to highlight program trends andissues. The publication of this report begins the process of makingcritical decisions regarding the continued sustainability of a program.Reports indicating positive program trends may be used to identifyand document best practices that can be utilized by programsthroughout the College. Programmatic issues can be furtherinvestigated through the Comprehensive Academic Program Review(CAPR) process. Normally occurring on a three-year cycle, the CAPRprocess may also be initiated at the President’s request.This 2012-13 Academic Program Viability Report contains detailedmeasure descriptions as well as individual program reports for allupper division programs designated by the active nineteen academicorganization levels.Program Viability ProcessThe program viability process begins with the drafting of trend chartsfor each of the programs in each of the five main measure areas: SSHEnrollment, Unduplicated Headcount, Course Success Rate, PercentFull Metric, and Program Graduates [Note: the sixth area,employment trend information, is not charted and cannot be directlyimpacted by program performance].To enhance the program viability report process, it was decided in2013 that program specific data would be extracted from SPC’sPulse/Business Intelligence. Program administrators extracted theirprograms’ trend charts and uploaded them to SharePoint duringtraining sessions held by Institutional Research and Effectiveness infall 2013. Program administrators later reviewed their respectiveprogram charts in preparation for the individual meetings.As in prior years, program administrators met with assessment andworkforce personnel to review the measure data charts and discussvarious actions (3-5 overall) that they could implement within theirprograms to improve upon their prior performance.Academic Program Viability Report UD 2012-131
Program Action PlansA Program Action Plan is used to capture this information. After theprogram viability meeting and agreement by the appropriate parties,program administrators complete an automated form, which is addedto each program’s APVR.Follow-up ReportsThese meetings also contained a discussion regarding the previousyear’s performance on the action plans. A second form, ProgramAction Plan follow-up, is used to capture the qualitative results ofthe previous year’s action plan items. This completed form is alsoadded to the program’s APVR.Academic Program Viability Report UD 2012-132
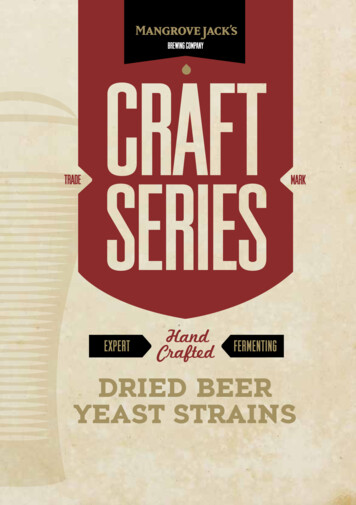
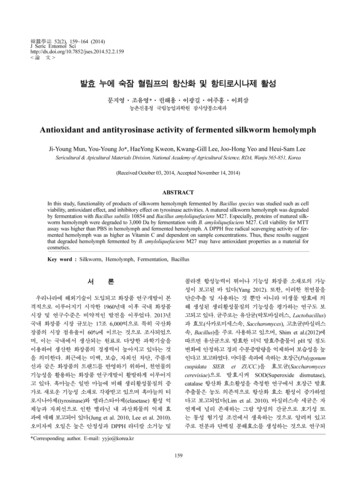
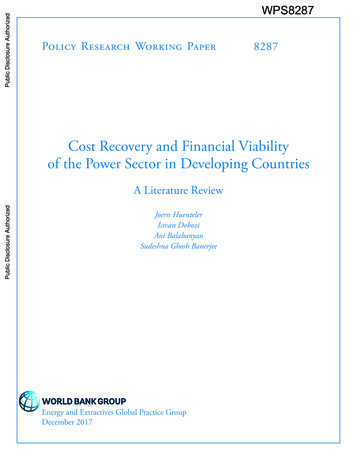
2012-13 Viability Report Measure DescriptionsThe enhanced individual program reports include six measures whichare designed to evaluate a program’s viability. The source of theinformation for the first five measures is the Viability ReportDashboard in the SPC Pulse/Business Intelligence system. Measureswere extracted between September 12, 2013 and October 4th, 2013.Each measure is described in detail below.Measure #1: Unduplicated HeadcountUnduplicated headcount is the total number of unduplicated studentsenrolled in courses within the specified Academic Organization duringthe selected academic years. The filters for the UnduplicatedStudent Count measure are as follows: Term Desc - Multi: 2009, 2010, 2011, 2012Career - Program - Plan - Subplan - Multi: UndergraduateCollege - Group - Acad Org - Subject: Academic OrganizationAll other filters: AllMeasure #2: SSH EnrollmentSSH enrollment is defined as the total number of student semesterhours in the specified Academic Organization during the selectedacademic years. The filters for the SSH Enrollment measure are asfollows: Term Desc - Multi: 2009, 2010, 2011, 2012Career - Program - Plan - Subplan - Multi: UndergraduateCollege - Group - Acad Org - Subject: Academic OrganizationAll other filters: AllMeasure #3: PerformanceThe performance graph displays the percent of students successfullycompleting a course with a grade of A, B, or C (success rate), dividedby the total number of students enrolled in courses within theAcademic Organization during the selected academic years.The performance table includes the percent of students successfullycompleting a course with a grade of A, B, or C (success rate), as wellas the percent of students who withdrew, or received a grade of F orWF, within the Academic Organization during the selected academicyears.The filters for the Performance measure are as follows:Academic Program Viability Report UD 2012-133
Term Desc - Multi: 2009, 2010, 2011, 2012Career - Program - Plan - Subplan - Multi: UndergraduateCollege - Group - Acad Org - Subject: Academic OrganizationAll other filters: AllMeasure #4: Percent FullThe percent full metric is calculated by dividing the actualenrollment count of the specified Academic Organization, by theStandard Course Load (SCL) for selected the academic terms. Thefilters for the Percent Full metric are as follows: Term Desc - Multi: 2012-13 Fall, Spring, Summer; 2013-14 FallCollege - Group - Acad Org - Subject: Academic OrganizationClass Status: Active, Full, Stop Further EnrollmentAll other filters: AllMeasure #5: GraduatesThe graduates measure depicts the total number of graduates withinspecified program plan(s) associated with the Academic Organization,for the selected academic years. The filters for the Graduatesmeasure are as follows: Term Desc - Multi: 2009, 2010, 2011, 2012Graduation Degree Plan Subplan - Multi: All ApplicableProgram PlansAll other filters: AllMeasure #6: National, State, and County TrendsEmployment trend information is reported by country, state, andcounty. The source of the information is: Economic ModelingSpecialists International www.economicmodeling.com .Jobs (2013)refers to the average annual job openings due to growth and netreplacement; % Change (2012-2017) depicts the percent change inthe number of annual job openings during the five-year period; andMedian Earnings refers to the average earnings for the specified jobtitle.[Note: the sixth area, employment trend information, isnot charted and cannot be directly impacted by programperformance. Trend data by job title(s) will be provided toeach program].Academic Program Viability Report UD 2012-134
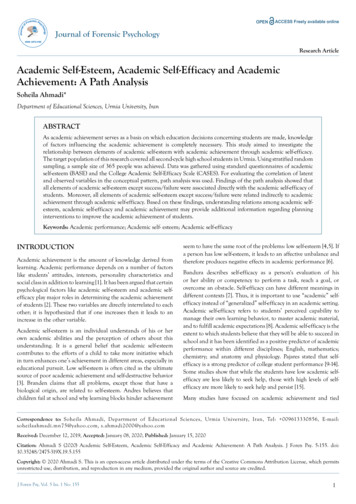
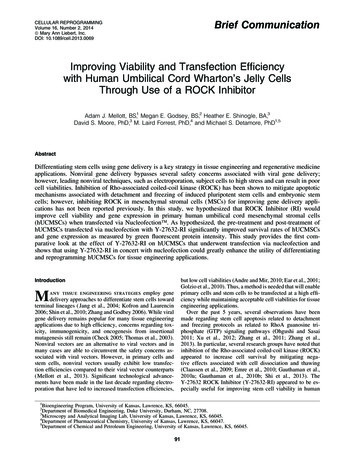
St. Petersburg CollegeSPC Vocational Programs (Upper Division)Vocational Program EnrollmentFigure 1: Annual Unduplicated HeadcountSource: 2013-14 SPC Factbook, Table 27Figure 2: End of Fall HeadcountSource: 2013-14 SPC Factbook, Table 16Note: Students with an unknown Home Campus are excluded.Academic Program Viability Report UD 2012-135
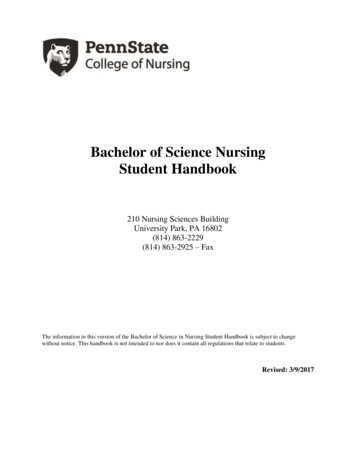
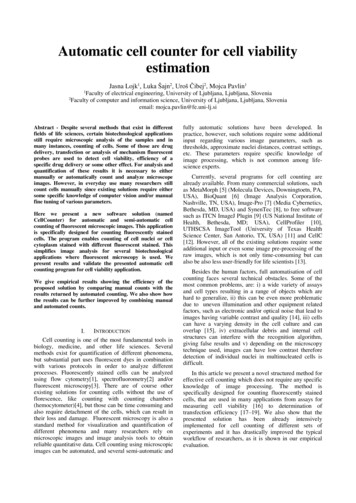
St. Petersburg CollegeSPC Vocational ProgramsFulltime Equivalents and CompletersFigure 3: Annual Fulltime EquivalentSource: 2013-14 SPC Factbook, Table 21Figure 4: Annual Unduplicated HeadcountSource: 2013-14 SPC Factbook, Table 27Academic Program Viability Report UD 2012-136
Enrollment1 of SA/Dashboards/Academic Program Viability .Student InformationEnrollmentRobert Mohr IIIAcademic Program Viability Report : Enrollment Performance Percent Full GraduatesUnduplicated Student Count Gra Class Academic Career: UGRD, Class College School Dept - Academic Group Desc - Academic Organization - Subject Catalog Nbr: BIOLOGY-UD, Student Term Career DeStudent System Cube RefreshLast Refresh:11/19/2013 5:30:49 AMAcademic Year - Term Desc - Multi: 2009, 2010, 2011, 2012Campus Description:Career - Program - Plan - Subplan - Multi: UndergraduateCollege - Group - Acad Org - Subject: BIOLOGY-UDCourse Instructional Method: AllStudent Type (FTIC):Age Group:Ethnic Group:Gender:Unduplicated Student Co Class Academic Career: UGRD, Class College School Dept - Academic Group Desc - Academic Organization - Subject Catalog Nbr: BIOLOGY-UD, Student Term Career DeTerm Academic Year - Term Desc Unduplicated Student Count200913201016120112552012323Academic Program Viability Report UD 2012-13711/20/2013 3:13 PM
Enrollment1 of SA/Dashboards/Academic Program Viability .Student InformationEnrollmentRobert Mohr IIIAcademic Program Viability Report : Enrollment Performance Percent Full GraduatesSSH Enrollment GraphClass Academic Career: UGRD, Class College School Dept - Academic Group Desc - Academic Organization - Subject Catalog Nbr: BIOLOGY-UD, Student Term Career DeStudent System Cube RefreshLast Refresh:11/21/2013 6:37:58 AMAcademic Year - Term Desc - Multi: 2009, 2010, 2011, 2012Campus Description:Career - Program - Plan - Subplan - Multi: UndergraduateCollege - Group - Acad Org - Subject: BIOLOGY-UDCourse Instructional Method: AllStudent Type (FTIC):Age Group:Ethnic Group:Gender:SSH EnrollmentClass Academic Career: UGRD, Class College School Dept - Academic Group Desc - Academic Organization - Subject Catalog Nbr: BIOLOGY-UD, Student Term Career DeTerm Academic Year - Term Desc Units Taken20096420101,41520112,65320123,487Academic Program Viability Report UD 2012-13811/21/2013 8:45 AM
Percent Full1 of SA/Dashboards/Academic Program Viability .Student InformationPercent FullRobert Mohr IIIAcademic Program Viability Report : Enrollment Performance Percent Full GraduatesPercent Full Metric GraphStudent System Cube RefreshNo background selections existLast Refresh:11/21/2013 6:37:58 AMAcademic Year - Term Desc - Multi: Fall Term 2012-2013 (460), Spring T Campus Description:College - Group - Acad Org - Subject: BIOLOGY-UDCourse Instructional Method: AllClass Status: Active, Full, Stop Further EnrollmentPercent Full Metric by Instructional MethodNo background selections existAllTerm Academic Year - Term Desc MeasuresFace-to-FaceIndependent StudyFall Term 2012-2013 (460)Enrollment Count4043757Online22Fall Term 2012-2013 (460)Standard Course Load267248712Fall Term 2012-2013 (460)Percent Full151.3%151.2%100.0%183.3%Spring Term 2012-2013 (465)Enrollment Count406375823Spring Term 2012-2013 (465)Standard Course Load246226812Spring Term 2012-2013 (465)Percent Full165.0%165.9%100.0%191.7%23Summer Term 2012-2013 (470)Enrollment Count2111853Summer Term 2012-2013 (470)Standard Course Load196181312Summer Term 2012-2013 (470)Percent Full107.7%102.2%100.0%191.7%Fall Term 2013-2014 (0475)Enrollment Count397374221Fall Term 2013-2014 (0475)Standard Course Load263249212Fall Term 2013-2014 (0475)Percent Full151.0%150.2%100.0%175.0%Academic Program Viability Report UD 2012-13911/21/2013 10:06 AM
Performance1 of SA/Dashboards/Academic Program Viability .Student InformationPerformanceRobert Mohr IIIAcademic Program Viability Report : Enrollment Performance Percent Full GraduatesSuccess Rate GraphStudent System Cube RefreshClass Academic Career: UGRD, Grade Success Rate Grade Input: Y, Class College School Dept - Academic Group Desc - Academic Organization - Subject Catalog Nbr: BIOLOGY-UD, Grade SuLast Refresh:11/21/2013 6:37:58 AMAcademic Year - Term Desc - Multi: 2009, 2010, 2011, 2012Campus Description:Career - Program - Plan - Subplan - Multi: UndergraduateCollege - Group - Acad Org - Subject: BIOLOGY-UDCourse Instructional Method: AllStudent Type (FTIC):Age Group:Ethnic Group:Gender:PerformanceClass Academic Career: UGRD, Grade Success Rate Grade Input: Y, Class College School Dept - Academic Group Desc - Academic Organization - Subject Catalog Nbr: BIOLOGY-UD, Grade SuTerm Academic Year - Term Desc Enrollment CountSuccess RateWithdrawal RateF RateWF %Academic Program Viability Report UD 2012-131011/21/2013 9:34 AM
Graduates1 of SA/Dashboards/Academic Program Viability .Student InformationGraduatesRobert Mohr IIIAcademic Program Viability Report : Enrollment Performance Percent Full GraduatesOverall Graduates TrendStudent System Cube RefreshNo background selections existLast Refresh:11/21/2013 6:37:58 AMAcademic Year - Term Desc - Multi: 2009, 2010, 2011, 2012Graduation Degree Plan Subplan - Multi: BIOLOGY-BSAge Group:Gender:Ethnic Group:Overall Graduates CountNo background selections existGraduation Degree - Plan - Sub Plan MeasuresBIOLOGY-BSGraduation Data Count201120121428Academic Program Viability Report UD 2012-131111/21/2013 1:58 PM
Table 1 Growth for Natural sciences managersJobs (2013)% Change (20122017)Median EarningsUS50,2836.7% 55.64/hrFlorida1,08314.3% 48.21/hrPinellas County3626.9% 50.95/hrSource: Economic Modeling Specialists International www.economicmodeling.comTable 2 Growth for Biological scientists, all otherJobs (2013)% Change (20122017)Median EarningsUS32,5535.8% 34.95/hrFlorida1,3915.4% 33.08/hrPinellas County7413.2% 22.44/hrSource: Economic Modeling Specialists International www.economicmodeling.comTable 3 Growth for All other life scientistsJobs (2013)% Change (20122017)Median EarningsUS9,3625.6% 31.41/hrFlorida19810.0% 28.64/hrPinellas County130.9% 27.02/hrSource: Economic Modeling Specialists International www.economicmodeling.comAcademic Program Viability Report UD 2012-1312
Table 4 Growth for Biological techniciansJobs (2013)% Change (20122017)Median EarningsUS74,7268.9% 19.11/hrFlorida1,66913.3% 16.78/hrPinellas County4621.2% 14.70/hrSource: Economic Modeling Specialists International www.economicmodeling.comAcademic Program Viability Report UD 2012-1313
Action Plan Follow-up and Evaluation Report for 2011-12 Viability ReportProgram: Biology, BSDate Completed: November 2013Prepared By: John ChapinI.Action Plan Items StatusAction Item1Add milestonesto the newlydevelopedacademic maps,where coursesand specialrequirementsnecessary fortimelyprogression todegreecompletion tusStatus duatesAcademic maps have been developedNotCompleted and some milestones have been addedUnduplicatedHeadcount,PlacementCompleted The following new courses werebut more work must be done reachingout to graduate schools, standardizedtesting agencies, etc. to build acomplete listThis item wasmoved forwardfrom the 201011 ViabilityReport.2Develop newcourses forcurriculum andmodify existingcourses to beginto offer morecourses inBiotechnology sothat we caneventuallyprovide a track,certificate, orAS/BS transitionprogram.developed: Intro to Biotech (BSC2420C); Special Topics and Seminars inBiology (BSC 3931); Biology Laboratorytechniques (BSC 3931L); ScientificCommunication (BSC 3932);Instructional Experiences inUndergraduate Biology (BSC 4937);Molecular Biology (PCB 4024);Internship in Biological Sciences(BSC4940).Academic Program Viability Report UD 2012-1314
Action ItemMeasureAddressed(Value)CompletionStatusStatus ExplanationOnly the following two new coursesreceived support for submission to BOT:Molecular Biology (PCB 4024);Internship in Biological Sciences(BSC4940) Modifications completed:BCH 4024, PCB 3063C and PCB 4674345Add checklist ofwhen studentscan demonstrateskills and facultycan documentcompetence in avariety ofbiological laband fieldtechniques.CourseSuccess,PlacementFaculty have been surveyed for itemsNotCompleted to include on the checklist but moreHostundergraduateresearchsymposia ccess,PlacementCompleted May 2013 Tri Beta Honor Society hostedEnhanceinteractivity andactive learningwithin theclassroom,critical thinkingwithin the labandcollaboration inboth lecturesand labs usingtechnology.UnduplicatedHeadcountCompleted All students within the programneeds to be added and format fordocumenting and assessing must beestablished.an undergraduate research symposiumwhere 20 students and facultypresented posters of research tofaculty, students and administrators.purchase a Response Card to use inmost of the BS classes. Faculty havecommitted to using these in theclassroom. We have not incorporatedipads into laboratories yet as theresources to purchase ipads for labs(listed in item 2 of 2012-2013 report)were not availableAcademic Program Viability Report UD 2012-1315
II. Non-Completed Action Plan Items and Plan for CompletionAction Item1Add milestones to the newlydeveloped academic maps,where courses and specialrequirements necessary fortimely progression to degreecompletion are identified.CompletionDateSeptember2014Academic maps have beendeveloped and some of the specialrequirements and milestones havebeen added but not all. LindaGingerich and Meg Delgato willcontinue to research the majorroutes for Biology students anddetermine what milestones areneeded and where they should occurwithin the timeline of the degree.September2014Faculty will meet to create achecklist of skills and to develop aworkshop schedule that will teachand evaluate students’competencies.This item will be movedforward to the 2013-2014Viability report3Add checklist of when studentscan demonstrate skills andfaculty can documentcompetence in a variety ofbiological lab and fieldtechniques.Plan for CompletionThis item will be moved forwardto the 2013-2014 ViabilityreportIII. Evaluation of the Impact of Action Plans on Program QualityWith the growth, we have been able to maintain high student success rates, while continuingto keep high efficiency measures for the college. We are continuing to work on addingformalized milestones to the academic roadmaps. Since there are a wide variety of careerpaths from Biology, we are putting together milestones for each path along with a way todocument demonstration of specific competencies. Such demonstration of competencies willincrease student placement and success in the workplace. Academic roadmaps have beendeveloped to facilitate academic advisement. Recitation sections continue to improve qualityof instruction and student success. Biology faculty hold some of their office hours in theLearning Support Center to further enhance learning outside the classroom. We added severalnew courses that will be offered starting Fall 2014. One of these is an internship course inBiology, which will greatly enhance outside-of-classroom experiences and make our studentsmore competitive upon graduation. We redesigned and updated three of our courses toreflect current program needs.Academic Program Viability Report UD 2012-1316
St. Petersburg CollegeProgram Action PlanProgram: Biology, Upper DivisionDate Completed: 3/6/2014Prepared By: Linda GingerichI. Action Plan Items - Due September 2014Viability MeasureAddressedAction Item1Add milestones to the newlydeveloped academic maps, wherecourses and special requirementsnecessary for timely progression todegree completion are identified.GraduatesSPC Strategic PriorityPromote g DelgatoThis item was moved forward fromthe 2011-12 action plan2Add checklist of when students candemonstrate skills and faculty candocument competence in a variety ofbiological lab and field techniques.GraduatesExpand the CollegeExperienceLindaGingerichMeg DelgatoThis item was moved forward fromthe 2011-12 action planLindaGingerich3Create a Biotechnology subplan withinthe BS Biology degree.GraduatesExpand WorkforceOpportunities forStudentsMichelleOsovitzKathy SieglerII. Special Resources Needed:With the existing demands in the laboratories of our Biology program and the expandingbiotechnology subplan, we need a full-time Laboratory Specialist position.With the diversity of needs to adequately prepare our graduates to enter the workforce or to becompetitive as they apply to graduate and professional schools (Medical, Dental, Pharmacy, etc.)we need a Student Success Coordinator to serve as a liaison between SPC and the varied graduateschools and employers.Academic Program Viability Report UD 2012-1317
St. Petersburg CollegeIII. Area(s) of Concern/Improvement:Our only concern is that, if we are unable to acquire the resources needed, the quality of ourprogram will be jeopardized if we cannot offer the high quality lab experiences and workindividually with our students to ensure there preparedness and competitiveness as they graduate.Academic Program Viability Report UD 2012-1318
Enrollment1 of SA/Dashboards/Academic Program Viability .Student InformationEnrollmentRobert Mohr IIIAcademic Program Viability Report : Enrollment Performance Percent Full GraduatesUnduplicated Student Count GraphClass Academic Career: UGRD, Class College School Dept - Academic Group Desc - Academic Organization - Subject Catalog Nbr: BUS-UD, Student Term Career Desc - PrStudent System Cube RefreshLast Refresh:11/19/2013 5:30:49 AMAcademic Year - Term Desc - Multi: 2009, 2010, 2011, 2012Campus Description:Career - Program - Plan - Subplan - Multi: UndergraduateCollege - Group - Acad Org - Subject: BUS-UDCourse Instructional Method: AllStudent Type (FTIC):Age Group:Ethnic Group:Gender:Unduplicated Student CountClass Academic Career: UGRD, Class College School Dept - Academic Group Desc - Academic Organization - Subject Catalog Nbr: BUS-UD, Student Term Career Desc - PrTerm Academic Year - Term Desc Unduplicated Student Count200941201014620112362012245Academic Program Viability Report UD 2012-131911/20/2013 3:17 PM
Enrollment1 of SA/Dashboards/Academic Program Viability .Student InformationEnrollmentRobert Mohr IIIAcademic Program Viability Report : Enrollment Performance Percent Full GraduatesSSH Enrollment GraphClass Academic Career: UGRD, Class College School Dept - Academic Group Desc - Academic Organization - Subject Catalog Nbr: BUS-UD, Student Term Career Desc - PrStudent System Cube RefreshLast Refresh:11/21/2013 6:37:58 AMAcademic Year - Term Desc - Multi: 2009, 2010, 2011, 2012Campus Description:Career - Program - Plan - Subplan - Multi: UndergraduateCollege - Group - Acad Org - Subject: BUS-UDCourse Instructional Method: AllStudent Type (FTIC):Age Group:Ethnic Group:Gender:SSH EnrollmentClass Academic Career: UGRD, Class College School Dept - Academic Group Desc - Academic Organization - Subject Catalog Nbr: BUS-UD, Student Term Career Desc - PrTerm Academic Year - Term Desc Units Taken2009201201070220111,12820121,068Academic Program Viability Report UD 2012-132011/21/2013 8:48 AM
Percent Full1 of SA/Dashboards/Academic Program Viability .Student InformationPercent FullRobert Mohr IIIAcademic Program Viability Report : Enrollment Performance Percent Full GraduatesPercent Full Metric GraphStudent System Cube RefreshNo background selections existLast Refresh:11/21/2013 6:37:58 AMAcademic Year - Term Desc - Multi: Fall Term 2012-2013 (460), Spring T Campus Description:College - Group - Acad Org - Subject: BUS-UDCourse Instructional Method: AllClass Status: Active, Full, Stop Further EnrollmentPercent Full Metric by Instructional MethodNo background selections existAllTerm Academic Year - Term Desc MeasuresBlendedIndependent StudyFall Term 2012-2013 (460)Enrollment Count176323Online141Fall Term 2012-2013 (460)Standard Course Load2064824134Fall Term 2012-2013 (460)Percent Full85.4%66.7%12.5%105.2%Spring Term 2012-2013 (465)Enrollment Count16533132Spring Term 2012-2013 (465)Standard Course Load1824813490.7%68.8%98.5%Spring Term 2012-2013 (465)Percent FullSummer Term 2012-2013 (470)Enrollment Count15Summer Term 2012-2013 (470)Standard Course Load2424Summer Term 2012-2013 (470)Percent Full62.5%62.5%15Fall Term 2013-2014 (0475)Enrollment Count16510155Fall Term 2013-2014 (0475)Standard Course Load19624172Fall Term 2013-2014 (0475)Percent Full84.2%41.7%90.1%Academic Program Viability Report UD 2012-132111/21/2013 10:07 AM
Performance1 of SA/Dashboards/Academic Program Viability .Student InformationPerformanceRobert Mohr IIIAcademic Program Viability Report : Enrollment Performance Percent Full GraduatesSuccess Rate GraphStudent System Cube RefreshClass Academic Career: UGRD, Grade Success Rate Grade Input: Y, Class College School Dept - Academic Group Desc - Academic Organization - Subject Catalog Nbr: BUS-UD, Grade SuccessLast Refresh:11/21/2013 6:37:58 AMAcademic Year - Term Desc - Multi: 2009, 2010, 2011, 2012Campus Description:Career - Program - Plan - Subplan - Multi: UndergraduateCollege - Group - Acad Org - Subject: BUS-UDCourse Instructional Method: AllStudent Type (FTIC):Age Group:Ethnic Group:Gender:PerformanceClass Academic Career: UGRD, Grade Success Rate Grade Input: Y, Class College School Dept - Academic Group Desc - Academic Organization - Subject Catalog Nbr: BUS-UD, Grade SuccessTerm Academic Year - Term Desc Enrollment CountSuccess RateWithdrawal RateF RateWF %Academic Program Viability Report UD 2012-132211/21/2013 9:36 AM
Graduates1 of SA/Dashboards/Academic Program Viability .Student InformationGraduatesRobert Mohr IIIAcademic Program Viability Report : Enrollment Performance Percent Full GraduatesOverall Graduates TrendStudent System Cube RefreshNo background selections existLast Refresh:11/21/2013 6:37:58 AMAcademic Year - Term Desc - Multi: 2009, 2010, 2011, 2012Graduation Degree Plan Subplan - Multi: BUS-BSAge Group:Gender:Ethnic Group:Overall Graduates CountNo background selections existGraduation Degree - Plan - Sub Plan MeasuresBUS-BSGraduation Data Count201020112012153764Academic Program Viability Report UD 2012-132311/21/2013 1:03 PM
Table 1 Growth for Business operation specialists, All othersJobs (2013)% Change (20122017)Median EarningsUS961,4526.3% 31.31/hrFlorida64,7345.0% 27.71/hrPinellas County3,4073.6% 28.24/hrSource: Economic Modeling Specialists International www.economicmodeling.comTable 2 Growth for Administrative services mangersJobs (2013)% Change (20122017)Median EarningsUS269,6876.7% 38.98/hrFlorida10,12710.3% 45.70/hrPinellas County5817.7% 44.04/hrSource: Economic Modeling Specialists International www.economicmodeling.comAcademic Program Viability Report UD 2012-1324
Action Plan Follow-up and Evaluation Report for 2011-12 Viability ReportProgram: Business Administration, BSDate Completed: August 2013Prepared By: Greg NenstielI.Action Plan Items StatusMeasureAddressed(Value)Action Item1Review program goalsand assessmentmeasures todetermineappropriateness andrelevancy, which mayresult in necessaryrevisions.CompletionStatusStatus etedProgram goals and measures havebeen reviewed and revised. We arecurrently completing a new datacollection plan to ensure that weare able to efficiently collect datarelating to the establishedmeasures.Administer the ETSBusiness Major FieldTest as a nationallybenchmarkedlearning assessmentmeasure.ProgramGraduatesNotCompletedThe ETS testing is related to arequirement for Business programaccreditation through the ACBSP.The ACBSP accreditation initiativehas been put on hold due to othercompliance issues. Once adetermination has been maderegarding the accreditation pursuit,we will either offer the ETS testingor discontinue.Explore thepossibilit
Spring Term 2012-2013 (465) Percent Full 165.0% 165.9% 100.0% 191.7% Summer Term 2012-2013 (470) Enrollment Count 211 185 3 23 Summer Term 2012-2013 (470) Standard Course Load 196 181 3 12 Summer Term 2012-2013 (470) Percent Full 107.7% 102.2% 100.0% 191.7% Fall Term 2013-2014 (0475) Enrollment Count 397 374 2 21