![Chap3 Airline Economics[2] - George Mason University](/img/36/chap3-airline-economics-5b2-5d.jpg)
Transcription
Airline EconomicsChapter 3SYST 461/660 OR 750Spring 2010Sources:The Global Airline IndustryPeter Belobaba, Amedeo Odoni, Cynthia Barnhart, MIT, Library of Flight SeriesPublished by John Wiley & Sons, 2009, 520 pages, index.htmCENTER FOR AIR TRANSPORTATION SYSTEMS RESEARCH1
Outline Basic Terminology and Measures for Airline Economics Basic Airline Profit Equation and Airline Profit MaximizingStrategies Typical Passenger Trip Process Airline Markets Dichotomy of Supply and Demand O‐D Demand––––Factors affecting O‐D DemandTotal Trip Time ModelDemand ModelsO‐D Market Demand Functions Airline Competition and Market Share– Market Share/ Frequency Share Model Price/ Time Elasticity of Demand– Air Travel Demand Segments2CENTER FOR AIR TRANSPORTATION SYSTEMS RESEARCH
Four Types of Traffic“Airline Traffic” – Amount of airline output that isactually consumed or sold4 Types of TrafficPassenger AircraftCargo “Freighter” AircraftPassengersXPassenger BagsXAir FreightXXMailXX¾ Focus of this lesson is on Passenger Traffic3CENTER FOR AIR TRANSPORTATION SYSTEMS RESEARCH
Airline System‐Wide Measures Traffic – Enplaned Passengers– RPM Revenue Passenger Mile One paying passenger transported 1 mile– Yield Revenue per RPM Average fare paid by passengers, per mile flown– PDEW Passenger trips per day each way A common way to measure O‐D market demand Airline Demand Traffic “Rejected Demand”– “Rejected Demand” or “Spill” Passengers unable to find seats to fly Airline Supply– ASM Available Seat Mile One aircraft seat flown one mile– Unit Cost Operating Expense per ASM (“CASM”) Average operating cost per unit of output Airline Performance– Average Load Factor (LF) RPM/ASM Average Leg Load Factor (ALLF) Σ LF/ # of Flights Average Network or System Load Factor (ALF) ΣRPM/ΣASM– Unit Revenue Revenue/ASM (“RASM”)– Total Passenger Trip Time4CENTER FOR AIR TRANSPORTATION SYSTEMS RESEARCH
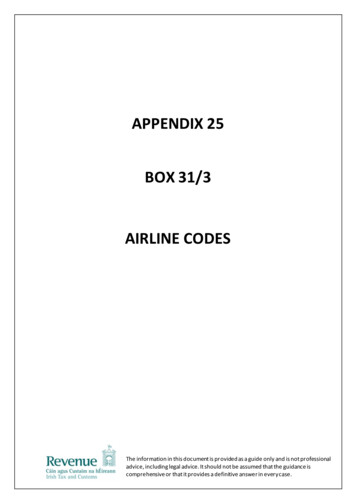
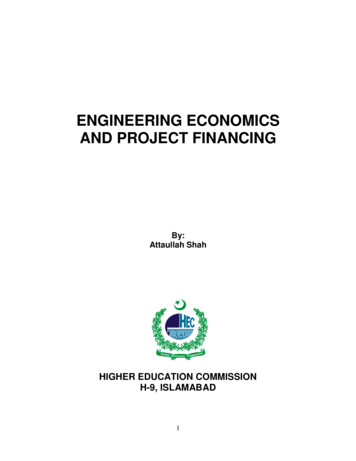
US Domestic Traffic (Revenue Passenger Miles) Source: BTS60RPM is Seasonal200520065520072008RPM (Billions)2009504540RPM Revenue Passenger MileOne paying passenger transported 1 mile35JanFebMarAprMayJunJulAugSepOctNovDec5CENTER FOR AIR TRANSPORTATION SYSTEMS RESEARCH
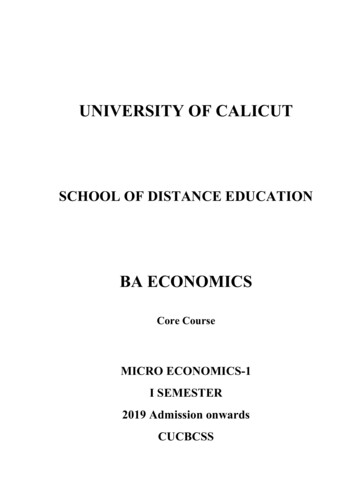
US Domestic Supply (Available Seat Miles) Source: BTS702005ASM is Seasonal20062007652008ASM (Billions)2009605550ASM Available Seat MileOne aircraft seat flown one mile45JanFebMarAprMayJunJulAugSepOctNovDec6CENTER FOR AIR TRANSPORTATION SYSTEMS RESEARCH
US Domestic Average Network Load Factors Source: BTS90%ALF is Seasonal200588%86%84%2006Peaks in RPM, ASM,and ALF in summer monthsstress the system200720082009ALF (%)82%80%78%76%74%Average Network or System LoadFactor (ALF) Dec7CENTER FOR AIR TRANSPORTATION SYSTEMS RESEARCH
Average Network Load Factors (ALF) Source: BTS80%75%Average Load Factors70%NAS65%NYMPSFMP60%55%Average Network or System LoadFactor (ALF) ΣRPM/ΣASM50%45%1990 1991 1992 1993 1994 1995 1996 1997 1998 1999 2000 2001 2002 2003 2004 2005 2006 2007 20088CENTER FOR AIR TRANSPORTATION SYSTEMS RESEARCH
Yield versus DistanceYield Revenue per RPMAverage fare paid by passengers,per mile flown9CENTER FOR AIR TRANSPORTATION SYSTEMS RESEARCH
Additional Airline Measures Average Stage Length– Average non‐stop flight distance– Aircraft Miles Flown/ Aircraft Departures– Longer average stage lengths associated with lower yields andlower unit costs (in theory) Average Passenger Trip Length– Average distance flown from origin to destination– Revenue Passenger Miles (RPM)/ Passengers– Typically greater than average stage length, since someproportion of passengers will take more than one flight(connections) Average Number of Seats per Flight Departure– Available Seat Miles (ASM)/ Aircraft Miles Flown– Higher average seats per flight associated with lower unit costs(in theory)10CENTER FOR AIR TRANSPORTATION SYSTEMS RESEARCH
Basic Airline Profit Equation Operating Profit RPM x Yield – ASM x Unit Cost(Revenue) – (Operating Expenses) Use of any of the individual terms as indicators ofairline success can be misleadingQ– High Yield is not desirable if ALF is too low– Low unit cost is of little value if Revenues are weak– High ALF can be the result of selling a large proportion ofseats at low faresPriceCENTER FOR AIR TRANSPORTATION SYSTEMS RESEARCH11
Airline Profit Maximizing StrategiesIntended BenefitStrategy PitfallsCutting Fares/ YieldsStimulate DemandThe price cut must generate a disproportionalincrease in total demand, “elastic demand”Increasing Fares/ YieldsIncrease RevenueThe price increase can be revenue positive ifdemand is “inelastic”Increase Flights (ASM)Stimulate DemandIncreases Operational CostsDecrease Flights (ASM)Reduce OperationalCostsLower Frequencies made lead to market sharelosses and lost demandImprove PassengerService QualityStimulate DemandIncreases Operational CostsReduce PassengerService QualityReduce OperationalCostsExcessive cuts can reduce market share anddemand12CENTER FOR AIR TRANSPORTATION SYSTEMS RESEARCH
US Airline Historical Reported Profits/ Losses (source BTS) 4,000RegionalLow‐Cost 3,000NetworkAIrline Profit /Losses ( M)21‐Carrier Total 2,000 1,000 ‐1QTR041QTR051QTR061QTR071QTR081QTR09 (1,000) (2,000) (3,000)CENTER FOR AIR TRANSPORTATION SYSTEMS RESEARCH13
Figure 3.1Typical Air Passenger TripOutbound Air TripGround EgressGround nd EgressDestinationGround AccessInbound Air Trip14CENTER FOR AIR TRANSPORTATION SYSTEMS RESEARCH
Enplanement/ Deplanement Enplanement1.2.3.4.5.Purchasing TicketsBoarding PassChecking BaggageUndergoing Security InspectionsBoarding Airplane Deplanement1.2.3.4.Exiting AirplaneExiting TerminalBaggage RetrievalImmigration and Customs Inspections15CENTER FOR AIR TRANSPORTATION SYSTEMS RESEARCH
Airline Supply Terminology Flight Leg (or “flight sector” or “flight segment”)– Non‐stop operation of an aircraft between A and B, withassociated departure and arrival times Flight– One or more flight legs operated consecutively by a singleaircraft (usually) and labeled with a single flight number(usually) Route– Consecutive links in a network served by single flight numbers Passenger Paths or Itineraries– Combination of flight legs chosen by passengers in a O‐D marketto complete a journey16CENTER FOR AIR TRANSPORTATION SYSTEMS RESEARCH
Airline Markets The purpose of each air trip is to move fromthe “true” origin to the “true” destination ofthe passenger. There is typically an outbound and inboundportion of passenger air trips.– In the Air Transportation System Typically Arrival Departures Direct/ Connecting Flights17CENTER FOR AIR TRANSPORTATION SYSTEMS RESEARCH
Distinct and Separate Origin – Destination MarketsFigure 3.2Catchment AreaAirport ATrip OriginCatchment AreaAirport BAir Services A to BAir Services B to AAirport BAirport ATripDestinationAir ServicesA to CAir ServicesC to AAirport CCatchment AreaAirport CTripDestination Catchment Area – an area which contains all the origin points of travelers An airport’s catchment area can extend for hundreds of kilometers and can vary with thedestination and trip purpose of the traveler The market for air services from A to C is distinct and separate from the market from C18 to ACENTER FOR AIR TRANSPORTATION SYSTEMS RESEARCH
Air Travel Markets Opposite Markets – passengers who originate their trips from thedestination airport region. Parallel Markets – the flight operations serving each parallelmarket can to some extent substitute for each other City‐Pair Markets – Demand for air travel between two cities Region‐Pair Markets – Demand for air travel between two regionsor metropolitan areas Airport‐Pair Markets “Parallel” – City‐Pair and Region‐Pair MarketsDemand can be disaggregated to different airports serving thecities or regions¾ With the existence of overlapping airport regions, parallel markets,and the sharing of scheduled airline supply on connecting flights,even “distinct” and “separate” origin‐destination markets areinterrelated19CENTER FOR AIR TRANSPORTATION SYSTEMS RESEARCH
Connecting versus Direct Traffic1st Leg2nd tProcessingGroundEgressGroundEgress20CENTER FOR AIR TRANSPORTATION SYSTEMS RESEARCH
Airline Markets ExampleMarketItinerarySegment/ LegAirlineSeatsPAXConnecting �BOSIAD‐BOSIAD‐BOSAirline Airline 1150100752575%.674IAD‐PHL‐BOSPHL‐BOSAirline 110075N/A75N/A.754IAD‐JFK‐BOSIAD‐JFKAirline 22001505010050%.752IAD‐JFK‐BOSJFK‐BOSAirline e SAirline 2200100257550%.51IAD‐BOS‐PITBOS‐PITAirline 215075N/A75N/A.51IAD‐BOS¾ For this example no additional passengers are boarding at the connection Frequency Share for IAD‐BOS –– Airline 1 2/6 33%,Airline 2 4/6 67% Market Share for IAD‐BOS –– Airline 1 ((2x50) (4x75))/ ((2x50) (4x75) (2x50) (3x75) (1x75)) 50% “Market” O‐D Traffic for IAD‐BOS ((2x50) (4x75) (2x50) (3x75) (1x25)) 750“Segment” or “Leg” O‐D Supply for IAD‐BOS ((2x100) (3x100) (1x200)) 70021CENTER FOR AIR TRANSPORTATION SYSTEMS RESEARCH
Airline Markets ExampleMarketItinerarySegment/ LegAirlineSeatsPAXConnecting �BOSIAD‐BOSIAD‐BOSAirline Airline 1150100752575%.674IAD‐PHL‐BOSPHL‐BOSAirline 110075N/A75N/A.754IAD‐JFK‐BOSIAD‐JFKAirline 22001505010050%.752IAD‐JFK‐BOSJFK‐BOSAirline e SAirline 2200100257550%.51IAD‐BOS‐PITBOS‐PITAirline 215075N/A75N/A.51IAD‐BOS¾ For this example no additional passengers are boarding at the connection RPM (2x50x1) (4x100x1) (4x75x1) (2x150x1) (2x50x1) (3x75x1) (1x100x1) (1x75x1) 1600 ASM (2x100x1) (4x150x1) (4x100x1) (2x200x1) (2x100x1) (3x100x1) (1x200x1) (1x150x1) 2450ALLF for IAD‐BOS (2x.5) (3x.75) (1x.5)/6 .625ALF for this network – for this example all flight legs are 1 unit of distance RPM/ASM 1600/2450 .65322CENTER FOR AIR TRANSPORTATION SYSTEMS RESEARCH
Illustration of Direct versus Connecting PassengersTop O‐D Markets by VolumeCENTER FOR AIR TRANSPORTATION SYSTEMS RESEARCH23
Origin‐Destination Market Demand Air travel demand is defined for an origin‐destinationmarket, not a flight leg in an airline network– Number of persons wishing to travel from origin A todestination B during a given time period– Includes both passengers starting their trip at A and thosecompleting their travel by returning home (opposite markets)– Typically, volume of travel measured in one‐way passenger tripsbetween A and B, perhaps summed over both directions Airline networks create complications for analysis ofmarket demand and supply– Not all A‐B passengers will fly on non‐stop flights from A to B, assome will choose one‐stop or connecting paths– Any single non‐stop flight leg A‐B can also serve many other O‐Dmarkets, as part of connecting or multiple‐stop paths24CENTER FOR AIR TRANSPORTATION SYSTEMS RESEARCH
Dichotomy of Demand and Supply Inherent inability to directly compare demand and supplyat the “market” level Demand is generated by O‐D market, while supply isprovided as a set of flight leg departures over a network ofoperations One flight leg provides joint supply of seats to many O‐Dmarkets– Number of seats on the flight is not the “supply” to a single market– Not possible (or realistic) to determine supply of seats to each O‐D Single O‐D market served by many competing airline paths– Tabulation of total O‐D market traffic requires detailed ticket couponanalysis25CENTER FOR AIR TRANSPORTATION SYSTEMS RESEARCH
Implications for Analysis Dichotomy of airline demand and supply complicates many facetsof airline economic analysis Difficult, in theory, to answer seemingly “simple” economicquestions, for example:– Because we cannot quantify “supply” to an individual O‐D market, wecannot determine if the market is in “equilibrium”– Cannot determine if the airline’s service to that O‐D market is“profitable”, or whether fares are “too high” or “too low”– Serious difficulties in proving predatory pricing against low‐fare newentrants, given joint supply of seats to multiple O‐D markets andinability to isolate costs of serving each O‐D market In practice, assumptions about cost and revenue allocation arerequired:– Estimates of flight and/or route profitability are open to question26CENTER FOR AIR TRANSPORTATION SYSTEMS RESEARCH
Demand Models Demand models are mathematical representations of therelationship between demand and explanatory variables:– Based on our assumptions of what affects air travel demand– Can be linear (additive) models or non‐linear (multiplicative)– Model specification reflects expectations of demand behavior(e.g., when prices rise, demand should decrease) A properly estimated demand model allows airlines tomore accurately forecast demand in an O‐D market:– As a function of changes in average fares– Given recent or planned changes to frequency of service– To account for changes in market or economic conditions27CENTER FOR AIR TRANSPORTATION SYSTEMS RESEARCH
Airline Demand Demand for carrier flight f of carrier i in OD market j is a functionof:– Characteristics of flight f Departure time, travel time, expected delay, aircraft type, in‐flight service, etc. Price– Characteristics of carrier i Flight schedule in market j (frequency, timetable), airport amenities of carrier,frequent flyer plan attractiveness, etc.– Market characteristics Distance, business travel between two cities, tourism appeal– Characteristics (including price) of all rival products: Other flights on carrier i Flights on other carriers in market j (carrier and flight characteristics) Competing markets’ products (other airports serving city‐pair in j, othertransport modes, etc.)28CENTER FOR AIR TRANSPORTATION SYSTEMS RESEARCH
Total Trip Time from Point A to B Next to price of air travel, most important factor affecting demandfor airline services:––––Access and egress times to/from airports at origin and destinationPre‐departure and post‐arrival processing times at each airportActual flight times plus connecting times between flightsSchedule displacement or wait times due to inadequate frequency Total trip time captures impacts of flight frequency, path qualityrelative to other carriers, other modes.– Reduction in total trip time should lead to increase in total air traveldemand in O‐D market– Increased frequency and non‐stop flights reduce total trip time– Increases in total trip time will lead to reduced demand for air travel,either to alternative modes or the “no travel” option29CENTER FOR AIR TRANSPORTATION SYSTEMS RESEARCH
Total Trip Time and Frequency T t(fixed) t(flight) t(schedule displacement)– Fixed time elements include access and egress, airport processing– Flight time includes aircraft “block” times plus connecting times– Schedule displacement (K hours / frequency), meaning it decreaseswith increases in frequency of departures This model is useful in explaining why:– Non‐stop flights are preferred to connections (lower flight times)– More frequent service increases travel demand (lower scheduledisplacement times)– Frequency is more important in short‐haul markets (scheduledisplacement is a much larger proportion of total T)– Many connecting departures through a hub might be better than 1non‐stop per day (lower total T for the average passenger)30CENTER FOR AIR TRANSPORTATION SYSTEMS RESEARCH
Total Trip Time Example With Uniform Passenger DemandFlight times highlighted in Yellowwait times1 flight2 flights3 flights4 flights0600 0700 0800 0900 100010 987643210321012101211005121120042201300 1400 1500 1600 1700 1800 1900 2000 2100 2200 2101210121.06Increased Frequency reduces Passenger Total Trip Time and Increases Demand31CENTER FOR AIR TRANSPORTATION SYSTEMS RESEARCH
Simple Market Demand Function Multiplicative model of demand for travel O‐D perperiod:D M x P a x Tbwhere:M market sizing parameter (constant) that representsunderlying population and interaction between citiesP average price of air travelT total trip time, reflecting changes in frequencya,b price and time elasticities of demand We can estimate values of M, a, and b from historicaldata sample of D, P, and T for same market:– Previous observations of demand levels (D) underdifferent combinations of price (P) and total travel time (T)32CENTER FOR AIR TRANSPORTATION SYSTEMS RESEARCH
Multiple Demand SegmentsBusiness Personal AirAir TravelTravelDemandDemandFirst ClassDfbDfpCoach ClassDcbDcpDiscount ClassDdbDdp33CENTER FOR AIR TRANSPORTATION SYSTEMS RESEARCH
Airline Competition Airlines compete for passengers and market share basedon:– Frequency of service and departure schedule on each routeserved– Price charged, relative to other airlines, to the extent thatregulation allows for price competition– Quality of service and products offered ‐‐airport and in‐flightservice amenities and/or restrictions on discount fare products Passengers choose combination of flight schedules, pricesand product quality that minimizes disutility of air travel:– Each passenger would like to have the best service on a flightthat departs at the most convenient time, for the lowest price34CENTER FOR AIR TRANSPORTATION SYSTEMS RESEARCH
Market Share / Frequency Share Rule of Thumb: With all else equal, airline marketshares will approximately equal their frequency shares. But there is much empirical evidence of an “S‐curve”relationship as shown on the following slide:– Higher frequency shares are associated withdisproportionately higher market shares– An airline with more frequency captures all passengerswishing to fly during periods when only it offers a flight,and shares the demand wishing to depart at times whenboth airlines offer flights– Thus, there is a tendency for competing airlines to matchflight frequencies in many non‐stop markets, to retainmarket share35CENTER FOR AIR TRANSPORTATION SYSTEMS RESEARCH
MS vs. FS “S‐Curve”Model36CENTER FOR AIR TRANSPORTATION SYSTEMS RESEARCH
S‐Curve Model Formulation37CENTER FOR AIR TRANSPORTATION SYSTEMS RESEARCH
Airline Prices and O‐D Markets Like air travel demand, airline fares are defined for an O‐Dmarket, not for an airline flight leg:– Airline prices for travel A‐B depend on O‐D market demand,supply and competitive characteristics in that market– No economic theoretical reason for prices in market A‐B to berelated to prices A‐C, based strictly on distance traveled– Could be that price A‐C is actually lower than price A‐B– These are different markets with different demandcharacteristics, which might just happen to share joint supply ona flight leg Dichotomy of airline demand and supply makes finding anequilibrium between prices and distances more difficult.38CENTER FOR AIR TRANSPORTATION SYSTEMS RESEARCH
Price Elasticity of Demand Definition: Percent change in total demand that occurswith a 1% increase in average price charged. Price elasticity of demand is always negative:– A 10% price increase will cause an X% demand decrease, all elsebeing equal (e.g., no change to frequency or market variables)– Business air travel demand is slightly “inelastic”(0 Ep ‐1.0)– Leisure demand for air travel is much more “elastic”(Ep ‐1.0)– Empirical studies have shown typical range of airline marketprice elasticities from ‐0.8 to ‐2.0 (air travel demand tends to beelastic)– Elasticity of demand in specific O‐D markets will depend on mixof business and leisure travel39CENTER FOR AIR TRANSPORTATION SYSTEMS RESEARCH
Implications for Airline Pricing Inelastic (‐0.8) business demand for air travel means lesssensitivity to price changes:– 10% price increase leads to only 8% demand reduction– Total airline revenues increase, despite price increase Elastic (‐1.6) leisure demand for air travel means greatersensitivity to price changes– 10% price increase causes a 16% demand decrease– Total revenues decrease given price increase, and vice versa Recent airline pricing practices are explained by priceelasticities:– Increase fares for inelastic business travelers to increaserevenues– Decrease fares for elastic leisure travelers to increase revenues40CENTER FOR AIR TRANSPORTATION SYSTEMS RESEARCH
Time Elasticity of Demand Definition: Percent change in total O‐D demand that occurswith a 1% increase in total trip time. Time elasticity of demand is also negative:– A 10% increase in total trip time will cause an X% demanddecrease, all else being equal (e.g., no change in prices)– Business air travel demand is more time elastic (Et ‐1.0), asdemand can be stimulated by improving travel convenience– Leisure demand is time inelastic (Et ‐1.0), as price sensitivevacationers are willing to endure less convenient flight times– Empirical studies show narrower range of airline market timeelasticities from ‐0.8 to ‐1.6, affected by existing frequency41CENTER FOR AIR TRANSPORTATION SYSTEMS RESEARCH
Implications of Time Elasticity Business demand responds more than leisure demand toreductions in total travel time:– Increased frequency of departures is most important way for anairline to reduce total travel time in the short run– Reduced flight times can also have an impact (e.g., using jet vs.propeller aircraft)– More non‐stop vs. connecting flights will also reduce T Leisure demand not nearly as time sensitive:– Frequency and path quality not as important as price But there exists a “saturation frequency”in each market:– Point at which additional frequency does not increase demand42CENTER FOR AIR TRANSPORTATION SYSTEMS RESEARCH
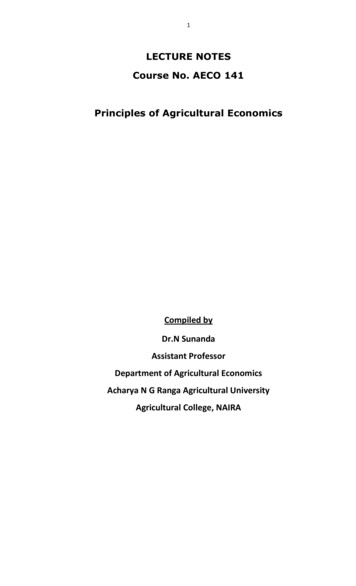
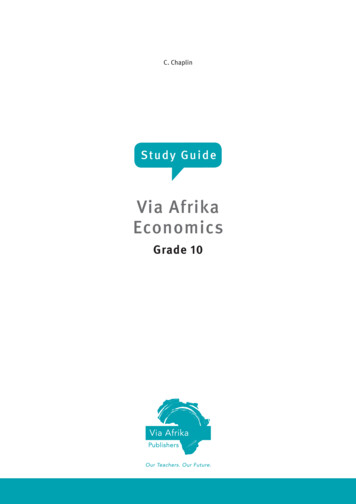
enger Demand12001000800Passenger Demand1000800Passenger Demand1200400CENTER FOR AIR TRANSPORTATION SYSTEMS Passenger DemandExamples of Price ElasticitySource: BTS2000EWR‐ORD (BTS 2008 2QTR)EWR‐PIT (BTS 2008 Passenger FarePassenger FareEWR‐BOS (BTS 2008 2QTR)1600EWR‐SFO (BTS 2008 nger FarePassenger Fare43
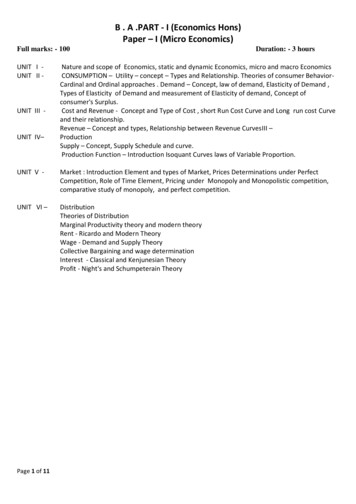
Air Travel Demand SegmentsPassenger:Price SensitivityLowHighHighType 1Type 2Type 3Type 4Passenger:TimeSensitivityLow44CENTER FOR AIR TRANSPORTATION SYSTEMS RESEARCH
Different Types of Passengers Type 1 – Time sensitive and insensitive to Price– Business Travelers, who might be willing to pay premium price forextra amenities– Travel flexibility and last minute seat availability extremely important Type 2 – Time sensitive and Price sensitive– Some Business Travelers, must make trip, but are flexible to securereduced fare– Cannot book far enough in advance for lowest fares Type 3 – Price sensitive and insensitive to Time– Classic Leisure or vacation travelers, willing to change time and day oftravel and airport to find seat at lowest possible fare– Willing to make connections Type 4 – Insensitive to both Time and Price– Few passengers who are willing to pay for high levels of service.– Can be combined with Type 145CENTER FOR AIR TRANSPORTATION SYSTEMS RESEARCH
Airline Economics Chapter 3 . ¾Focus of this lesson is on Passenger Traffic. . - RPM Revenue Passenger Mile One paying passenger transported 1 mile - Yield Revenue per RPM Average fare paid by passengers, per mile flown - PDEW Passenger trips per day each way A common way to measure O‐D market demand .