Transcription
Wealth DiscretionaryActive Asset Allocation(A3) PortfolioNewsletter October 2019Newsletter updated as of October 2019For Professional and Accredited Investors in Hong Kong andSingapore respectively. For investors outside of the U.S., Japanand the European Economic Area (“EEA”). This material isprovided to addressee only, further distribution of this material isstrictly prohibited.
Wealth DiscretionaryActive Asset Allocation (A3) PortfolioAt a GlanceOverviewRisks A3 aims to outperform its benchmarks through anactive asset allocation process, based on the views ofour Wealth Management Multi Asset InvestmentCommittee (MIC), and also through individualinvestments selected for their potential to deliverabove-market returns Market risk - The investment’s value could fall sharply, if there is increased correlation betweenasset classes during periods of market stress It draws on Deutsche Bank Wealth Management’sbest thinking and investment process through aregulated (UCITS), transparent, liquid and fullydiversified discretionary mandate Interest rate risk. Increasing bond yields could cause significant price losses Credit risk. Sovereign and corporate bonds can be subject to issuer default or debt restructuring.Equities can also be subject to distress Currency exchange risk. Appreciation of the base currency could adversely affect the value offoreign earnings translated back to the base currency It is designed for investors with a 3 to 5-year timehorizon whose primary aims include preservation ofcapital, maintenance of purchasing power and growthof wealth in real terms Counterparty risk. A counterparty may fail to meet its obligations and thereby reduce the value ofthe investment A3 is available in EUR/USD/GBP in four risk profiles:Conservative, Core, Growth and Dynamic Growth Higher than expected levels of volatility are possible over short periods of time A3 is also offered in CHF in the Conservative and Coreprofiles; Growth profile is available upon request Mark-to-market risks (real estate), due to the gearing of the targeted Swiss real estate funds andcompanies Negative performance. The value of the fund could fall below the value of the initial investmentFull product details are given on page 10.Deutsche BankWealth ManagementNo assurance can be given that any investment objective or forecast or target can be achieved. Forecasts are based on assumptions, estimates, opinions andhypothetical models which may prove to be incorrect. Past performance is not indicative of future returns. Investments come with risk and the value of an investmentcan fall as well as rise and you might not get back the amount originally invested at any point in time. The product descriptions are for information purpose onlyinstead of invitation for investment. Investors may wish to consult their independent financial advisers. Please refer to the respective investment offering documents;the Important Information/Risk Warning at the end of the presentation for further details.2
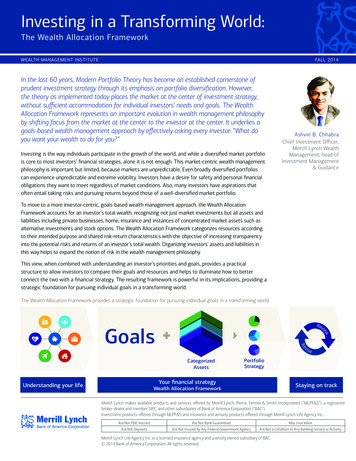
Wealth DiscretionaryPerformance & BenchmarksUSD ConservativeMonthly and Calendar YearPerformance (%)2014201520162017Year-on-Year Performance (%)201820192.58Jan-0.33 1.10-1.97 0.571.28Feb1.241.020.881.33-1.13 1.47Mar-0.65 -0.181.270.30-0.98 0.96Apr0.160.280.610.56-0.16 0.80May0.94-0.24 -0.15 0.670.15Jun0.47-1.100.230.01-0.62 390.520.79Sep-0.66 -1.310.130.52-0.18 0.09Oct-0.18 2.31-0.83 0.76-2.44 0.37Nov1.27Dec-0.29 -0.74Full calendar year2.65 -0.61 1.52-0.21 -0.92 0.360.550.36-0.400.722.337.12-2.67 rpe5% Cash JPM 1M deposit; 12.5% S&P 500; 3.5%Benchmark1Source:Oct 2018 - Oct 20198.999.75-0.76Oct 2017 - Oct 2018-1.88-1.47-0.41Oct 2016 - Oct 20175.696.04-0.36Oct 2015 - Oct 20160.951.82-0.88Oct 2014 - Oct 20151.321.94-0.61120Benchmark (4)A3 ConservativeNew Benchmark115110105-1.280.97Ratio3Fund Benchmark Outperformance6.85 -3.13 9.62Full calendar year BM 2.84Volatility2Performance of Fund1 vs. BenchmarkOver the Past Five YearsEurostoxx 50; 1.5% Topix; 2.5% MSCI EmergingMarkets; 38% JPM US 1-10Y TR Index; 23%iBoxx USD Corporates TR Index; 4% BarCap USHigh Yield Index; 3% JPM EMBI GlobalComposite; 5% HFRX Global Hedge Fund Index;2% Bloomberg Commodities Ex-Agriculture andLivestockYear of inception SICAV format: 2009;Year of inception strategy: 1995 (segregated accounts)² Average of monthly standard deviations rolling over the past 12 months.³ Calculated on a monthly basis rolling over the past 12 months. The risk-freeinterest rate is (here: USD 3 months LIBOR).1009510/1410/1510/1610/1710/1810/19Deutsche Bank Wealth Management. As of 31 October 2019 . (class Wealth Discretionary: ISIN LU0327312368, https://www.fundsquare.net/homepage). Performance shown gross of fees.is (here: 1M USD JP Morgan Cash Index)2Average of monthly standard deviations rolling over the past 12 months. 3Calculated on a monthly basis rolling over the past 12 months. The risk-free interest rate4Benchmark until 31.12.2016 was: 20% Fed fund effective rate, 60% JPMorgan US Government Bond Index 1 to 10 years, 12% S&P 100, 8% MSCI World ex USProducts denominated in a currency, other than the investor’s home currency, will be subject to changes in exchange rates, which may have an adverse effect on the value, price or income return of theproductsDeutsche BankWealth ManagementNo assurance can be given that any investment objective or forecast or target can be achieved. Forecasts are based on assumptions, estimates, opinions andhypothetical models which may prove to be incorrect. Past performance is not indicative of future returns. Investments come with risk and the value of an investmentcan fall as well as rise and you might not get back the amount originally invested at any point in time. The product descriptions are for information purpose onlyinstead of invitation for investment. Investors may wish to consult their independent financial advisers. Please refer to the respective investment offering documents;the Important Information/Risk Warning at the end of the presentation for further details.3
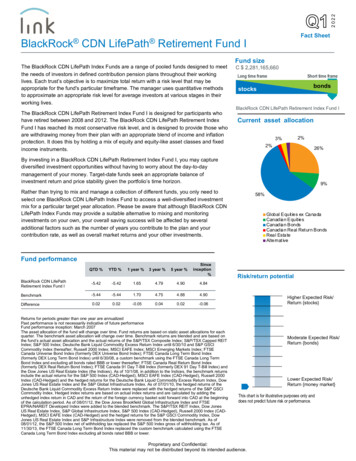
Wealth DiscretionaryCurrent Portfolio HoldingsUSD Conservative23432012.5100%MAG Fixed Income USD Sovereigns16.37DB Fixed Income Opportunity fund11.10iShares Barclays Treasury 7-10Y ETF10.7790%80%70%60%50%iShares USD Corporate Bonds ETF9.41Xtrackers II USD Emerging Markets BondUCITS ETF5.5340%30%Benchmark Allocation56838Broad Asset Allocation (%)Top Five Portfolio Holdings .021.951.953.781.782.00Benchmark06-10CashTotal of Fixed IncomeFixed Income - SovereignMAG Fixed Income USD SovereignsiShares Barclays Treasury 7-10Y ETFMAG Short Term Fixed Income USD SovereignsiShares USD Treasury Bond 3-7 Yr ETFFixed Income - CorporatesiShares USD Corporate Bonds ETFDB Fixed Income Opportunity fundPIG - preferred securitiesFixed Income - High Yield CorporateSky harbor US Short Duration High YieldFixed Income - ConvertiblesSPDR Global Convertible Bond USDFixed Income - EmergingXtrackers II USD Emerging Markets Bond UCITS ETFDWS Invest Asian BondTotal of EquitiesNorth America - Equitiesdb x-trackers S&P 500 UCITS ETFi-Shares USA SRIdb x-trackers MSCI USA UCITS ETFGIS US equitiesi-Shs Edge S&P 500 Minimum VolatilityEurope - Equitiesdb x-trackers Eurostoxx 50 TRi-Shs MSCI Europe Value FactorOption or warrant ESTX50 -EUR 3150 -Dec 2019UK - EquitiesVanguard FTSE 250Japan - Equitiesdb x-trackers MSCI JapanEmerging Markets - EquitiesVontobel Emerging MarketTotal of Alternative InvestmentsHedge FundsInfrastructureDeutsche Invest Global InfrastructureAbsolute returnBarrier Reverse Conv (NKY-SPX-SX5E) - 20.5.2020Commoditiesdb-x-trackers Physical Gold ETCComStage Commodity ex-AgricultureTop Five Portfolio Holdings (%)% of total01.52.5750Cash 4.15%Equities 17.51%Fixed Income 71.59%Alternative Investments 6.75%02Source: Deutsche Bank Wealth Management. As of 31 October 2019 . Allocations are subject to change without notice. Totals may not equal 100% because of roundingDeutsche BankWealth Management10-19Portfolio Holdings (%)Holdings as per MIC divisionNo assurance can be given that any investment objective or forecast or target can be achieved. Forecasts are based on assumptions, estimates, opinions andhypothetical models which may prove to be incorrect. Past performance is not indicative of future returns. Investments come with risk and the value of an investmentcan fall as well as rise and you might not get back the amount originally invested at any point in time. The product descriptions are for information purpose onlyinstead of invitation for investment. Investors may wish to consult their independent financial advisers. Please refer to the respective investment offering documents;the Important Information/Risk Warning at the end of the presentation for further details.4
Wealth DiscretionaryPerformance & BenchmarksUSD CoreMonthly and Calendar YearPerformance (%)Year-on-Year Performance 804.10FebMarAprMayJunJulAugSepOctNovDecFull calendar yearFull calendar year BMVolatility2Sharpe 32.821.05-0.130.760.85Benchmark13.2212.235% Cash JPM 1M deposit; 25% S&P 500; 7%Eurostoxx 50; 3% Topix; 5% MSCI Emerging Markets;26% JPM US 1-10Y TR Index; 15% iBoxx USDCorporates TR Index; 4% BarCap US High YieldIndex; 3% JPM EMBI Global Composite; 5% HFRXGlobal Hedge Fund Index; 2% BloombergCommodities Ex-Agriculture and LivestockFundPerformance of Fund1 vs. BenchmarkOver the Past Five YearsBenchmark Outperformance130Oct 2018 - Oct 201910.939.980.95Benchmark (4)A3 CoreNew Benchmark125Oct 2017 - Oct 2018-2.44-1.43-1.00Oct 2016 - Oct 201710.0410.32-0.28120115110Oct 2015 - Oct 20160.361.64-1.28Oct 2014 - Oct 20152.702.070.63Year of inception SICAV format: 2009;Year of inception strategy: 1989 (segregated accounts)2 Average of monthly standard deviations rolling over the past 12 months3 Calculated on a monthly basis rolling over the past 12 months. The risk-freeinterest rate is (here: USD 3 months LIBOR)1051009510/1410/151Source: Deutsche Bank Wealth Management. As of 31 October 2019 . (class Wealth Discretionary: ISIN LU0327312798, https://www.fundsquare.net/homepage).2Average of monthly standard deviations rolling over the past 12 months. 3Calculated on a monthly basis rolling over the past 12 months. The risk-free interest rate10/1610/1710/1810/19Performance shown gross of feesis (here: 1M USD JP Morgan Cash Index)4Benchmarkuntil 31.12.2016 was: 20% Fed fund effective rate, 40% JPMorgan US Government Bond Index 1 to 10 years, 24% S&P 100, 16% MSCI World ex USProducts denominated in a currency, other than the investor’s home currency, will be subject to changes in exchange rates, which may have an adverse effect on the value, price or income return of theproductsDeutsche BankWealth ManagementNo assurance can be given that any investment objective or forecast or target can be achieved. Forecasts are based on assumptions, estimates, opinions andhypothetical models which may prove to be incorrect. Past performance is not indicative of future returns. Investments come with risk and the value of an investmentcan fall as well as rise and you might not get back the amount originally invested at any point in time. The product descriptions are for information purpose onlyinstead of invitation for investment. Investors may wish to consult their independent financial advisers. Please refer to the respective investment offering documents;the Important Information/Risk Warning at the end of the presentation for further details.5
Wealth DiscretionaryCurrent Portfolio HoldingsUSD Core1543100%db x-trackers MSCI USA UCITS ETF8.40db x-trackers S&P 500 UCITS ETF8.21iShares USD Corporate Bonds ETF7.51MAG Fixed Income USD Sovereigns6.9960%Xtrackers II USD Emerging Markets BondUCITS ETF5.5950%90%80%70%40%Benchmark 60.777.230.001.521.521.941.943.771.781.98Broad Asset Allocation (%)Top Five Portfolio Holdings (%)06/10CashTotal of Fixed IncomeFixed Income - SovereignMAG Fixed Income USD SovereignsiShares USD Treasury Bond 3-7 Yr ETFiShares Barclays Treasury 7-10Y ETFMAG Short Term Fixed Income USD SovereignsFixed Income - CorporatesDB Fixed Income Opportunity fundiShares USD Corporate Bonds ETFPIG - preferred securitiesFixed Income - High Yield CorporateSky harbor US Short Duration High YieldFixed Income - ConvertiblesSPDR Global Convertible Bond USDFixed Income - EmergingXtrackers II USD Emerging Markets Bond UCITS ETFDWS Invest Asian BondTotal of EquitiesNorth America - Equitiesdb x-trackers MSCI USA UCITS ETFdb x-trackers S&P 500 UCITS ETFi-Shares USA SRIGIS US equitiesi-Shs Edge S&P 500 Minimum VolatilityEurope - Equitiesdb x-trackers Eurostoxx 50 TRi-Shs MSCI Europe Value FactorOption or warrant ESTX50 -EUR 3150 -Dec 2019UK – EquitiesVanguard FTSE 250Japan – Equitiesdb x-trackers MSCI JapanEmerging Markets – EquitiesVontobel Emerging MarketiShares Core MSCI Emerging Markets IMITotal of Alternative InvestmentsHedge FundsInfrastructureDeutsche Invest Global InfrastructureAbsolute returnBarrier Reverse Conv (NKY-SPX-SX5E) - 20.5.2020Commoditiesdb-x-trackers Physical Gold ETCComStage Commodity ex-AgricultureTop Five Portfolio Holdings (%)% of total Benchmark035Cash 4.01%Equities 37.72%Fixed Income 51.05%Alternative Investments 7.23%75002Source: Deutsche Bank Wealth Management. As of 31October 2019 . Allocations are subject to change without notice. Totals may not equal 100% because of roundingDeutsche BankWealth Management10/19Portfolio Holdings (%)Holdings as per MIC divisionNo assurance can be given that any investment objective or forecast or target can be achieved. Forecasts are based on assumptions, estimates, opinions andhypothetical models which may prove to be incorrect. Past performance is not indicative of future returns. Investments come with risk and the value of an investmentcan fall as well as rise and you might not get back the amount originally invested at any point in time. The product descriptions are for information purpose onlyinstead of invitation for investment. Investors may wish to consult their independent financial advisers. Please refer to the respective investment offering documents;the Important Information/Risk Warning at the end of the presentation for further details.6
Wealth DiscretionaryPerformance & BenchmarksUSD GrowthMonthly and Calendar YearPerformance (%)Year-on-Year Performance 155.49FebMarAprMayJunJulAugSepOctNovDecFull calendar yearFull calendar year BMVolatility2Sharpe -0.822.90-0.424.153.795.140.783.59 1.17 2.37 -1.79-0.54 3.63 1.18 -3.081.02 1.29 0.99 0.720.25 -0.09 1.32 -0.09-1.57 -1.36 0.04 -1.48-0.21 2.95 1.65 2.78-3.67 0.84 0.08 0.94-3.80 0.12 1.60 -0.056.40 -1.14 1.82 -6.510.10 0.16 0.84 2.03-1.06 1.52 0.86 -5.340.12 2.44 14.60 -7.980.52 4.88 14.56 -6.679.73 8.77 2.34 11.02-0.01 0.22 5.78 -0.733.040.572.75-2.733.391.39-0.961.391.26Fund5% Cash JPM 1M deposit; 37.5% S&P 500; 10.5%Eurostoxx 50; 4.5% Topix; 7.5% MSCI EmergingMarkets; 15% JPM US 1-10Y TR Index; 6% iBoxxUSD Corporates TR Index; 4% BarCap US HighYield Index; 3% JPM EMBI Global Composite; 5%HFRX Global Hedge Fund Index; 2% BloombergCommodities Ex-Agriculture and LivestockBenchmark Outperformance140Oct 2018 - Oct 201912.4810.062.42Benchmark (4)A3 GrowthNew Benchmark130Oct 2017 - Oct 2018-3.09-1.44-1.65120Oct 2016 - Oct 201714.5814.69-0.11110Oct 2015 - Oct 201616.4714.10Performance of Fund1 vs. BenchmarkOver the Past Five Years-0.241.40-1.64100Oct 2014 - Oct 20153.602.101.50Year of inception SICAV format: 2009;Year of inception strategy: 1995 (segregated accounts)² Average of monthly standard deviations rolling over the past 12 months.³ Calculated on a monthly basis rolling over the past 12 months. The risk-freeinterest rate is (here: USD 3 months LIBOR).9010/1410/1510/1610/1710/1810/19Source: Deutsche Bank Wealth Management. As of 31 October 2019 . (class Wealth Discretionary: ISIN LU0327313176, https://www.fundsquare.net/homepage). Performance shown gross of fees.2Average of monthly standard deviations rolling over the past 12 months. 3Calculated on a monthly basis rolling over the past 12 months. The risk-free interest rate is (here: 1M USD JP Morgan Cash Index)4Benchmark until 31.12.2016 was: 20% Fed fund effective rate, 20% JPMorgan US Government Bond Index 1 to 10 years, 36% S&P 100, 24% MSCI World ex USProducts denominated in a currency, other than the investor’s home currency, will be subject to changes in exchange rates, which may have an adverse effect on the value, price or income return of theproductsDeutsche BankWealth ManagementNo assurance can be given that any investment objective or forecast or target can be achieved. Forecasts are based on assumptions, estimates, opinions andhypothetical models which may prove to be incorrect. Past performance is not indicative of future returns. Investments come with risk and the value of an investmentcan fall as well as rise and you might not get back the amount originally invested at any point in time. The product descriptions are for information purpose onlyinstead of invitation for investment. Investors may wish to consult their independent financial advisers. Please refer to the respective investment offering documents;the Important Information/Risk Warning at the end of the presentation for further details.7
Wealth DiscretionaryCurrent Portfolio HoldingsUSD GrowthPortfolio Holdings (%)% of total BenchmarkTop Five Portfolio Holdings (%)52815db x-trackers MSCI USA UCITS ETF13.296db x-trackers S&P 500 UCITS ETF11.94100%90%80%70%6037.57.32iShares USD Corporate Bonds ETF5.48Xtrackers II USD Emerging Markets BondUCITS ETF60%50%40%4.7930%Benchmark Allocation3db x-trackers Eurostoxx 50 ve Investments 7.70%Fixed Income 29.53%Equities 56.04%Cash 6.73%75002Source: Deutsche Bank Wealth Management. As of 31 October 2019 . Allocations are subject to change without notice. Totals may not equal 100% because of roundingDeutsche BankWealth ManagementNo assurance can be given that any investment objective or forecast or target can be achieved. Forecasts are based on assumptions, estimates, opinions andhypothetical models which may prove to be incorrect. Past performance is not indicative of future returns. Investments come with risk and the value of an investmentcan fall as well as rise and you might not get back the amount originally invested at any point in time. The product descriptions are for information purpose onlyinstead of invitation for investment. Investors may wish to consult their independent financial advisers. Please refer to the respective investment offering documents;the Important Information/Risk Warning at the end of the presentation for further ad Asset Allocation (%)06/10Holdings as per MIC divisionCashTotal of Fixed IncomeFixed Income - SovereigniShares USD Treasury Bond 3-7 Yr ETFiShares Barclays Treasury 1-3Y ETFFixed Income - CorporatesDB Fixed Income Opportunity fundiShares USD Corporate Bonds ETFPIG - preferred securitiesFixed Income - High Yield CorporateSky harbor US Short Duration High YieldFixed Income - ConvertiblesSPDR Global Convertible Bond USDFixed Income - EmergingXtrackers II USD Emerging Markets Bond UCITS ETFDWS Invest Asian BondTotal of EquitiesNorth America - Equitiesdb x-trackers MSCI USA UCITS ETFdb x-trackers S&P 500 UCITS ETFGIS US equitiesi-Shares USA SRIi-Shs Edge S&P 500 Minimum VolatilityEurope - Equitiesdb x-trackers Eurostoxx 50 TRi-Shs MSCI Europe Value FactorOption or warrant ESTX50 -EUR 3150 -Dec 2019UK - EquitiesVanguard FTSE 250Japan - Equitiesdb x-trackers MSCI JapanEmerging Markets - EquitiesiShares Core MSCI Emerging Markets IMIVontobel Emerging MarketTotal of Alternative InvestmentsHedge FundsInfrastructureDeutsche Invest Global InfrastructureAbsolute returnBarrier Reverse Conv (NKY-SPX-SX5E) - 20.5.2020Commoditiesdb-x-trackers Physical Gold ETCComStage Commodity ex-AgricultureTop Five Portfolio Holdings (%)
Wealth DiscretionaryPortfolio movesMarketsPortfolio Risk appetite returned to markets once again in October as expectationsthat the US and China were edging towards agreeing on “phase one” oftheir trade deal, earnings season broadly bettering expectations, the Fedannouncing that it would resume securities purchases to grow its balancesheet and even the latest twist in Brexit developments all combining to helpto boost sentiment. In FX relatively big moves for the euro ( 2.3%) andsterling ( 5.3%) in particular. Indeed, that move for sterling weighed on UKassets with the FTSE 100 (-1.9%) and Gilts (-1.9%) the two biggestdecliners last month. The other was Bunds (-1.4%), where 10y yieldsedged back to the highest since July at one stage, while Treasuries (0.0%),Spanish Bonds (-0.7%) and BTPs (-0.7%) were flat to slightly negative.The standout was EM bonds ( 2.2%), which had their strongest monthsince January. As for equities, the Nikkei ( 5.4%), EM equities ( 4.2%)and the NASDAQ ( 3.7%) also rallied. The S&P 500 ( 2.2%) also climbedfor a second month, which means the index has risen in 8 of the 10 monthsin 2019 so far. Meanwhile, the move for the euro acted as a bit of aheadwind for European equities with the STOXX 600 returning 1.1% inlocal currency terms, however converted to dollars saw it return 3.4% andthus outperform the S&P 500. Elsewhere, European Banks returned 2.2%in local currency terms and 4.6% in dollars. In terms of credit markets,while spreads tightened slightly in October the impact of highergovernment bond yields hurt total returns in Europe. Indeed, EUR IG NonFin (-0.2%) ended with a small negative return while EUR HY returned 0.1%. US HY did, however, post a small positive return of 0.4% while IGNon-Fin returned 0.5%. For commodity markets last month were by andlarge positive, including moves higher for Silver ( 6.5%), Copper ( 2.3%),Gold ( 2.8%) and WTI Oil ( 0.2%) prices. Despite our cautious stance and all our diversification measures, we can talkabout another positive month for most of our strategies. Yes, we have paid asmall price versus benchmark but indeed not something relevant. Therefore,year to date, we keep our outperformance intact for almost all our portfolios.During the month we have adjusted the risk to the upside. After the Brexitdevelopments by mind October, and the spreads compression we have seenin the IG assets, we decided to switch some positions from IG instruments(where we have massively profited this year) into European equities andmore specifically into a UK FTSE 250 vehicle as we wanted to tactically gainsome exposure to UK domestic. Also worth mentioning that we have openeda position in a Value Equity fund at the expense of a broad index. We believethat the outperformance of the Value segment can continue for sometime.The mentioned moves have reduced our underweight in equities to a moreneutral position. Other than that, we have been reasonably static in ourpositions. We can still see an overweight to EM debt (HC), duration is still atleast at benchmark levels as we feel comfortable with longer maturities giventhe messages from the main developed Central Banks. We also would like toname that, following our strong conviction on ESG investments we haveentered (and this will be a trend in the coming months and years) a positionin a SRI US Equities ETF. Global Infrastructure is still the theme which wehave as a specific sector which we like as a secular trend, and we look at itas a dual role, equities and alternatives offering a good growth profile andstill protective on the downside. Lastly, we continue to hold Gold in theportfolios as a diversification measure which, from a fundamentalperspective, offer a good risk/return profile given that rates will stay low forlonger.Source: Deutsche Bank Wealth Management. As of 31 October 2019This information is intended for informational purposes only and does not constitute investment advice, a recommendation, an offer or solicitation.Deutsche BankWealth ManagementNo assurance can be given that any investment objective or forecast or target can be achieved. Forecasts are based on assumptions, estimates, opinions andhypothetical models which may prove to be incorrect. Past performance is not indicative of future returns. Investments come with risk and the value of an investmentcan fall as well as rise and you might not get back the amount originally invested at any point in time. The product descriptions are for information purpose onlyinstead of invitation for investment. Investors may wish to consult their independent financial advisers. Please refer to the respective investment offering documents;the Important Information/Risk Warning at the end of the presentation for further details.9
Wealth DiscretionaryPortfolio InformationActive Asset Allocation (A3)Wealth Discretionary (A3) Portfolio USDStructureSegregatedLaunch DateUCITS SICAVConservativeCoreGrowthDyn. GrowthJan. 1995Jan 1989Jan 1995Jun 2013EUR:Oct 2001Jan 1999Jan 1999Jun 2013CHF:Jan 2010Jul 2005Jan 1999GBP:Jul 2005Jul 2005Jul 2005233USD:Risk RatingCurrenciesConservativeCoreGrowthUSDApril 2009April 2009April 2009EURNov 2007Nov 2007Jan 2008233USD/EUR/CHF/GBPMinimum InvestmentUSD/EURUSD 500,000Class A: 100,000/Class C and PF: 1 Unit at NAV–Wealth Discretionary (Class A) & Advisory (Class C and PF)Share ClassesISIN CodesClass A–Booking CentersAT, CH*, DE, JSY**, LU, NL, SG, UK, US off.Class CClass 3176LU0327313333LU0794123769Same CurrencyAT, CH, JSY, LU, NL, SG, US off.Class A and C: SG, AT, CH, DE, ES, FI, IT, LU, NO, SE, NL (only EUR)Class PF: SG, CH (Core EUR), DE, FI, IT, LU, NO, SE, NL (only EUR)DailyWeekly on Wednesday ( T) (Cut-off time: 10:30am CET everyTuesday)/NOT transferable outside DBT 4CI. A: see Fee Schedule / CI. C: 2% / CI. PF: 1% Perf Fee (25% Outperf.over Benchmark – max. 1.5% - applies only if perf is positiveCurrency MismatchConservative / Core8575Growth / Dynamic Growth80Registered Countries–NAV Calculation–Liquidity / Transferable outside DBDailySettlement (Value Date)According to individual positionsFee StructureSee Fee ScheduleLending Value in %Distribution PolicyPortfolio Manager / Fund Admin.70AccumulativeDeutsche Bank (Suisse) S.A. / Oppenheim Asset Management Services S.à.r.l.Source: Deutsche Bank Wealth Management** Available upon requestPlease see the relevant Wealth Discretionary fee schedule for more informationDeutsche BankWealth ManagementNo assurance can be given that any investment objective or forecast or target can be achieved. Forecasts are based on assumptions, estimates, opinions andhypothetical models which may prove to be incorrect. Past performance is not indicative of future returns. Investments come with risk and the value of an investmentcan fall as well as rise and you might not get back the amount originally invested at any point in time. The product descriptions are for information purpose onlyinstead of invitation for investment. Investors may wish to consult their independent financial advisers. Please refer to the respective investment offering documents;the Important Information/Risk Warning at the end of the presentation for further details.10
Wealth DiscretionaryDisclaimerDeutsche Bank Wealth Management is the brand name of the Wealth Management business unit of Deutsche Bank Group (collectively referred to as “DB”), offering high net worth clients a broad range oftraditional and alternative investment solutions as well as a holistic service for all aspects of wealth management. Deutsche Bank Aktiengesellschaft is incorporated in the Federal Republic of Germany andits members’ liability is limited.This advertisement has not been reviewed by the Monetary Authority of Singapore, Hong Kong Monetary Authority and Securities and Futures Commission of Hong Kong. As per the Service Agreement Annex 7 Hong Kong Personal Data Notifications and Singapore Privacy Statement - (h) Use of Data in Direct Marketing, where the customer’s personal information is used by DB for direct marketingpurposes, the customer can exercise his/her opt-out right to cease DB from using their information for marketing purposes, by contacting DB in writing.You are advised to exercise caution in relation to the investment contained herein. This document has been prepared without consideration of the investment needs, objectives or financial circumstances ofany investor. Before making an investment decision, you need to consider, with or without the assistance of an investment adviser, as you deem necessary, whether the investments and strategies describedor provided by DB, are appropriate, in light of your particular investment needs, objectives and financial circumstances. F
Source: Deutsche Bank Wealth Management. As of 31 October 2019 . Allocations are subject to change without notice. Totals may not equal 100% because of rounding Top Five Portfolio Holdings (%) Broad Asset Allocation (%) Wealth Discretionary Top Five Portfolio Holdings (%) MAG Fixed Income USD Sovereigns 16.37 DB Fixed Income Opportunity fund 11.10
![[Title to come] DSP Dynamic Asset Allocation Fund](/img/24/dsp-dynamic-asset-allocation-fund.jpg)