Transcription
IntroductionXen and OpenVZ SystemsTestbed ArchitectureExperimental ResultsPerformance Evaluation of VirtualizationTechnologiesSaad ArifDept. of Electrical Engineering and Computer ScienceUniversity of Central Florida - Orlando, FLSeptember 19, 2013Conclusion
Introduction1Xen and OpenVZ SystemsIntroductionTestbed ArchitectureExperimental ResultsConclusion
IntroductionXen and OpenVZ SystemsTestbed Architecture1Introduction2Xen and OpenVZ SystemsExperimental ResultsConclusion
IntroductionXen and OpenVZ SystemsTestbed Architecture1Introduction2Xen and OpenVZ Systems3Testbed ArchitectureExperimental ResultsConclusion
IntroductionXen and OpenVZ SystemsTestbed Architecture1Introduction2Xen and OpenVZ Systems3Testbed Architecture4Experimental ResultsExperimental ResultsConclusion
IntroductionXen and OpenVZ SystemsTestbed Architecture1Introduction2Xen and OpenVZ Systems3Testbed Architecture4Experimental Results5ConclusionExperimental ResultsConclusion
IntroductionXen and OpenVZ SystemsTestbed Architecture1Introduction2Xen and OpenVZ Systems3Testbed Architecture4Experimental Results5ConclusionExperimental ResultsConclusion
IntroductionXen and OpenVZ SystemsTestbed ArchitectureExperimental ResultsWhat we have already covered .Virtualization.Layering and virtualization.Virtual machine monitor.Virtual machine.Performance and security isolation.Architectural support for virtualization.x86 support for virtualization.Full and paravirtualization.Xen 1.0 and Xen 2.0.Performance comparison of virtual machine monitors.The darker side of virtualization.Software fault isolation.Conclusion
IntroductionXen and OpenVZ SystemsTestbed ArchitectureExperimental ResultsOverviewServer consolidationReduces costImproves efficiencyNew challengesChoosing the right virtualization technologyConsolidation configurationPerformance evaluation of two representative virtualizationtechnologiesXen systemOpenVZ systemConclusion
IntroductionXen and OpenVZ SystemsTestbed ArchitectureOverview (contd)Comparison in terms ofApplication performanceResource consumptionScalabilityLow-level system metrics likeCache missesVirtualization-specific metricsExperimental ResultsConclusion
IntroductionXen and OpenVZ SystemsTestbed ArchitectureExperimental ResultsWhat is Virtualization?”The ability to run multipleoperating systems on a singlephysical system and share theunderlying hardware resources”VMware white paper, Virtualization OverviewConclusion
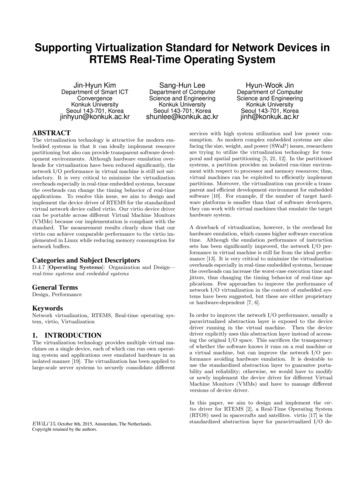
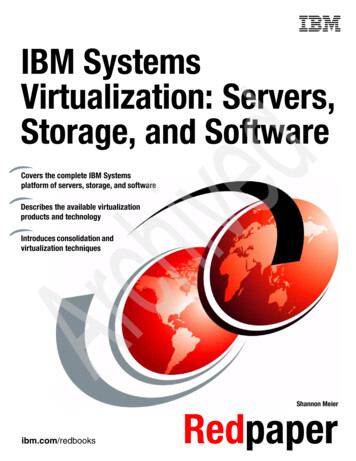
IntroductionXen and OpenVZ SystemsTestbed ArchitectureExperimental ResultsMotivationRapid growth of servers in datacentersHigh maintenence costsEnterprise data centers under-utilizedTypical average utilization 30%Overload under peak demandsResulting inLower application throughputLonger latencySignificant interest in VirtualizationFigure : Example peak/off peakCPU utilizationConclusion
IntroductionXen and OpenVZ SystemsTestbed ArchitectureExperimental ResultsTypes of VirtualizationsHypervisor-based technologyVMwareMicrosoft Virtual ServerXenOperating system (OS) level virtualizationOpenVZLinux VServerSolaris ZonesBoth allow a single physical server to be partitioned into multiple isolated virtualmachines (VMs) for running multiple applications at the same timeEasier centralized server administrationHigher operational efficiencyConclusion
IntroductionXen and OpenVZ SystemsTestbed ArchitectureCapacity ManagementEnterprise applications often haveresource demands that vary overtimeIf consolidated into VMs on a sharedserverDynamic resource allocationMaintained QoSEfficient server resourceutilizationExperimental ResultsConclusion
IntroductionXen and OpenVZ SystemsTestbed Architecture1Introduction2Xen and OpenVZ Systems3Testbed Architecture4Experimental Results5ConclusionExperimental ResultsConclusion
IntroductionXen and OpenVZ SystemsTestbed ArchitectureExperimental ResultsXen SystemParavirtualization technologyLinux basedAllows multiple guest operating systemsProvidesThin software virtualization layer between guest OS and HWPresents hardware abstractionCPU schedulerConclusion
IntroductionXen and OpenVZ SystemsTestbed ArchitectureExperimental ResultsConclusionOpenVZ SystemLinux basedAllows creation of secure, isolated virtual enironments (VEs)Each VEBehaves as a stand-alone serverCan be rebooted independentlyCan be setup with a different distribution with seperate rootdirectorySingle kernel shared by all VEsLow level of fault isolation compared to Xen
IntroductionXen and OpenVZ SystemsTestbed Architecture1Introduction2Xen and OpenVZ Systems3Testbed Architecture4Experimental Results5ConclusionExperimental ResultsConclusion
IntroductionXen and OpenVZ SystemsTestbed ArchitectureExperimental ResultsConclusionPerformance Evaluation CritereonHow is application-level performance, including throughputand response time, impacted?How does application-level performance scale up as workloadincreases?How is application-level performance affected when multipletiers of each application are placed on virtualized servers indifferent ways?As the number of multi-tiered applications increases, how doapplication-level performance and resource consumption scale?
IntroductionXen and OpenVZ SystemsTestbed ArchitectureExperimental ResultsConclusionSetupBase systemVanilla Linux 2.6 kernelXen systemXen 3.0.3OpenVZ sysyemovz-stable-2.6 kernelVirtual MachineOne or more virtual VMs supported by either Xen or OpenVZSensors collectingCPU consumptionMemory consumptionResponse time
IntroductionXen and OpenVZ SystemsSetup (contd)Testbed ArchitectureExperimental ResultsConclusion
IntroductionXen and OpenVZ SystemsTestbed ArchitectureExperimental ResultsOprofileTool to measure hardware eventsRequires hardware performance countersSpecific Counters:CPU CLK UNHALT - number of CPU cycles outside halt stateRETIRED INSTRUCTIONS - number of retired instructionsL2 CACHE MISS - number of L2 cache misses and mainmemory hitsConclusion
IntroductionXen and OpenVZ SystemsTestbed ArchitectureExperimental ResultsConclusionExperiment DesignBenchmarkRUBiS: online auction siteMulti-tiered applicationWeb-tier: runs Apache web server with PHPDB-tier: runs MySQL database serverMultiple clients connect to Web-tierClient sessionsConnectBrowseBuy/sellClient waits for each request completion before starting a newone (closed-loop behaviour)
IntroductionXen and OpenVZ SystemsTestbed ArchitectureExperimental ResultsExperiment Design (contd)Load distribution: browsing mixHigher load on Web-tier than DB-tierGoalQuantitatively evaluate impact of virtualizationEvalualte application-level performance includingThroughputResponse timeConclusion
IntroductionXen and OpenVZ SystemsTestbed ArchitectureExperiment ConfigurationsSingle-node: Both Web and DB tiersin a single nodeTwo-node: Web and DB tiers inseperate nodesTwo-node (scaled): Multipleweb/DB tiers in each nodesExperimental ResultsConclusion
IntroductionXen and OpenVZ SystemsTestbed Architecture1Introduction2Xen and OpenVZ Systems3Testbed Architecture4Experimental Results5ConclusionExperimental ResultsConclusion
IntroductionXen and OpenVZ SystemsTestbed ArchitectureSingle-NodeBoth Web and DB tiers hosted onsingle nodeXen/OpenVZ run two tiers inseperate VM500 - 800 concurrent clientsExperimental ResultsConclusion
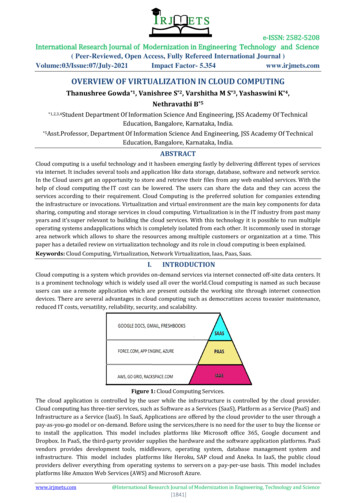
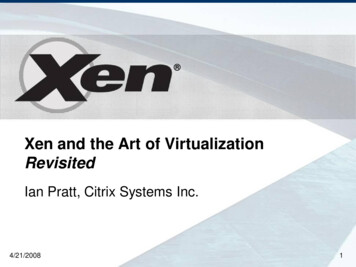
IntroductionXen and OpenVZ SystemsTestbed ArchitectureExperimental ResultsPerformance Evaluation: Single-NodeSimilar perfomance of base, Xen andOpenVZThroughput increases linearly withnumber of threadsFigure : ThroughputConclusion
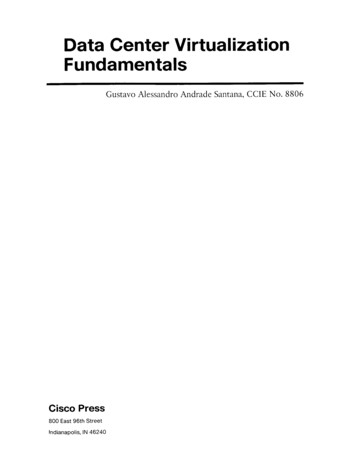
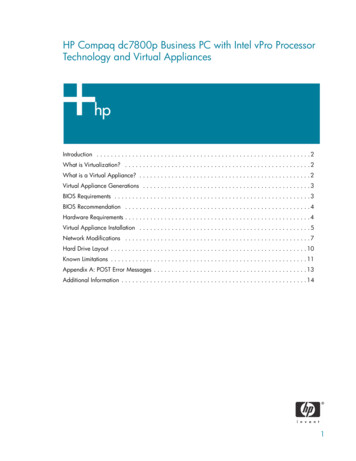
IntroductionXen and OpenVZ SystemsTestbed ArchitectureExperimental ResultsConclusionPerformance Evaluation: Single-Node (contd)Higher performance overhead in Xencompared to Open VZBase and OpenVZ show slightincreaseXen shows growth of 600% (from 18ms to 130 ms)At 800 threads, Xen is over 4 timesof OpenVZFigure : Average response timeXen system is less scalable with the workload than Open VZ or a nonvirtualized system
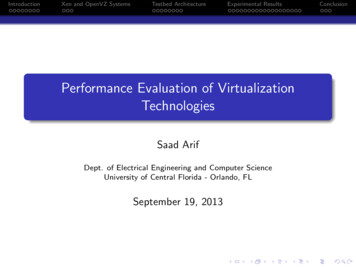
IntroductionXen and OpenVZ SystemsTestbed ArchitectureExperimental ResultsConclusionPerformance Evaluation: Single-Node (contd)Average CPU consumption of Weband DB tiers as a function ofworkloadGoes up linearly with number ofthreads for both tiersDB consumption low in browsingmix (1 - 4% of total CPU) hence notmarked differenceWeb tier for Xen twice that of baseOpenVZ stays close to baseXen shows higher slope of increaseFigure : Average CPU consumptionXen system shows higher CPU overhead, related to the higher response time
IntroductionXen and OpenVZ SystemsTestbed ArchitectureExperimental ResultsOprofile Analysis: Single-NodeAggregate values of counters at 800 threadsFor OpenVZ, counter values for whole systemFor Xen, counters for each domainDomU sum of values from Web and DB domainsAll counters normalized with baseConclusion
IntroductionXen and OpenVZ SystemsTestbed ArchitectureExperimental ResultsOprofile Analysis: Single-Node (contd)OpenVZ shows counter less thantwice of baseL2 cache misses in Xen 11 times ofbaseXen’s higher CPU overhead and response time due to high L2 cache missesConclusion
IntroductionXen and OpenVZ SystemsTestbed ArchitectureExperimental ResultsTwo-NodeWeb and DB tier of one RUBiSapplication on seperate nodesXen/OpenVZ run one VM on eachnode (Web or DB)500 - 800 concurrent clientsWe will omit throughput comparison for two-node as it is similar to the single-nodeConclusion
IntroductionXen and OpenVZ SystemsTestbed ArchitectureExperimental ResultsConclusionPerformance Evaluation: Two-NodeSmall overhead in Open VZcompared to base caseXen shows increase of 115% (13 msto 28 ms)Figure : Average response timeXen’s increase in response time is significantly lower than Xen in single-node case
IntroductionXen and OpenVZ SystemsTestbed ArchitectureExperimental ResultsConclusionPerformance Evaluation: Two-Node (contd)Average CPU consumption of Weband DB tiers as a function ofworkloadSimilar trend as single-node caseGoes up linearly with number ofthreads for both tiersWeb tier consumption higher thanDBXen shows higher slope of increasefor Web tierFigure : Average CPU consumption
IntroductionXen and OpenVZ SystemsTestbed ArchitectureExperimental ResultsConclusionPerformance Evaluation: Two-Node (contd)Dom0 CPU consumptions ofsingle-node vs two-nodeconfigurations for XenFor two-node case, Dom0 sum ofDom0 for noth nodesDom0 CPU consumption remainslow (below 4%)Shows slow linear increaseFigure : Single-node vs two-nodeDom0 CPU consumption is mostly workload dependent, and there is very little fixedcost
IntroductionXen and OpenVZ SystemsTestbed ArchitectureExperimental ResultsOprofile Analysis: Two-NodeOpenVZ L2 cache misses less thantwice of the baseL2 cache misses in Xen 5 - 10 timesof baseFigure : Web tierXen’s higher CPU overhead and response time due to high L2 cache missesConclusion
IntroductionXen and OpenVZ SystemsTestbed ArchitectureExperimental ResultsOprofile Analysis: Two-Node (contd)OpenVZ L2 cache misses about 4times of the baseL2 cache misses in Xen 5 - 10 timesof baseFigure : DB tierConclusion
IntroductionXen and OpenVZ SystemsTestbed ArchitectureExperimental ResultsConclusionOprofile Analysis: Two-Node (contd)For two-node, each counter sumof counter from each nodeL2 cache misses are higher forsingle-node compared to two-nodefor both Xen and OpenVZDue to extra overhead causedby two VMs on one nodeFigure : Single-node vs two-node
IntroductionXen and OpenVZ SystemsTestbed ArchitectureScalability EvaluationIncrease the number of RUBiSinstances on two nodesOne to twoTwo to fourCompare the scalability of Xen andOpenVZApplication performanceResource consumptionExperimental ResultsConclusion
IntroductionXen and OpenVZ SystemsTestbed ArchitectureExperimental ResultsConclusionScalability Evaluation (contd)Remains relatively constant forOpenVZ.Goes up about 500% (15 ms toroughly 90 ms) for XenFigure : Two-node two instances average response time
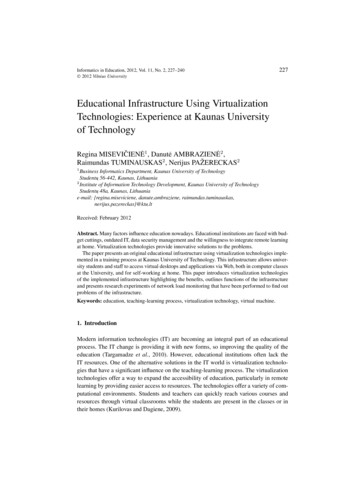
IntroductionXen and OpenVZ SystemsTestbed ArchitectureExperimental ResultsConclusionScalability Evaluation (contd)Remains below 30 ms for OpenVZ.Goes up about 600% (20 ms tobetween 140 and 200 ms) for XenFigure : Two-node four instances average response timeAverage response time in Xen increases with increasing number of instances
IntroductionXen and OpenVZ SystemsTestbed ArchitectureExperimental ResultsConclusionScalability Evaluation (contd)XenFor two-node caseOne instance: growsto 28 msFour instances: growsto 158 msOverall 400% increase!OpenVZ systemIncrease is only about100%Figure : Average response timecomparison - All configurations at800 threads
IntroductionXen and OpenVZ SystemsTestbed ArchitectureExperimental ResultsConclusionScalability Evaluation (contd)XenRoughly twice of OpenVZAready becomingoverloaded with fourinstancesOpenVZ systemTotal consumption below60%Can fit at least two moreinstances of RUBiSFigure : Web tier CPU consumptioncomparison - All configurations at800 threads
IntroductionXen and OpenVZ SystemsTestbed Architecture1Introduction2Xen and OpenVZ Systems3Testbed Architecture4Experimental Results5ConclusionExperimental ResultsConclusion
IntroductionXen and OpenVZ SystemsTestbed ArchitectureExperimental ResultsConclusionConclusionXen shows higher virtualization overhead than Open VZPerformance degradation in Xen increases as applicationworkloads increaseVirtualization overhead observed in Open VZ is limitedWeb tier CPU consumption for Xen is roughly twice that ofthe base system or Open VZMain reason of performance overhead in Xen is large numberof L2 cache misses
IntroductionXen and OpenVZ SystemsQuestionsTestbed ArchitectureExperimental ResultsConclusion
Virtualization. Layering and virtualization. Virtual machine monitor. Virtual machine. Performance and security isolation. Architectural support for virtualization. x86 support for virtualization. Full and paravirtualization. Xen 1.0 and Xen 2.0. Performance comparison of virtual machine monitors. The darker side of virtualization. Software .