Transcription
CTF/TFC.IS.1/2November 10, 2009Inter-sessional Meeting of the CTF Trust Fund CommitteeWashington, D.C.December 1-2, 2009CLEAN TECHNOLOGY FUNDINVESTMENT PLAN FOR VIETNAM
Proposed Trust Fund Committee DecisionThe Trust Fund Committee reviewed document CTF/TFC.IS.1/2, CTF Investment Plan forVietnam, endorses the plan and agrees to the further development of the activities foreseen in it.The Trust Fund Committee agrees to an envelope of up to USD 250 million in CTF funding tofinance the plan.2
Clean Technology Fund Investment Plan for VietnamExecutive SummaryIntroduction1.This Clean Technology Fund Investment Plan for Vietnam proposes CTF cofinancing of 250 million to support Vietnam‟s goals of reducing national energyconsumption relative to business as usual projections by 5-8 percent by 2015, withrenewable energy accounting for 5% of total power generating capacity by 2020, andexpanding public transport to a 50 percent share of passenger-kilometers travelled by2020. Specifically, the Investment Plan proposes CTF co-financing for industrial energyefficiency, ESCO-led energy efficiency programs, initial capitalization of EnergyConservation and Renewable Energy Funds, transmission system modernization, directinvestment and risk-sharing facility for private sector renewable energy development, andenhancement to urban rail systems in Hanoi and Ho Ch Minh City. The CTF investmentswill mobilize financing of about 3.195 billion from the government, multilateralfinanciers, carbon finance and private sector.Country and Sector Context2.Vietnam has been one of the fastest growing economies in Asia for the last twodecades, with real gross domestic product (GDP) growth averaging 8 percent annually in2003-2007. For the past ten years, energy consumption has been increasing faster thanGDP, averaging about 13 percent per year. This is attributable to the rapid expansion ofheavy industry and motorized transport, as well as increased use of fossil fuels for powergeneration. Industry accounted for 48 percent of Vietnam‟s electricity consumption andthe residential sector another 43 percent. Energy intensity of the Vietnamese economyhas increased by nearly 50 percent since 1998.3.Vietnam‟s CO2 emissions have more than doubled over the past decade and areprojected to reach 101.5 million tons of CO2-equivalent from energy-related sources by2010. Under a business as usual scenario, Vietnam‟s primary energy demand will morethan double and total energy-related greenhouse gas emissions will triple between 2010and 2030. Total emissions from primary energy consumption are projected to increasemost rapidly in electric generation (248 percent), transport (214 percent), and industry(163 percent).Priority Sectors for GHG Abatement4.In December 2008, the Government of Vietnam approved a National TargetProgram to Respond to Climate Change, which sets out sector priorities and targets for2010 and 2015. The strategies for the energy sector include: Effectively using and saving energy under climate change context.Properly and effectively using natural energy resources, developing andmaximizing the exploitation of hydro power and natural gas.3
Developing and exploiting new forms of energy: geothermal energy, solar power,wind power and nuclear power.Evaluating costs and benefits of energy projects.The Government is also considering new Energy Efficiency and Renewable Energy fundsto accelerate investments in the near term as part of the proposed Energy EfficiencySavings Law and Renewable Energy Law. These funds would be capitalized by taxes onfossil fuel consumption.5.Assessments by the Multilateral Development Banks conclude that it istechnically feasible to mitigate 155 million tons of CO2-equivalent per year via supplyside power system efficiency improvements, energy efficiency gains in the industrial andresidential sectors, and fuel switching in the power sector. A study in the context ofdeveloping Clean Development Mechanism projects identified opportunities foremissions reductions in the energy, transport and waste sectors ranging from 27 to 48percent. Hydropower is currently the most promising renewable energy resource inVietnam, with several thousand megawatts of potential in small hydro. To address thebarriers to small scale renewable energy development, the Government has issued astandardized power purchase agreement and tariff formula for small renewable energyprojects selling to the grid.6.Vietnam has launched a series of efforts to promote energy efficiency, mostnotably the Vietnam National Energy Efficiency Program (VNEEP), which is thecountry‟s first-ever comprehensive plan to institute measures for improving energyefficiency and conservation in all sectors of the economy. The program‟s energy savingstargets are three to five percent of total national energy consumption relative to businessas usual projections during phase 1 (2006-2010) and five to eight percent during phase 2(2011-2015). Achievements under phase 1 are significant: several energy efficiency andconservation directives, standards and labeling for appliances, and expansion of CFLproduction. The CTF co-financing would support implementation of phase 2, which willexpand on the accomplishments of VNEEP phase 1.7.The largest opportunities for greenhouse gas mitigation (about 2 million tons ofCO2-equivalent per year) in the transport sector are the expansion of urban rail and bussystems, complemented by the use of improved vehicle technology and modestcontributions of renewable fuels. The Government is mobilizing substantial investmentsin public transport systems in large urban areas, with the objective of expanding publictransport from about 10-15 percent to 50 percent of passenger-kilometers travelled by2020. The highest priority is the development of urban rail lines in Hanoi and Ho ChiMinh City, complemented by high-efficiency buses and “connectivity” systems.Rationale for Selected Sectors for CTF Co-Financing8.The priority activities selected for CTF co-financing are:(a) Industrial energy efficiency. CTF would co-finance investments in waste heatrecovery and other conservation measures in ten cement enterprises, covering4
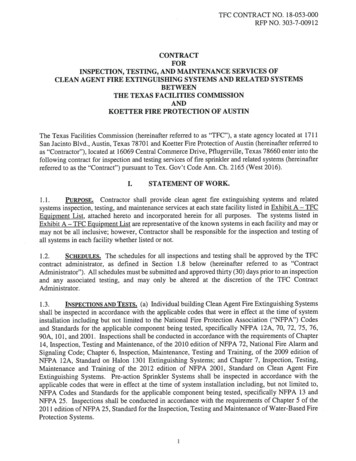
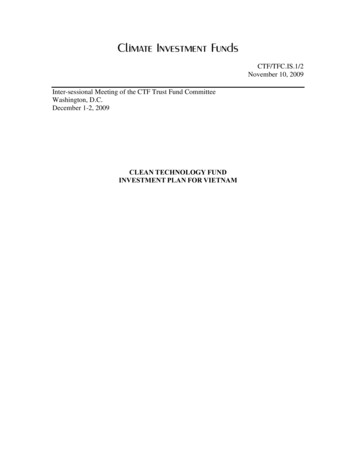
(b)(c)(d)(e)(f)about 25 percent of the country‟s cement sector output, with a view to achievingat least ten percent energy savings.ESCO-led energy efficiency programs and capitalization of an EnergyConservation Fund. CTF support would be utilized for the expansion ofinvestment vehicles for accelerating scale-up of energy efficiency activities. TheESCO activities would cover small and medium enterprises and the commercialsector.Transmission system modernization. CTF would co-finance the upgrade ofexisting lines with advanced composite core conductors, thereby potentiallyreducing system losses by three percent. In addition, it is proposed that CTFsupport the introduction of newer grid operations technology, including substationautomation and other “smart grid” systems, which could reduced losses by anadditional three percent, while also achieving long-term emissions savingsthrough demand-side management energy efficiency and enabling development ofnew renewable energy generation.Private sector support and risk-sharing facility for renewable energy development.CTF support will reduce the cost of financing of direct investments in about 500MW of renewable energy development (mostly small hydro).Initial capitalization of a new Renewable Energy Fund. CTF co-financing wouldenable expansion of investments to an additional 1500 MW of renewable energycapacity.Comprehensive urban transport systems. The Government proposes to use CTFco-financing to provide enhancements to the urban rail projects in Hanoi and HoChi Minh City. The project would strengthen linkages between transport modes,introduce high efficiency buses, urban rail/bus interchanges and integratedticketing, park and ride facilities, and modified parking charges in the urban coreareas.9.Potential for GHG reduction: The energy efficiency measures are expected toresult in emissions reductions of about 1.8 millions tons of CO2 equivalent per year(MtCO2e/y). Emissions savings from transmission upgrade with AC3 are estimated at0.156 million tons of CO2 equivalent, and about 0.5 MtCO2e/y) from the “smart gridinvestments (plus around 4.8 MtCO2e/y from small hydro enabled by the new gridtechnologies). The private sector risk-sharing facility and RE Fund will result in savingsof about 4.8 MtCO2e/y. Finally the urban transport component is estimated to haveemissions reduction potential of about 1.3 MtCO2e/y.10.Demonstration potential: Replication of energy efficiency measures throughoutthe cement sector, covering up to 40 enterprises, could result in emissions savings ofabout 7.8 MtCO2e/y, representing about 25 percent of current total industrial sectoremissions. Similar measures could be incorporated into the design of new installationsand in other industrial sectors, so that the demonstration effect is even larger. Thetransmission upgrades introduce new technologies in Vietnam; once successfullydemonstrated at scale, thereby overcoming initial cost and risk barriers, the utility islikely to adopt them as part of commercially financed investments. The Investment Planalso proposes a programmatic approach to scaling up renewable energy by developing5
and implementing power grid enhancements and strengthening of the banking sector forrenewable energy lending, thereby addressing transmission connection and off-take risks.The replication potential of the urban transport investments is significant, in view of thegrowing urbanization ratio in Vietnam (from 25 percent on 2002 to 43 percent in 2030).11.Development impact: Meeting Vietnam‟s rising energy demand through a triplingof supply creates daunting development challenges. The costs will be higher than pastcapacity expansions, especially because much more of Vietnam‟s energy supply willneed to be imported. Resource constraints along with energy security concerns makeenergy efficiency measures as well as development of domestic renewable energyresources central to maintaining Vietnam‟s economic growth. Furthermore, energyefficiency measures in the residential sector have a particularly positive effect on poorerconsumers. Commercialization of small hydro power would benefit rural electriccooperatives. Environmental co-benefits will be realized from reduced pollutants fromfossil-fuel power plants. The urban transport investments are an integral part of theGovernment‟s sector strategy to reduce traffic congestion, reduce travel times, lowerpollution levels and improve access to transport services for poorer consumers.12.Implementation Potential: VNEEP and the new Energy Efficiency and SavingsLaw are expected to provide a strong enabling environment for the CTF investments.Vietnam‟s power sector has a strong track record in project implementation andmanagement of MDB loans. Most of the renewable energy projects are being led byprivate sector developers and/or local government-backed entities, which are beingsupported by the MDBs and have demonstrated technical capacity.13.Additional costs and risk premiums: Working knowledge of energy efficiencyopportunities at the industrial and commercial enterprise and retail consumer level is stilllimited and require positive incentives through demonstration. Furthermore, energyefficiency measures have upfront cost barriers, especially unaffordable for small andmedium enterprises. For example, the capital costs for industrial cogeneration may rangewell above US 1 million, which may not be readily financeable from cash flow orworking capital. Commercial banks are reluctant to lend to conservation projects, whichdo not involve physical assets and revenue streams. With the exception of a part ofVietnam‟s small hydropower, production costs of most renewable energy sources areabove the Avoided Cost Tariff. The lack of transmission access is also a barrier torenewable energy development. Finally, the connectivity investments proposed for CTFco-financing are above and beyond the budgeted costs of the urban rail lines, which arecurrently being financed on a stand-alone basis.6
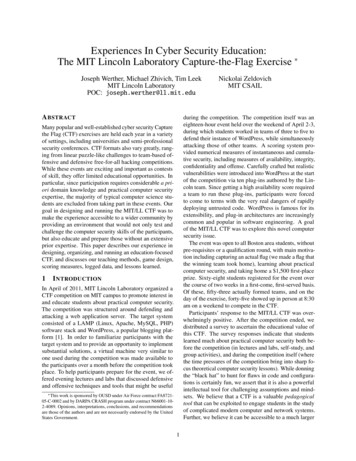
Table 1: Results Indicators for CTF Co-Financed Energy Efficiency InvestmentsIndicatorsBaselineInvestment Program ResultsCarbon intensity0.0004 MtCO2e per million US of GDP at PPPArresting anticipated increaseElectricity consumption65,900 GWh (in 2008)29,400 GWh saved, whichrepresents 10% of nationalelectricity consumption 2020Power generation capacity fromconventional sources15,864 MW capacity (in 2009),expected to grow to 60,300 MWunder BAU5,880 MW of avoided capacityadditions by (2020)Annual GHG emissions33.9 MtCO2e /y emissions fromindustrial sector6 MtCO2e /y reduced (60MtCO2e in the first 10 years)Table2: Results Indicators for CTF Co-Financed RE InvestmentsIndicatorsBaselineInvestment Program ResultsInstalled RE capacity769 MW installed RE capacity atpresent (see Table 4), increasingto 5000 MW under BAUexpansion plans8000 MW total installed capacity(additional 2000 MW of smallhydro, 500 MW of biomass and500 MW wind power)Power generation capacity fromconventional sources15,864 MW capacity (in 2009),expected to grow to 60,300 MWunder BAU2628 MW of avoided capacityadditions by 2020Annual GHG emissions fromthe electricity sector27.7 MtCO2e/ y emissions fromelectricity sector (2010)8.125 MtCO2e/y reduced (81.25MtCO2e in the first 10 years)Table 3: Results Indicators for CTF Co-Financed Urban Transport InvestmentsIndicatorsBaselineInvestment Program ResultsCarbon intensity0.0004 MtCO2e per million US of GDP at PPPArresting anticipated increaseNumber of cities with lowcarbon public transportprograms02Annual GHG emissions3.7 MtCO2e/y emissions fromtransport in the target area1.3 MtCO2e/y reduced by theprogram (13 MtCO2e in the first10 years)Number of passenger-trips onpublic transport10%44% (by year 2030 in HCMC)7
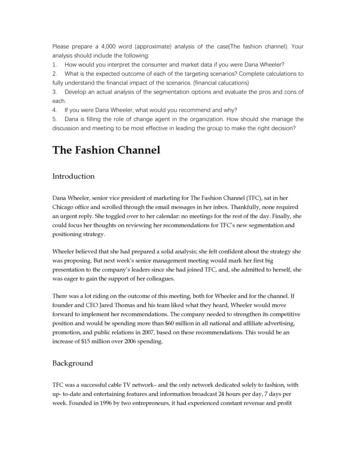
Table 4: Indicative Financing Plan(in US millions)Proposed Programs and ProjectsIndustrialEnergyEfficiency(ADB, Annex1)High VoltageTransmissionTechnology(ADB, Annex 2)UrbanTransport(ADB, Annex3)Smart GridTechnology(IBRD, Annex4)Clean EnergyFinancingFacility(IFC, ce8
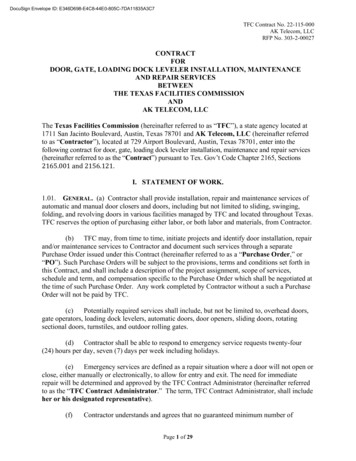
VIETNAMCLEAN TECHNOLOGY FUND INVESTMENT PLANTABLE OF CONTENTSIntroduction4I.Country and Sector Context4II.Priority Sectors for GHG Emission ReductionEnergy EfficiencyRenewable EnergyTransportSummary810111416III.Rationale for Selected Sectors for CTF Co-financingEnergy EfficiencyRenewable EnergyUrban Transport17182123IV.Enabling Policy and Regulatory EnvironmentEnergy Policy FrameworkTransport Policy Framework252829V.Implementation Potential and Risk Assessment30VI.Financing Plan and Instruments32Reference34Annexes: MDB Proposals for CTF Co-Financing1.Industrial Energy Efficiency Project (ADB)352.Power Transmission Investment Program (ADB)393.Urban Transport Program (ADB)424.Supporting Development of a Smarter Transmission Grid (IBRD)485.Private Sector Financing Program for Energy Efficiency,Cleaner Production and Renewable Energy (IFC)529
List of DMCFLCGMCIPCNGCO2eCPCTFDSME10 DIDAIFCAsian Development Bankavoided cost tariffadvanced composite core conductorAsian Development BankAsia-Pacific Economic CooperationAsia Pacific Energy Research Center10% biodiesel blended fuelbusiness as usualBus Rapid Transitbulk supply tariffcarbon capture and storageClean Development Mechanismcompact fluorescent lampCompetitive Generation MarketCountry Investment Plancompressed natural gascarbon dioxide equivalentclean productionClean Technology Funddemand side management10% (20%) ethanol blended fuelenergy efficiencyEE and conservationEE and SavingsElectricity Regulatory Authority ofVietnamenergy service companyVietnam Electricity (formerlyElectricite de Vietnam)gross domestic productGlobal Environment Facilitygreenhouse gasGovernment of Vietnamgigawatt-hourHo Chi Minh Cityhigh-voltage direct currentInternational Bank forReconstruction and Development(World Bank)International DevelopmentAssociationInternational Finance CorporationIPPJICAindependent power producerJapan International CooperationAgencykgoekmkVkWhkilogram of oil ODAp.a.PCsPMDPPoAPPPPPTAmulti-tranche financing facilityMinistry of Industry and TradeMinistry of Natural Resources andEnvironmentMinistry of Transportmillion tons carbon dioxideequivalentmillion tons of oil equivalentmegawattmegawatt-hourNational Climate ChangeCommunicationNational Power TransmissionCompanyNational Target Program to Respondto Climate Changeofficial development assistanceper annumPower CompaniesPower Master Development PlansProgram of Activities (CDM)purchase power parityProject Preparation TechnicalAssistanceRCMREREAPRetail Competitive Marketrenewable energyRE Action PlanREDPRE Development ProjectSMEsSPPAsmall and medium size enterprisesstandardized power purchaseagreementtransmission and distributiontechnical assistancetons of CO2etransport master plansterawatt-hourUnited Nations FrameworkConvention on Climate ChangeVietnam National EE ProgramWorld Bank (IBRD)Wholesale Competitive MarketWorld Trade Organizationper yearT&DTAtCO2eTMPsTWhUNFCCCVNEEPWBWCMWTO/y10local distribution utilitiesliquefied natural gasliquefied petroleum gassquare metermulti-lateral development banks
INTRODUCTION1.This Clean Technology Fund (CTF) Investment Plan (CIP) proposes CTF financing ofUS 250 million to support the Socialist Republic of Vietnam in meeting its mid-term goals ofreducing national energy consumption relative to business as usual projections by 5-8% by 2015,with renewable energy accounting for 5% of total power generating capacity by 2020, andexpanding public transport to a 50% share by 2020. The plan is agreed between, and owned by,the Government of Vietnam (GOV), the Asian Development Bank (ADB), the InternationalFinance Corporation (IFC) and the World Bank (IBRD). The plan is based on the VietnamNational Climate Change Communication (NCCC), the National Energy Development Strategyfor the period up to 2020, and other relevant sector development policies and programs, economicdevelopment plans and the government‟s investment programs and project proposals. The plan isconsidered a dynamic document, adaptable to changes in economic conditions, nationalregulatory policies, and the international context, in particular resulting from ongoing climatechange negotiations under the UNFCCC.2.The CIP is consistent with the country assistance and selector development strategies andprograms of the ADB, the World Bank, and the IFC. The plan is considered a “business plan” forthe participating Multilateral Development Banks (MDBs) and the projects and programsproposed for financing under this plan will be integrated with their country support and cofinanced with the respective MDBs‟ operations. The project proposals, contained in the annexesto this plan, will be fully developed subsequent to the CTF Trust Fund Committee‟s endorsementof the Investment Plan.3.The purpose of the CIP is to identify, assess, select and promote opportunities forinvestments in low carbon technology in Vietnam that support the government‟s developmentpriorities, objectives and ambitions for the relevant sectors and that meet the criteria of the CTF,in particular: the potential of the proposed projects and programs to save Greenhouse Gas (GHG)emissions directly – and indirectly through demonstration, replication and scaling up of theapplication of energy-saving and renewable energy technologies and systems at acceptable costswhile promoting the sustainable economic development in Vietnam. With this end in mind, theCIP provides a brief description of the country and sector context, identifies priority sectors forGHG reduction interventions, provides a rational for CTF support for selected sub-sectors, andassesses the relevant policy and regulatory support and implementation potential for the proposedprojects.I.COUNTRY AND SECTOR CONTEXT4.Vietnam is the largest country in the Greater Mekong Sub-region with a population of 84million people in 2006. It is well-endowed with natural resources including crude oil, coal,hydropower, natural gas, and marine biodiversity. Vietnam has been a net energy exporter since1990, and currently exports about 50% of coal production and about 75% of crude oil production.The country is expected to become a net energy importer after 2020.1 Vietnam has been one ofthe fastest growing economies in Asia for the last two decades, with real gross domestic product(GDP) growth averaging 8.0% annually in 2003–2007. For the past 10 years, energy consumptionhas been increasing faster than GDP, averaging about 13% per year. The commercial energy use /GDP growth elasticity registered was a very high 1.7. This is attributable to a fast expansion of1APERC Energy Overview 2008.
heavy industry and motorized transport, and increased use of fossil fuels for power generation(APERC 2006).5.Vietnam‟s business-as-usual (BAU) scenario relating to the energy sector is characterizedby continued rapid economic expansion at an average GDP growth rate of about 6% p.a. over thenext two decades.2 In 2030, Vietnam‟s population is expected to reach 108 million with a percapita income of about US 10,000 (up from US 2,500 in 2002, 2000 PPP) and an urbanizationratio of 43% (up from 25% in 2002). This rapid growth will not only lead to higher energyconsumption and GHG emissions, but it will also force structural shifts in Vietnam‟s energysupply with a relatively faster growth in coal and oil consumption and a very rapid increase inelectricity generation from 36TWh in 2002 to 266TWh in 2030, of which about 55% areprojected to come from coal and oil in 2030. Vietnam‟s investment needs in electricity generationand transmission are projected at about US 50 billion (2000 US ) between 2020 and 2030. Underthe current avoided cost tariff (ACT) system, renewable energy (RE) potential in the BAUscenario is limited to about 2000 MW of small hydropower and about 500 MW of wind power[referenced in Table 4]. Energy efficiency (EE) is considered to be a 3-5% reduction in nationalenergy consumption, which GOV plans to achieve by 2010 relative to forecasts without EEmeasures. Under BAU from 2010-2030, primary energy demand will more than double and totalenergy related GHG emissions will triple (Figures 1 and 2). These BAU trends are described ingreater detail below.6.Economic growth has been facilitated by indigenous resources including biomass energy,coal, crude oil, hydropower, and natural gas. At present, renewable energy (RE) accounts for thelargest share of primary energy demand, mainly due to the use of traditional biomass (mainly fuelwood) for residential use, particularly in rural areas. But, as shown in Figure 1, RE resources arelimited and fossil fuels are projected to account for the largest share of primary energy demandafter 2020 (APERC 2006).3 Coal production is projected to remain sufficient to support netexports through 2030, but dependence on imported petroleum fuels for transport will increasewith more than 50% net oil import dependency by 2030 (APEC 2006).Source: APERC Energy Demand and Supply Outlook 200623Data from APERC Energy Demand and Supply Outlook of 2006.APERC Energy Demand and Supply Outlook of 2006.5
7.The energy intensity of Vietnam‟s economy grew from 387 kilograms of oil equivalent(kgoe) per US 1000 of GDP in 1998 to 569 kgoe/US 1000GDP in 2006 (in constant 2000prices). Aggregate energy intensity is projected to peak around 2010 and remain relatively flatduring the next 2 decades, mainly due to increased use of commercial energy in lieu of traditionalbiomass, increased use of natural gas for power generation, and power system efficiencyimprovements. On a per capita basis, GHG emissions intensities are highest in the residentialsector and are projected to continue increasing in all sectors with the fastest increases in theindustry and transport sectors.8.In 2005, Vietnam was ranked 41st in the world in GHG emissions. Estimated totalemissions in 2000 were 114.6 million tons of carbon dioxide equivalent (MtCO2e), includingemissions from agriculture (Table 1).4 Energy related emissions in 2000 were 48.4 MtCO2e(WRI-CAIT), and are projected to reach 101.5 MtCO2e in 2010 (APERC 2006), with per capitaemissions increasing to over 1 ton per person. Principal energy-related emissions sources are theindustry, electric power, and transport sectors (Figure 2). By 2010, the relative shares ofemissions are projected to be: industry – 33%, electricity generation – 27%, transport – 24%,residential – 7%, commercial – 6%, and other [non-power] combustion – 2% (APERC 2006).Table 1: Greenhouse Gas Emissions by Sector in 2000 (MtCO2e)aSectorEnergyMtCO2e% of Total48.442.2Electricity & HeatManufacturing & ConstructionTransportationOther fuel combustionFugitive EmissionsIndustrial Processes11.214.210.910.12.06.65.8WasteAgriculture b9.550.18.343.7TOTALa9.712.49.58.81.7114.6bNote: Emissions exclude land use change, Land Use and Land Use Change are not eligible for CTF supportSource: World Resources Institute Climate Analysis Indicators Tool (WRI-CAIT) version 6.09.Total emissions from primary energy consumption are projected to increase most rapidlyin electric generation, industry, and transport (Figure 2), with electricity generation exhibitingmore emissions-intensive growth in the 2020 – 2030 period, reflecting increased use of coal. Inthe period 2010 – 2030, emissions from power generation are projected to increase by 248% from27.7 MtCO2e/y to 96.5 MtCO2e/y, industry sector emissions will increase by 163% from 33.9MtCO2e/y to 89.2 MtCO2e/y, and transport sector emissions will increase by 214% from 24.3MtCO2e/y to over 76.3 MTCO2e/y (APERC 2006).4Data from World Resources Institute Climate Analysis Indicators Tool (WRI CAIT); ranking of 41 st isbased on total emissions in 2005.6
Source: APERC Energy Demand and Supply Outlook 200610.A breakdown of total emissions by final energy consumption reflects the high energy andGHG intensity in the residential and industrial sectors. Energy efficiency in residential andindustrial electricity use is low while consumption has been growing rapidly. Industrial andresidential consumers are the two dominant electricity users in Vietnam: in 2006, the residentialsector accounted for 43% of Vietnam's electricity consumption, and industry accounted for 48%(Table 2).5 CO2 emissions from electricity generation can be ascribed largely and in roughlyequal shares to the residential and industrial sectors, making industry the biggest (direct andindirect) GHG emitter in Vietnam, followed by the residential and transport sectors.Table 2: Vietnam Final Commercial Energy Consumption, 2006 (mtoe)CoalPetroleumProductsNaturalGasTotal nsport0.06.90.06.90.17.0Commercial & Public .26.0Total6.511.20.117.99.727.5SectorNote: Non-energy use and traditional biomass excludedSource: Source: Taylor (forthcoming), based on: International Energy Agency, Government data.5Robert P. Taylor, Jas Singh, Alberto U. Ang Co (forthcoming), Vietnam: Expanding Opportunities forImproving Energy Efficiency, World Bank / ESMAP report.7
11.If past trends continue, energy demand in Vietnam will triple once again over the next tenyears.6 Unlike the past decade, however, meeting this demand through a tripling in supply in thecoming decade will be a far more daunting challenge than before. The costs will most certainly behigher in real terms, especially because much more of the supply required will need to beimported, whereas Vietnam currently is a net exporter of coal and oil. Resource constraints alongwith energy security concerns as well as future costs and global and local environmental concernsmake EE measures as well as the development of Vietnam‟s domestic RE resources an attractivecourse of action. EE alone can meet a sizable portion (typically 20-30%) of demand for increasedenergy services, at costs which are typically one-quarter as much as for additional energy supply.12.In December 2008, GoV approved a National Target Program to Respond to ClimateChange (NTP-RCC) 7, which sets out the principles, objectives, sectoral priorities, and targets for2010 and 2015. The costs for implementation of the NTP-RCC for the period from 2009-2015 areestimated at US 120 million (not including the EE and RE activities noted above), and half of theinvestment is expected to come from the international development agency partners. The programincludes specific action plans and financing mechanisms to integrate climate change concernsinto the country's sectoral development plans and their implementation. The program sets out thetarget to develop a strategy of GHG reduction in the energy sector. The policy strategies for theenergy sector as mentioned in the NTP-RCC document include (quote):- Effectively use and save the energy under climate change context;- Properly and effectively use natural energy resources, develop and maximize theexploitation of hydro power and natural gases;- Develop and exploit new forms of energy: geothermal energy, solar power, wind powerand nuclear power;- Establish the standards of exhaust fumes; evaluate environmental cost and benefit ofenergy projects.II.PRIORITY SECTORS FOR GHG EMISSION REDUCTION13.Based on their large share of total emissions and the trend in emissions growth as well aspolicy conditions affecting primary energy supply and demand, emission savings interventions inthe po
ticketing, park and ride facilities, and modified parking charges in the urban core areas. 9. Potential for GHG reduction: The energy efficiency measures are expected to result in emissions reductions of about 1.8 millions tons of CO2 equivalent per year (MtCO2e/y). Emissions savings from transmission upgrade with AC3 are estimated at