Transcription
(2022) 14:28Turk et al. Alzheimer’s Research & pen AccessRESEARCHA comparison between tau and amyloid-βcerebrospinal fluid biomarkers in chronictraumatic encephalopathy and AlzheimerdiseaseKatherine W. Turk1,2,3†, Alexandra Geada4†, Victor E. Alvarez1,2,3,5, Weiming Xia1,5, Jonathan D. Cherry1,2,3,Raymond Nicks1,5, Gaoyuan Meng2,5, Sarah Daley1,5, Yorghos Tripodis6, Bertrand R. Huber1,2,3,Andrew E. Budson1,2,3, Brigid Dwyer3,7, Neil W. Kowall1,2,3, Robert C. Cantu1,8,9,10,11, Lee E. Goldstein1,12,13,14,Douglas I. Katz3,7, Robert A. Stern1,3,8,10, Michael L. Alosco1,3, Jesse Mez1,3, Ann C. McKee1,2,3,5,14 andThor D. Stein1,2,5,14*AbstractBackground: Cerebrospinal fluid (CSF) tau and beta-amyloid levels in chronic traumatic encephalopathy (CTE), adisease which can be clinically indistinguishable from Alzheimer’s disease (AD), are largely unknown. We examinedpostmortem CSF analytes among participants with autopsy confirmed CTE and AD.Methods: In this cross-sectional study 192 participants from the Boston University AD Research Center, VA-BU-CLFCenter, and Framingham Heart Study (FHS) had post-mortem CSF collected at autopsy. Participants were divided intopathological groups based on AD and CTE criteria, with 61 CTE participants (18 low, 43 high stage), 79 AD participants(23 low, 56 intermediate to high), 11 participants with CTE combined with AD, and 41 participants lacking both CTEand AD neuropathology. The Meso Scale Discovery immunoassay system was utilized to measure amyloid-beta (Aβ140, Aβ1-42), total tau (t-tau), and phosphorylated tau (p-tau181 and p-tau231). CSF analytes were then compared acrossthe pathological groups: no CTE/no AD (control), Low CTE, Low AD, High CTE, Intermediate/High AD, and AD CTE.Results: Among the Low disease state groups, the Low CTE group had significantly higher levels of p-tau231 versusthe control group and compared to the Low AD group. The Low CTE group was also found to have significantly lowerlevels of Aβ1-42 compared to the control group. The high CTE group had higher levels of p-tau231 and lower levels ofAβ1-42 compared to Intermediate/High AD group.Conclusions: Importantly, p-tau231 and Aβ1-42 were predictors of diagnosis of CTE vs. control and CTE vs. AD.Increased CSF p-tau231 is a promising potentially sensitive biomarker of CTE, and CSF Aβ1-42 needs further investigation in CTE.Keywords: Cerebrospinal fluid, Biomarkers, Chronic traumatic encephalopathy, Alzheimer’s disease, Amyloid beta,Tau*Correspondence: tdstein@bu.edu†Katherine W. Turk and Alexandra Geada contributed equally to this work.2VA Boston Healthcare System, 150 S. Huntington Avenue, Boston, MA02130, USAFull list of author information is available at the end of the articleBackgroundChronic traumatic encephalopathy (CTE) and Alzheimer disease (AD) are neurodegenerative conditions causing memory loss that can only be definitively The Author(s) 2022. Open Access This article is licensed under a Creative Commons Attribution 4.0 International License, whichpermits use, sharing, adaptation, distribution and reproduction in any medium or format, as long as you give appropriate credit to theoriginal author(s) and the source, provide a link to the Creative Commons licence, and indicate if changes were made. The images orother third party material in this article are included in the article’s Creative Commons licence, unless indicated otherwise in a credit lineto the material. If material is not included in the article’s Creative Commons licence and your intended use is not permitted by statutoryregulation or exceeds the permitted use, you will need to obtain permission directly from the copyright holder. To view a copy of thislicence, visit http:// creat iveco mmons. org/ licen ses/ by/4. 0/. The Creative Commons Public Domain Dedication waiver (http:// creat iveco mmons. org/ publi cdoma in/ zero/1. 0/) applies to the data made available in this article, unless otherwise stated in a credit line to the data.
Turk et al. Alzheimer’s Research & Therapy(2022) 14:28diagnosed by pathologic examination. CTE is neuropathologically distinct from AD and characterized byhyperphosphorylated tau (p-tau) deposition in neurons,astrocytes, and cell processes around the small bloodvessels and at the depths of cortical sulci that ofteninvolves the superficial cortical layers II and III [1–3].AD neuropathology consists of amyloid-β plaques andtau neurofibrillary tangles in a distinct pattern beginning in the brainstem and entorhinal cortex in the earlystages and progressing to the medial temporal lobe andfinally the neocortex [4]. Analysis of differential profilesof tau-epitope phosphorylation profiles between CTEand AD is not yet fully understood though elevatedlevels of p-tau181 and p-tau231 have been reported inboth AD and CTE [5, 6]. Total tau (t-tau), phosphorylated tau (p-tau), and beta-amyloid (Aβ) measurementsin cerebrospinal fluid (CSF) have proven to be reliablebiomarkers of AD and reflect changes in brain pathology that precede cognitive decline ante-mortem [7–10].Biomarkers with the ability to detect and distinguishCTE from AD would be of great value if they show ahigh degree of correlation with CTE neuropathology.Given the relatively superficial location of p-tau in thecortex of patients with CTE compared to AD and thelack of notable involvement of amyloid β in CTE, wehypothesized that CTE participants may have increasedt-tau, p-tau181, and p-tau231 compared to cases without either CTE or AD (control), as well as relativelyhigher p-tau181, p-tau231, and Aβ42 concentrations compared to AD cases. Prior studies of Aβ deposition inCTE [11] led us to hypothesize that CSF Aβ1-40 wouldbe decreased in cases with co-occurring CTE and ADcompared to non-AD/non-CTE cases, representinga potential interaction between AD and CTE. To testthese hypotheses, we measured CSF levels of Aβ1-40,Aβ42, t-tau, p-tau181, and p-tau231 among autopsy-confirmed participants including 61 with CTE, 79 with AD,11 with concurrent CTE and AD, and 41 control participants lacking both CTE and AD pathology. Low andhigh stage CTE involve different brain regions and areassociated with different clinical symptoms such thathigh stage disease shows significant medial temporallobe pathology and is associated with increased frequency of cognitive impairment and dementia [12]. Incontrast, intermediate to high degrees of AD pathologyare characterized by greater pathological involvementof the neocortex and are also associated with cognitiveimpairment and dementia [13]. Therefore, because theunderlying neuropathology and clinical syndrome ismarkedly different in low and high stage disease [12],we compared CTE to AD CSF analytes separately ineach disease stage.Page 2 of 12MethodsParticipantsOne hundred ninety-two participants with post-mortemCSF available were enrolled from three study groups.100 donated their brains to the Veteran’s Affairs-BostonUniversity-Concussion Legacy Foundation Brain Bank(VA-BU-CLF) as part of the Understanding NeurologicInjury and Traumatic Encephalopathy (UNITE) study, 38were donated to the Framingham Heart Study (FHS), and54 were donated to Boston University’s Alzheimer’s Disease Research Center (ADRC) as part of the Health Outreach Program for the Elderly study. The UNITE groupconsisted of participants with a history of exposure tocontact sports such as football, ice hockey, boxing, soccer, rugby, and martial arts at either the professional oramateur level [14]. For most brain donations, the next ofkin contacted the brain bank to donate tissue at or nearthe time of death. The participants from Boston University’s Alzheimer’s Disease Research Center (BU ADRC)with and without cognitive impairment underwentannual cognitive evaluations using the National Alzheimer’s Disease Coordinating Center (NACC) UniformData Set (UDS) protocol [1]. The third cohort consistedof participants from the Framingham Heart Study (FHS),a longitudinal, community-based study. Consents forbrain donation and research participation were providedby donor next of kin.Head injury exposure assessmentFor UNITE study participants, retrospective clinicalevaluations were performed using semi-structured postmortem interviews, through online surveys, and reviewof medical records as described previously [14]. Information was obtained regarding repetitive head impact (RHI)exposure, traumatic brain injury (TBI) exposure, militaryhistory, athletic history, and clinical symptoms prior todeath. In addition, medical records were examined toprovide a determination of clinical symptoms and course.For the FHS participants, an athletic history assessmentidentical to UNITE was performed with the donor’s nextof kin [15]. Athletic history was not available for BUADRC participants. All interviews were conducted independently and blinded to the results of neuropathologicalexamination.Pathological criteriaAll brains were neuropathologically evaluated for changesconsistent with CTE, AD, and other neurodegenerativedisorders using previously described selection criteriaand protocols. Specifically, participants were separatedinto pathologic groups: CTE, AD, both (CTE AD), or
Turk et al. Alzheimer’s Research & Therapy(2022) 14:28neither no CTE/no AD (control). Pathologic diagnosis ofCTE was based on consensus criteria [1] and CTE staging I–IV was determined using previously publishedstaging criteria [12, 16]. Participants were stratified usingNIA-Reagan criteria to high, intermediate, or low probability of dementia caused by AD, based on Braak Scoreand CERAD score.There is growing recognition that with increasing ageco-occurring neurodegenerative pathologies becomemore common [17, 18]; therefore, comorbid neurodegenerative pathologies were not excluded from any of thegroups, including the control group. Other neurodegenerative diseases were diagnosed using well-establishedcriteria for Lewy body disease (LBD) [19] and frontotemporal lobar degeneration (FTLD) [20, 21] (Table 1).Participants with Amyotrophic Lateral Sclerosis/motorneuron disease (ALS/MND) pathology were also notexcluded and included two participants in the no CTE/noAD (control) group and one participant in the high CTEgroup. The inclusion of a wider group of participantswith concurrent neurodegenerative pathologies increasesthe generalizability of the current findings as patientspresenting for clinical evaluation of cognitive complaintsoften have multiplane neurodegenerative diagnoses andunderlying pathologies.Participants were divided into pathological groupsbased on NIA-Reagan Criteria and CTE stage as follows.Participants with no evidence of CTE and no elementsof NIA-Reagan were labeled as “No CTE/no AD” andwere used and referenced as the control group throughout. Participants with CTE Stage of I–II were determined to have early stage disease and termed “Low CTE,”while those with CTE Stage of III–IV were determinedto have late stage disease and were termed “High CTE.”Those with no evidence of CTE and NIA-Reagan of highor intermediate probability were termed “Intermediate/High AD,” while those with no evidence of CTE and NIAReagan of low probability were classified as “Low AD.”Subjects with CTE and intermediate or high probabilityof AD were combined to “CTE AD.”CSF sampling and analysisCSF was obtained post-mortem from the foramen magnum by gently lifting the frontal lobes to access with alarge bore needle. CSF was then mixed by gently inverting the tube 5 times. The tubes were centrifuged at 1500g for 15 min at 4 C. The CSF supernatant was removedwith a transfer pipet and aliquoted into 1.5mL microcentrifuge polypropylene tubes. CSF was stored at 80 Cprior to use. CSF was then diluted 1:2 with 1% BlockerA (MSD, Rockville, MD, USA, #R93BA) in wash buffer.Immunoassay was performed for Aβ1-42 and Aβ1-40, usinga multiplex plate from MSD (#K15200E), as well as forPage 3 of 12levels of p-tau231 and total tau (MSD #K15121D) according to manufacturer’s protocol. To capture tau phosphorylated at Thr residue 181, antibody AT270 was used andthe detecting antibody was the biotinylated HT7 that recognizes residue 159–163 of tau (Thermo Scientific, Rockford, IL). For hemoglobin quantification, CSF was diluted1:3000 and applied to the RayBio Human HemoglobinELISA kit (# ELH-Hgb). All standards and samples wererun in duplicate.Tissue sampling and analysisThe buffer conditions, protease inhibitors, and centrifugation protocols have been reported previously [11]. A4-mm-tissue punch was used to isolate and remove graymatter from the gyral crests and sulcal depths of themiddle frontal gyrus and neighboring sulci and superiortemporal gyrus and sulcus. The brain tissue was homogenized in five-fold volume of 5 M Guanidine Hydrocholride/50 mM Tris-HCL, pH 8.0, with protease inhibitors(Thermo Scientific, 78439) and phosphatase inhibitors(Sigma, P5726 and P0044). The tissue was homogenizedusing a mechanical homogenizer for 25 strokes followedby ultrasonic disruption on ice. The homogenates wereshaken at room temperature overnight. The lysate wasdiluted 1:80 with 1% Blocker A (MSD, #R93BA) in washbuffer, and immunoassay was performed for Aβ1-42 usinga multiplex plate from MSD.Statistical analysisStatistical analysis was performed using SPSS 26.0 (IBMCorp, Armonk, NY) and Prism v8 (Graph-Pad Software,La Jolla, CA). A one-way analysis of variance (ANOVA)was used to compare age among groups. Levels of Aβ1-40,Aβ1-42, p-tau181, p-tau231, and total tau that were outside3X the interquartile range were eliminated as outliersand included n 1 from no CTE/no AD (control) group,n 1 from low CTE group, n 1 high CTE group, n 1from low AD group, and n 1 from intermediate/highAD group for ptau 181 analysis, n 3 from the controlgroup, n 1 from low AD group, n 1 for the high CTEgroup, n 6 from intermediate/high AD group, and n 1from CTE AD group for ptau 231 analysis, n 1 from noCTE/no AD (control) group, n 2 from high CTE groupfor total tau analysis, n 5 from control group, n 3 fromlow CTE group, n 4 from high CTE group, n 1 fromintermediate/high AD group, n 1 for the CTE ADgroup for Aβ1-42 analysis, n 2 from the control group,n 1 from low CTE group, n 3 from high CTE group,n 1 from low AD group, and n 2 from intermediate/high AD group for Aβ1-40 analysis. A two-sample chisquare test weighted by sample size was used to comparethe frequency of men in each pathologic group, as wellas the frequency of FTLD and LBD pathologies between
Turk et al. Alzheimer’s Research & Therapy(2022) 14:28Page 4 of 12Table 1 Demographic and exposure characteristics of participant groupsNo CTE/No ADLow CTEHigh CTELow ADInt/High ADCTE ADSample size (n)411843235611Age at death (S.E.M.)74.1 (3.0)d64.6 (4.6)f,d,e74.8 (1.3)d86.7 (1.1)a,b,c81.1 (1.3)b79.6 (2.8)bAge range 100FHS131010131UNITE17174311210HOPE11001231033/8 (80.5%)c,e18/0 (100%)e43/0 (100%)a,d,e14/9 (60.9%)c27/29 (48.2%) a,b,c10/1 (90.9%)Stage I06 (33.3%)0001 (9.1%)Stage II012 (66.7%)0001 (9.1%)Stage III0018 (41.9%)000Stage IV0025 (58.1%)009 (81.8%)015 (36.6%)7 (38.9%)1 (2.3%)000I-II12 (29.3%)5 (27.8%)4 (9.3%)6 (26.1%)00III-IV14 (34.1%)5 (27.8%)31 (72.1%)17 (73.9%)7 (12.5%)1 (9.1%)V-VI01 (5.6%)7 (16.3%)049 (87.5%)10 (90.9%)041 (100%)14 (77.8%)21 (48.8%)000104 (22.2%)22 (51.2%)22 (95.7%)8 (14.3%)1 (9.1%)20001 (4.3%)26 (46.4%)6 (54.5%)3000022 (39.3%)4 (36.4%)FTLD pathology10 (27.7%)d,e5 (27.8%)d,e6 (14.6%)0 (0%)a,b3 (5.4%)a,b2 (18.2%)Tau9 (25%)5 (27.8%)6 (14.6%)02 (4.3%)2 (18.2%)TDP 431 (2.7%)5 (27.8%)4 (9.8%)02 (4.3%)1 (9%)n total361841154611Brainstem2 (4.4%)1 (5.6%)6 (14%)2 (13.3%)2 (4.34%)0 (0%)Limbic/neocortical4 (9.8%)2 (11.1%)10 (23.3%)1 (6.6%)8 (17.4%)4 (36.4%)n361843154611Yes 12 (29.2%)Yes 17 (94.4%)Yes 43 (100%)Yes 0Yes 9 (16%)Yes 10 (90%)No 2 (4.8%)No 0No 0No 1 (4%)No 1 (1.7%)No NAp .001CohortSex m/f (%male) .001CTE stageBraak ScoreCERAD ScoreLBD pathologyContact sports play .050.31.013Missing 27 (70.7%)Missing 1 (5.6%)Missing 0Missing 22 (96%)Missing 46 (82%)Missing 1 (9.1%)CSF hemoglobin(S.E.M.)481.0 (106.6)648.3 (261.2)465.1 (106.5)555.6 (183.6)386.5 (93.1)370.5 (192.7)n361133234911Postmortem interval(hours) (S.E.M)95% CI23.2 (3.15)b16.82–29.5646.6 .40 (3.85)b13.43–29.3720.70 (2.31)b,c16.1–25.3224.99 (4.05) 15.98–34.0N401842235611PMI range 00–5.8399.15–1.7548.00–3.00RIN (S.E.M.) n6.2 (0.2) 355.76 (0.5) 165.6 (0.2) 315.7 (0.5) 125.8 (0.2) 394.7 (0.4) 100.15pH (S.E.M.) n6.14 (0.08) 266.14 (0.10) 146.17 (0.1) 246.07 (0.13) 116.08 (0.06) 365.97 (0.8) 60.830.85 .001Data are presented mean with standard error of the (S.E.M.), years for age at death, and contact sports exposure and as #yes/#no (%) unless otherwise indicatedCERAD plaque density was rated as none (0), sparse (1), moderate (2), or frequent (3) for neuritic plaquesInt/High intermediate/high, AD Alzheimer disease, CERAD Consortium to Establish a Registry for Alzheimer’s disease, CTE chronic traumatic encephalopathy, FTLD frontotemporallobar degeneration, LBD Lewy body disease, RIN RNA integrity numberaDifferent from no CTE/no AD (p .05, Bonferroni corrected)bDifferent from low CTE (p .05, Bonferroni corrected)cDifferent from high CTE (p .05, Bonferroni corrected)dDifferent from low AD (p .05, Bonferroni corrected)eDifferent from intermediate/high AD (p .05, Bonferroni corrected)fDifferent from CTE AD (p .05, Bonferroni corrected)#ANOVA with Bonferroni correction*χ2 test for proportions between all pathology groups
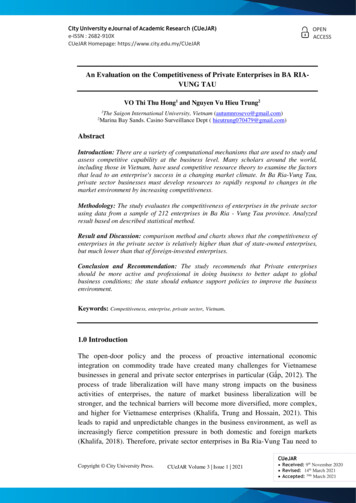
Turk et al. Alzheimer’s Research & Therapy(2022) 14:28pathologic groups. CSF analyte levels were used in aKruskal-Wallis test performed to compare levels of analytes between pathologic groups. CSF measures were alsorank-normalized (supplementary Figures e-1 and e-2)and used in one-way ANCOVAs in order to correct forage as a covariate to compare relative amounts of biomarkers between groups (supplementary results).Statistical significance was set to p 0.05 followingadjustments for multiple comparisons for all plannedanalyses. Binary logistic regression analyses were usedto determine association between p-tau231 and Aβ1-42and CTE or AD pathologic diagnosis controlling for age,sex, PMI, and other variables where appropriate. Linearregressions were performed to determine the relationship between CSF and brain Aβ1-42 levels in AD and CTE.Receiver operating characteristic (ROC) curve analysiswas used to determine sensitivity and specificity of CSFanalytes between diagnoses.ResultsStudy populationParticipants were grouped based on the presence orabsence of CTE and/or AD pathology. Group demographic differences for age at death, post-mortem interval (PMI), sex, RNA integrity number (RIN), pH, andpresence/absence of FTLD and LBD pathologies arelisted in Table 1. Pathologic groups differed in age atdeath (p 0.001) and PMI (p 0.001) (Table 1). The lowCTE group (M 64.6 4.6) was younger than the lowAD (M 86.7 1.1, p .05), intermediate/high AD (M 81.1 1.3, p 0.05), and CTE AD groups (M 79.6 2.8, p 0.05). The low AD group was older than the highCTE and control groups. The low CTE group had significantly longer PMIs (M 46.6 6.4) than the control(M 23.2 3.15 p 0.001), low AD (M 21.4 3.85, p 0.001), and intermediate/high AD group (M 20.7 2.3,p 0.05). The high CTE group (M 33.88 3.02) hadsignificantly longer PMIs than the intermediate/highAD group (M 20.7 2.3, p 0.05). Despite these differences in PMI, there was no difference in RIN, pH, or CSFhemoglobin between groups. A majority of men werepresent in each pathological group for all groups exceptfor the intermediate/high AD group which had a majority of women. Years of contact sports differed betweengroups (p 0.013) for the subset of participants thathad this history taken (n 95); post hoc pairwise comparisons revealed the control group (M 9.46 2.97) haddecreased years of contact sports compared to mild CTEgroup (M 20.85 3.43, p 0.036 Bonferroni-corrected).All groupsComparing all pathological groups using the KruskalWallis test, there were significant differences in p-tau231Page 5 of 12H(5) 16.28, p 0.006 and Aβ1-42 H(5) 19.32, p 0.002.The low CTE group had significantly higher amount ofp-tau231 (mean rank 121.1) compared to the Int/highAD group (mean rank 74.2, p 0.014). Both the highCTE group (mean rank 58.74) and low CTE (mean rank 58.14) groups were found to have significantly lowerlevels of Aβ1-42 compared to no CTE/no AD (control)(mean rank 102.1, p 0.002 and p 0.05, respectively).There was no significant difference in relative amounts ofp-tau181, total tau, and Aβ1-40 between all groups.Early stage diseaseComparing no CTE/no AD (control), low CTE, and lowAD pathological groups using the Kruskal-Wallis test,a difference in p-tau231 H(2) 8.93, p 0.015 and Aβ1-42H(2) 10.27, p 0.006 was found. The low CTE group(mean rank 52.61) had significantly higher levels ofp-tau231 versus the no CTE/no AD (control) group (meanrank 35.93, p 0.03) and compared to the low AD group(mean rank 33.02, p 0.017) (Fig. 1). The low CTEgroup (mean rank 22.18) was also found to have significantly lower levels of Aβ1-42 compared to the no CTE/noAD (control) (mean rank 41.51, p 0.006) (Fig. 1). Thelow AD group had lower levels of Aβ1-42 compared to theno CTE/no AD (control) group, but this difference wasnot significant (p 0.19). There was no significant difference in relative amount of p-tau181, total tau, or Aβ1-40between the no CTE/no AD (control), low CTE, and lowAD groups.Similar results for between group difference for earlydisease stages were obtained by rank-normalizing CSFmeasures (supplementary Figure e-1), followed by oneway ANCOVAs in order to correct for age as a covariate(supplementary results).Late stage diseaseComparing high CTE, AD, and CTE AD pathological groups using the Kruskal-Wallis test, a difference in p-tau231 H(2) 7.096, p 0.029 and Aβ1-42H(2) 7.98, p 0.019 was found overall. The HighCTE group had significantly higher levels of p-tau231(mean rank 59.61) compared to intermediate/highAD (mean rank 43.3, p 0.024) (Fig. 2). The HighCTE group also had significantly lower levels of Aβ142 (mean rank 36.34) compared to the intermediate/high AD group (mean rank 52.99, p 0.015)(Fig. 2). There was no significant difference in relativeamount of p-tau181, total tau, or Aβ1-40 between HighCTE, AD, and CTE AD groups. Although there wasno significant difference between groups for ptau181,all late stage group levels were all numerically greaterthan the control, indicating that p tau181 was elevated
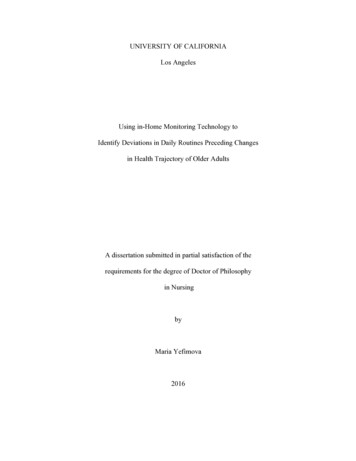
Turk et al. Alzheimer’s Research & Therapy(2022) 14:28Page 6 of 12Fig. 1 A p-tau181, B p-tau231, C total tau, D Aβ1-42, and E Aβ1-40 for no CTE/no AD (control), low CTE, and low AD groups. Scatter plots showindividual values, median, and interquartile range (25–75%) as bars, *p 0.05 corrected for multiple comparisons; Kruskal-Wallis testin late stage disease above the control group’s levels asexpected.Results for between group difference for late diseasestages were also obtained by rank-normalizing CSFmeasures (supplementary Figure e-2), followed by oneway ANCOVAs in order to correct for age as a covariate (supplementary results).Regression analysesWe performed a binary logistic regression analysisto determine the contributions of p-tau231 and Aβ1-42in predicting pathological diagnosis of CTE (low andhigh CTE combined, excluding CTE AD cases) vs.control. Variables included in the model were p-tau231,Aβ1-42, age at death, and sex (n 77). Both p-tau231(OR 1.53, 95% CI 1.08–2.16) and Aβ1-42 (OR 0.35, 95%CI 0.17–0.74) were significant predictors of CTE status while controlling for age and sex, neither of whichwere significant predictors (Table 2). Secondary analyses including PMI, pH, and presence of LBD pathologyas additional variables did not substantially change theresults and were not significant predictors of CTE diagnosis. Although RIN and FTLD were associated withCTE, their presence in the model did not change theassociations between ptau231, Aβ1-42, and CTE status.We also performed a binary logistic regression todetermine the contributions of p-tau231 and Aβ1-42 inpredicting pathological diagnosis of CTE (low and high
Turk et al. Alzheimer’s Research & Therapy(2022) 14:28Page 7 of 12Fig. 2 A p-tau181, B p-tau231, C total tau, D Aβ1-42, and E Aβ1-40 for high CTE, intermediate/high AD, and CTE AD groups. Scatter plots showindividual values, median, and interquartile range (25–75%) as bars, *p 0.05 corrected for multiple comparisons; Kruskal-Wallis testCTE combined) vs. AD (low AD and intermediate/highAD combined) (Table 3). Variables included in the modelwere p-tau231, Aβ1-42, age at death, and sex (n 111).Both p-tau231 (OR 1.34, 95% CI 1.02–1.76, p 0.036) andAβ1-42 (OR 0.51, 95% CI 0.28–0.91) were found to distinguish between CTE and AD diagnoses, controlling forage at death (OR 0.91, 95% CI 0.84–0.97) and sex whichwas not a significant predictor. A secondary analysisadjusting for PMI (n 102), demonstrated that this trendcontinued but with a decrease in significance most likelydue to decreased power, with p-tau231 (OR 1.23, 95% CI0.90–1.72), Aβ1-42 (OR 0.60, 95% CI 0.31–1.15), adjusting for age (OR 0.88, 95% CI 0.81–0.97), PMI (OR 1.06,95% CI 1.01–1.12), and sex, which was not a significantTable 2 CSF predictors of CTE pathology versus no CTE/no AD(control)OR95% ConfidenceIntervalp valuep-tau231 (U/10μL)1.531.08–2.160.016Aβ1-42 (pg/100μL)0.350.17–0.740.006Binary logistic regression comparing CTE all stages with no CTE/no AD (control)group while adjusting for age and sex (n 77)predictor. Additional secondary analyses included theaddition of RIN and pH separately as well as presence/absence of FTLD pathology and LBD pathology, none ofwhich were significant predictors of CTE diagnosis.
Turk et al. Alzheimer’s Research & Therapy(2022) 14:28Page 8 of 12Table 3 CSF predictors of CTE versus AD pathologyOR95% confidenceintervalp valuep-tau231 (U/10μL)1.341.02–1.760.036Aβ1-42 (pg/100μL)0.510.28–0.910.022Age of death0.910.84–0.970.006Binary logistic regression comparing CTE all stages with AD all stages adjustingfor age and sex (n 111)predictors of cortical Aβ1-42 levels while age was foundto be a significant predictor (β 0.38, p 0.001).Receiver Operating Characteristic curve (ROC) analysesTo assess the diagnostic accuracy of CSF p-tau231 andAβ1-42 levels, an ROC analysis was performed to determine if p-tau231, Aβ1-42, age at death, and sex were predictive of CTE vs. control diagnosis. Area under the curve(AUC) was 0.88 (SEM 0.04, p 0.001) (Fig. 3A). A separate ROC analysis was performed for CTE vs. AD diag-Fig. 3 Diagnostic accuracy of A p-tau231, Aβ1-42, age at death, sex for CTE vs. no CTE/no AD (control) diagnosis (n 77) and B p-tau231, Aβ1-42, age atdeath, and sex were predictive of CTE vs. AD (n 111). AUC area under the receiver operating characteristic curve; CI confidence intervalGiven the surprisingly low levels of Aβ1-42 in CTE,we performed a secondary analysis to test the hypothesis CSF beta-amyloid levels reflect brain tissue Aβ1-42levels in AD, but not in CTE. Using a linear regressionit was found that a model including age, sex, and CSFAβ1-42 levels predicted a significant amount of the variance of brain Aβ1-42 levels among the AD and controlgroups combined (F(3, 100) 5.42, p 0.002, R2 0.14,adjusted R2 0.114) and both CSF Aβ1-42 (β 0.21,p 0.032) and age (β 0.21, p 0.036) predicted frontal cortex Aβ1-42 while sex (β 0.13, p 0.19) did not.In a separate linear regression among the combinedCTE and control groups, the overall regression modelincluding CSF Aβ1-42 levels, age, and sex predicted asignificant amount of the variance of brain Aβ1-42 levels(F(3, 77) 4.52, p 0.006, R2 0.15, adjusted R2 .117),though CSF Aβ1-42 levels (β 0.17, p 0.11) and sex(β 0.14, p 0.21) were not found to be a significantnosis to determine if p-tau231, Aβ1-42, age at death, andsex were predictive and demonstrated that AUC was 0.93(SEM 0.023, p 0.001) (Fig. 3B).DiscussionIn summary, our results indicate that in post-mortemCSF, p-tau231 levels were significantly higher in both thelow and high CTE groups compared to the no CTE/noAD (control) group and compared to the AD groups.Furthermore, surprisingly CSF Aβ1-42 was found to bedecreased in both low stage CTE compared to the noCTE/no AD (control) group as well as in high stage CTEcompared to Int/high AD. Overall, increased levels ofp-tau231 and decreased levels of Aβ1-42 in combinationwere found to be significant predictors of CTE comparedto controls and AD.
Turk et al. Alzheimer’s Research & Therapy(2022) 14:28While three repeat and four repeat tau species are present in both AD and CTE [22, 23], unique folding patterns of tau have been reported to predominate in CTEas compared to AD [24]. Beyond a limited number ofstudies, little is known regarding the exact tau speciespresent in CTE and how they can be distinguished atthe epitope level from the tauopathy of AD, though werecently found that both p tau202 and p-tau231 are associated with increased years of RHI from American football [25]. Increased p-tau231 levels in CTE may be due totau leakage from cells into the CSF, which may be present even relatively early on in the disease course whenclinical symptoms are relatively mild. P-tau231 was significantly increased in low CTE, and there was a trendtowards an increase for high stage CTE groups comparedto AD groups, which could reflect increased neuron andaxonal damage in CTE. Studies in AD have revealedthat increased phosphorylated tau levels, including bothp-tau181 and p-tau231, correlate with neocortical neurofibrillary burden in AD [26, 27], though a similar relationship in CTE between elevated CSF p-tau231 levelsand increased p-tau accumulation in the neocortex hasnot been well-investigated. While t-tau may be a moregener
Methods: In this cross-sectional study 192 participants from the Boston University AD Research Center, VA-BU-CLF Center, and Framingham Heart Study (FHS) had post-mortem CSF collected at autopsy. Participants were divided into pathological groups based on AD and CTE criteria, with 61 CTE participants (18 low, 43 high stage), 79 AD participants