Transcription
TAU Performance System ALCF Computational Performance Workshop 2022May 23, 2022 10:15am – 11:15am CDTSameer ShendeResearch Associate Professor and Director,Performance Research Laboratory, OACISS, University of OregonPresident and Director, ParaTools, Inc.http://tau.uoregon.edu/TAU ALCF22.pdf
Agenda Motivation and challenges Introduction to the TAU Performance System Intel oneAPI integration Summary2
Motivation and Challenges With growing hardware complexity, it is getting harder to accurately measure and optimize theperformance of our HPC and AI/ML workloads. TAU Performance System :––Deliver a scalable, portable, performance evaluation toolkit for HPC and AI/ML workloads.http://tau.uoregon.edu As our software gets more complex, it is getting harder to install tools and libraries correctly inan integrated and interoperable software stack. Extreme-scale Scientific Software Stack (E4S)–Curated, Spack based software distribution of HPC & AI/ML packages includes Intel oneAPI andfeatures binary build-caches and containers.–https://e4s.io3
TAU Performance System Parallel performance framework and toolkitSupports all HPC platforms, compilers, runtime systemProvides portable instrumentation, measurement, analysis4
TAU Performance System Instrumentation Fortran, C , C, UPC, Java, Python, Chapel, Spark Automatic instrumentationMeasurement and analysis support MPI (MVAPICH2, Intel MPI), OpenSHMEM, ARMCI, PGAS, DMAPP Supports Intel oneAPI compilers pthreads, OpenMP, OMPT interface, hybrid, other thread models GPU: OpenCL, oneAPI DPC /SYCL (Level Zero), OpenACC, Kokkos, RAJA Parallel profiling and tracingAnalysis Parallel profile analysis (ParaProf), data mining (PerfExplorer) Performance database technology (TAUdb) 3D profile browser5
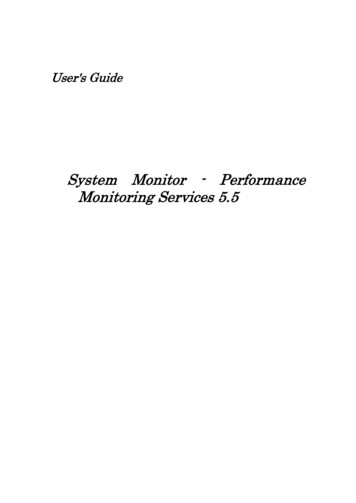
TAU integration with Intel oneAPIInstrumentation in TAU Intel oneAPI DPC , C , C, Fortran source and compiler-based instrumentation Intel oneAPI Clang compiler integration and instrumentation (-finstrument-functions) Intel oneAPI OpenMP Tools Interface (OMPT v5.0) Level Zero integration for DPC runtime events DPC symbol demangling support (-fno-sycl-unnamed-lambda) OpenCL performance instrumentation Intel MPI profiling interface in Intel HPCToolkit Intel Python instrumentation, support for Intel AI Toolkit for Tensorflow/PyTorch Intel Exascale Laboratory MAQAO binary instrumentation Intel PIN integration PAPI [UTK] and LIKWID [FAU] performance counter library integration for Intel CPUsThe only vendor toolchain that provides comprehensive language support for instrumentationat the above levels for transparently observing key events during execution!6
Application Performance Engineeringusing TAU How much time is spent in each application routine and outer loops? Within loops, what is thecontribution of each statement? What is the time spent in OpenMP loops? In kernels onGPUs. How many instructions are executed in these code regions?Floating point, Level 1 and 2 data cache misses, hits, branches taken? What is the extent ofvectorization for loops? What is the memory usage of the code? When and where is memory allocated/de-allocated?Are there any memory leaks? What is the memory footprint of the application? What is thememory high water mark? How much energy does the application use in Joules? What is the peak power usage? What are the I/O characteristics of the code? What is the peak read and write bandwidth ofindividual calls, total volume? How does the application scale? What is the efficiency, runtime breakdown of performanceacross different core counts?7
InstrumentationAdd hooks in the code to perform measurements Source instrumentation using a preprocessor–Add timer start/stop calls in a copy of the source code.Use Program Database Toolkit (PDT) for parsing source code.–Requires recompiling the code using TAU shell scripts (tau cc.sh, tau f90.sh)–Selective instrumentation (filter file) can reduce runtime overhead and narrow instrumentationfocus.– Compiler-based instrumentation–Use system compiler to add a special flag to insert hooks at routine entry/exit.–Requires recompiling using TAU compiler scripts (tau cc.sh, tau f90.sh ) Runtime preloading of TAU’s Dynamic Shared Object (DSO)–No need to recompile code! Use mpirun tau exec ./app with options.8
TAU’s Support for Runtime Systems MPI Pthread Captures time spent in routines per thread of executionOpenMP PMPI profiling interfaceMPI T tools interface using performance and control variablesOMPT tools interface to track salient OpenMP runtime eventsOpari source rewriterPreloading wrapper OpenMP runtime library when OMPT is not supportedOpenACC OpenACC instrumentation APITrack data transfers between host and device (per-variable)Track time spent in kernels9
TAU’s Support for Runtime Systems (contd.) OpenCL OpenCL profiling interface Track timings of kernelsIntel OneAPI Level Zero Track time spent in kernels executing on GPU Track time spent in OneAPI runtime callsKokkos Kokkos profiling API Push/pop interface for region, kernel execution interfacePython Python interpreter instrumentation API Tracks Python routine transitions as well as Python to C transitions10
Examples of Multi-Level Instrumentation MPI OpenMP MPI T PMPI OMPT may be used to track MPI and OpenMPMPI pthread PMPI pthread interfacesMPI Intel oneAPI DPC /SYCLPMPI Level Zero interfacesOpenCL Python OpenCL Python instrumentation interfacesKokkos OpenMP Kokkos profiling API OMPT to transparently track eventsKokkos pthread MPI Kokkos pthread wrapper interposition library PMPI layerMPI OpenCL PMPI OpenCL profiling interfaces11
Using TAU’s Runtime Preloading Tool: tau execPreload a wrapper that intercepts the runtime system call and substitutes with anotherMPIOpenMPPOSIX I/OMemory allocation/deallocation routinesWrapper library for an external packageNo modification to the binary executable!Enable other TAU options (communication matrix, OTF2, event-based sampling)12
TAU Execution Command (tau exec)Uninstrumented execution% mpirun -np 256 ./a.outTrack GPU operations% mpirun –np 256 tau exec –l0./a.out% mpirun –np 256 tau exec –cupti ./a.out% mpirun –np 256 tau exec –rocm./a.out% mpirun –np 256 tau exec –opencl ./a.out% mpirun –np 256 tau exec –openacc ./a.outTrack MPI performance% mpirun -np 256 tau exec ./a.outTrack I/O, and MPI performance (MPI enabled by default)% mpirun -np 256 tau exec -io ./a.outTrack OpenMP and MPI execution (using OMPT for Intel v19 or Clang 8 )% export TAU OMPT SUPPORT LEVEL full;% mpirun –np 256 tau exec –T ompt,mpi -ompt ./a.outTrack memory operations% export TAU TRACK MEMORY LEAKS 1% mpirun –np 256 tau exec –memory debug ./a.out (bounds check)Use event based sampling (compile with –g)% mpirun –np 256 tau exec –ebs ./a.outAlso export TAU METRICS TIME,PAPI L1 DCM -ebs resolution file function line Non-MPI execution: use –T serial% tau exec –T serial,level zero –l0 –ebs ./a.out13
Configuring TAU and choosing a configuration in tau exec% cd /soft/perftools/tau/tau-2.31.1; cat .all configs./configure -ompt -mpi -bfd download -unwind download -iowrapper -dwarf download–papi dir -pdt dir -pdt c g -otf download% make install% module load tau/2.31.1% ls kefile.tau-intel-papi-pthread-pdt% aprun –n 4 tau exec –T ompt,papi –ebs ./a.outWill preload libTAU.so red-intel-papi-ompt-mpi-pdt-openmp/Corresponding ile.tau-intel-papi-ompt-mpi-pdt-openmp-T mpi is chosen by default. Please use –T serial for non-mpi cases.14
Profiling and TracingTracingProfiling Profiling shows you how much(total) time was spent in each routine Tracing shows you when the events takeplace on a timelineProfiling and tracingProfiling shows you how much (total) time was spent in each routineTracing shows you when the events take place on a timeline15
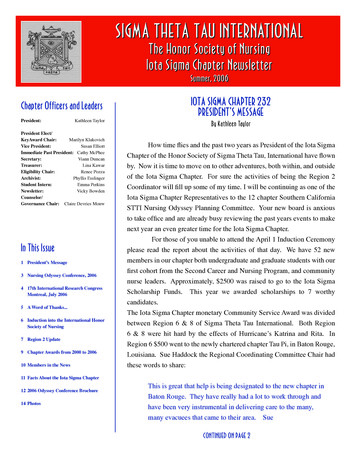
Inclusive vs. Exclusive values Inclusive Information of all sub-elements aggregated into single valueExclusive Information cannot be subdivided furtherint foo(){int a;a 1 1;InclusiveExclusivebar();a a 1;return a;}40TH VI-HPS TUNING WORKSHOP (LRZ, GERMANY, 14-18 JUNE 2021) - ONLINE16
Performance Data MeasurementIndirect via SamplingDirect via ProbesCall START(‘potential’)// codeCall STOP(‘potential’) Exact measurementFine-grain controlCalls inserted intocode No code modificationMinimal effortRelies on debugsymbols (-g)17
Event-Based Sampling easurementRunning program is periodically interrupted to takemeasurementTimer interrupt, OS signal, or HWC overflowService routine examines return-address stackAddresses are mapped to routines using symbol tableinformationStatistical inference of program behaviorNot very detailed information on highly volatile metricsRequires long-running applicationsint main(){int i;for (i 0; i 3; i )foo(i);}return 0;void foo(int i){if (i 0)foo(i – 1);Works with unmodified executables (tau exec –ebs)}40TH VI-HPS TUNING WORKSHOP (LRZ, GERMANY, 14-18 JUNE 2021) - ONLINE18
Instrumentationt1t2t3 t4t5t6 t7 t8t9t10t11 t12 t13 t code is inserted such that every event ofinterest is captured directlyCan be done in various waysAdvantage:Much more detailed informationDisadvantage:Processing of source-code / executablenecessaryLarge relative overheads for small functions40TH VI-HPS TUNING WORKSHOP (LRZ, GERMANY, 14-18 JUNE 2021) - ONLINEint main(){int i;TAU START(“main”);for (i 0; i 3; i )foo(i);TAU STOP(“main”);return 0;}void foo(int i){TAU START(“foo”);if (i 0)foo(i – 1);TAU STOP(“foo”);}19
How much data do you O(TB)FlatProfile40TH VI-HPS TUNING WORKSHOP (LRZ, GERMANY, 14-18 JUNE 2021) - ONLINECallsiteProfileTrace20
Using TAU’s Runtime Preloading Tool: tau exec Preload a wrapper that intercepts the runtime system call and substitutes with anotheroMPIoOpenMPoPOSIX I/OoMemory allocation/deallocation routinesoWrapper library for an external package No modification to the binary executable! Enable other TAU options (communication matrix, OTF2, event-based sampling)21
TAU: Quickstart GuideSetup: % module load tauProfiling with an un-instrumented application: MPI:% mpirun -np 64 tau exec -ebs ./a.out MPI OpenMP with Clang 9 :% export TAU OMPT SUPPORT LEVEL full;% mpirun -np 64 tau exec –T ompt,mpi –ompt ./a.out Pthread:% mpirun -np 64 tau exec –T mpi,pthread –ebs ./a.out Python MPI Sampling:% mpirun -np 64 tau python –ebs ./a.py Python MPI CUDA Sampling:% mpirun –np 64 tau python –cupti –ebs ./a.py Python CUDA (no MPI):% tau exec –T cupti,serial –cupti ./a.pyAnalysis:% pprof –a –m more;% paraprof (GUI)Tracing: Vampir: MPI: Chrome:% export TAU TRACE 1; export TAU TRACE FORMAT otf2% mpirun -np 64 tau exec ./a.out; vampir traces.otf2 &% export TAU TRACE 1; mpirun –np 64 tau exec ./a.out; tau treemerge.pl;% tau trace2json tau.trc tau.edf –chrome –ignoreatomic –o app.jsonChrome browser: chrome://tracing Jumpshot:(Load - app.json) Or use Perfetto.dev and load in UI.% export TAU TRACE 1; mpirun –np 64 tau exec ./a.out; tau treemerge.pl;% tau2slog2 tau.trc tau.edf –o app.slog2; jumpshot app.slog2 &22
Inclusive Measurements23
Exclusive Time24
TAU: Intel oneAPI DPC on an Intel Gen12LP or DG1 GPU% tau exec –T level zero,serial –l0 ./a.out25
TAU: Intel oneAPI DPC on an Intel Gen12LP or DG1 GPU% tau exec –T level zero,serial –l0 ./a.out26
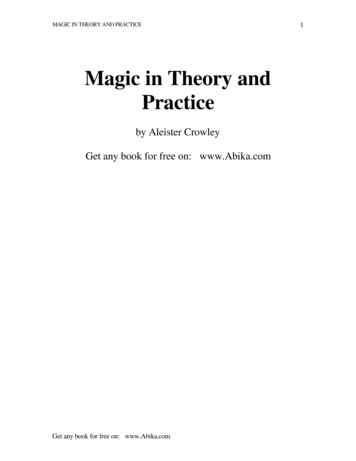
Intel Level Zero (TigerLake Gen12LP integrated CPUs or DG1)Units: secondsTime spent in GEMM kernelUnits: microseconds% mpirun –np 64 tau exec –l0 ./a.out27
TAU and Vampir [TU Dresden]: Intel oneAPI OpenCL with MPI% export TAU TRACE 1; export TAU TRACE FORMAT otf2% mpirun –np 4 tau exec –T level zero –opencl ./a.out28
Tracing: Jumpshot (ships with TAU)29
Tracing: Chrome Browser% export TAU TRACE 1% mpirun –np 256 tau exec ./a.out% tau treemerge.pl; tau trace2json tau.trc tau.edf –chrome –ignoreatomic –o app.jsonChrome browser: chrome://tracing (Load - app.json)30
ParaProf Profile Browser% paraprof31
ParaProf 3D Profile Browser32
TAU – ParaProf 3D Visualization% paraprof app.ppkWindows - 3D Visualization - Bar Plot (right pane)33
TAU – 3D Communication Window% export TAU COMM MATRIX 1; mpirun tau exec ./a.out% paraprof ; Windows - 3D Communication Matrix34
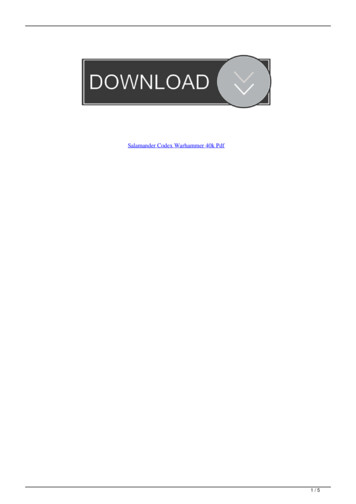
Event Based Sampling (EBS)File: point solver.F90Line: 2705Uninstrumented!% mpirun -n 16 tau exec –ebs a.out35
TAU’s Runtime Environment VariablesEnvironment VariableDefaultDescriptionTAU TRACE0Setting to 1 turns on tracingTAU CALLPATH0Setting to 1 turns on callpath profilingTAU TRACK MEMORY FOOTPRINT0Setting to 1 turns on tracking memory usage by sampling periodically the resident set size and high water mark of memoryusageTAU TRACK POWER0Tracks power usage by sampling periodically.TAU CALLPATH DEPTH2Specifies depth of callpath. Setting to 0 generates no callpath or routine information, setting to 1 generates flat profile andcontext events have just parent information (e.g., Heap Entry: foo)TAU SAMPLING1Setting to 1 enables event-based sampling.TAU TRACK SIGNALS0Setting to 1 generate debugging callstack info when a program crashesTAU COMM MATRIX0Setting to 1 generates communication matrix display using context eventsTAU THROTTLE1Setting to 0 turns off throttling. Throttles instrumentation in lightweight routines that are called frequentlyTAU THROTTLE NUMCALLS100000Specifies the number of calls before testing for throttlingTAU THROTTLE PERCALL10Specifies value in microseconds. Throttle a routine if it is called over 100000 times and takes less than 10 usec of inclusivetime per callTAU CALLSITE0Setting to 1 enables callsite profiling that shows where an instrumented function was called. Also compatible with tracing.TAU PROFILE FORMATProfileSetting to “merged” generates a single file. “snapshot” generates xml formatTAU METRICSTIMESetting to a comma separated list generates other metrics. (e.g.,ENERGY,TIME,P VIRTUAL TIME,PAPI FP INS,PAPI NATIVE event : subevent )36
Runtime Environment VariablesEnvironment VariableDefaultDescriptionTAU TRACE0Setting to 1 turns on tracingTAU TRACE FORMATDefaultSetting to “otf2” turns on TAU’s native OTF2 trace generation (configure with –otf download)TAU EBS UNWIND0Setting to 1 turns on unwinding the callstack during sampling (use with tau exec –ebs or TAU SAMPLING 1)TAU EBS RESOLUTIONlineSetting to “function” or “file” changes the sampling resolution to function or file level respectively.TAU TRACK LOAD0Setting to 1 tracks system load on the nodeTAU SELECT FILEDefaultSetting to a file name, enables selective instrumentation based on exclude/include lists specified in the file.TAU OMPT SUPPORT LEVELbasicSetting to “full” improves resolution of OMPT TR6 regions on threads 1. N-1. Also, “lowoverhead” option isavailable.TAU OMPT RESOLVE ADDRESS EAGERLY1Setting to 1 is necessary for event based sampling to resolve addresses with OMPT. Setting to 0 allows theuser to do offline address translation.37
Runtime Environment VariablesEnvironment VariableDefaultDescriptionTAU TRACK MEMORY LEAKS0Tracks allocates that were not de-allocated (needs –optMemDbg or tau exec –memory)TAU EBS SOURCETIMEAllows using PAPI hardware counters for periodic interrupts for EBS (e.g., TAU EBS SOURCE PAPI TOT INSwhen TAU SAMPLING 1)TAU EBS PERIOD100000Specifies the overflow count for interruptsTAU MEMDBG ALLOC MIN/MAX0Byte size minimum and maximum subject to bounds checking (used with TAU MEMDBG PROTECT *)TAU MEMDBG OVERHEAD0Specifies the number of bytes for TAU’s memory overhead for memory debugging.TAU MEMDBG PROTECT BELOW/ABOVE0Setting to 1 enables tracking runtime bounds checking below or above the array bounds (requires –optMemDbg while building or tau exec –memory)TAU MEMDBG ZERO MALLOC0Setting to 1 enables tracking zero byte allocations as invalid memory allocations.TAU MEMDBG PROTECT FREE0Setting to 1 detects invalid accesses to deallocated memory that should not be referenced until it isreallocated (requires –optMemDbg or tau exec –memory)TAU MEMDBG ATTEMPT CONTINUE0Setting to 1 allows TAU to record and continue execution when a memory error occurs at runtime.TAU MEMDBG FILL GAPUndefinedInitial value for gap bytesTAU MEMDBG ALINGMENTSizeof(int)Byte alignment for memory allocationsTAU EVENT THRESHOLD0.5Define a threshold value (e.g., .25 is 25%) to trigger marker events for min/max38
Setup: Installing TAU on Laptops Prerequisites: Java in your pathMicrosoft Windows Install Java from Oracle.com http://tau.uoregon.edu/tau.exe Install, click on a ppk file to launch paraprof macOS (x86 64) Install Java 11.0.3: Download and install http://tau.uoregon.edu/java.dmgIf you have multiple Java installations, add to your /.zshrc (or /.bashrc as appropriate):export PATH ontents/Home/bin: PATH java -version Download and install TAU (copy to /Applications from dmg):http://tau.uoregon.edu/tau.dmg export PATH /Applications/TAU/tau/apple/bin: PATH paraprof app.ppk &macOS (arm64, M1) http://tau.uoregon.edu/java arm64.dmg http://tau.uoregon.edu/tau arm64.dmgLinux (http://tau.uoregon.edu/tau.tgz) ./configure; make install; export PATH taudir /x86 64/bin: PATH; paraprof app.ppk &39
TAU: Quickstart GuideSetup: % module load tauProfiling with an un-instrumented application: MPI:% mpirun -np 64 tau exec -ebs ./a.out MPI OpenMP with Intel 19 :% export TAU OMPT SUPPORT LEVEL full;% mpirun -np 64 tau exec –T ompt,mpi –ompt ./a.out Pthread:% mpirun -np 64 tau exec –T mpi,pthread –ebs ./a.out Python MPI Sampling:% mpirun -np 64 tau python –ebs ./a.py Python MPI OpenCL:% mpirun –np 64 tau python –opencl ./a.py DPC /SYCL (no MPI):% tau exec –T level zero,serial –l0 ./fooAnalysis:% pprof –a –m more;% paraprof (GUI)Tracing: Vampir: MPI: Chrome:% export TAU TRACE 1; export TAU TRACE FORMAT otf2% mpirun -np 64 tau exec ./a.out; vampir traces.otf2 &% export TAU TRACE 1; mpirun –np 64 tau exec ./a.out; tau treemerge.pl;% tau trace2json tau.trc tau.edf –chrome –ignoreatomic –o app.jsonChrome browser: chrome://tracing Jumpshot:(Load - app.json)% export TAU TRACE 1; mpirun –np 64 tau exec ./a.out; tau treemerge.pl;% tau2slog2 tau.trc tau.edf –o app.slog2; jumpshot app.slog2 &40
TAU Breakout Session – CoMD on ThetaSetup preferred program environment compilers (check instructions for launching jobs)Default set Intel Compilers with Intel MPI. You must compile with –dynamic –g% module load tau;% tar zxf /soft/perftools/tau/workshop.tgz% cd workshop/CoMD/src-openmp;% make clean% make% cd ./bin; cat rompt.shIn a second window:% qsub -I -n 1 –A comp perf workshop –q comp perf workshop -t 50 -q debug-cache-quad% cd workshop/CoMD/bin; ./romp.sh% ./rompt.sh% paraprof –-pack ex1.ppkIn the first window:% paraprof ex1.ppk &41
TAU Breakout Session – MPI on ThetaGPUSetup preferred program environment compilers (check instructions for launching jobs)NOTE: On Ubuntu please link with -no-pie option for sampling.% module load cobalt/cobalt-gpu; qsub –I –n 1 –A comp perf workshop –t 50% module use sameer/modulefiles; module load tau;% tar zxf sameer/alcf22/workshop.tgz% cd workshop/matmult% make clean% make% mpirun –np 4 ./matmult% mpirun –np 4 tau exec –ebs ./matmult% paraprof –-pack mm.ppkBring ppk file to your desktop:% paraprof mm.ppk &42
TAU Breakout Session – CUDA on ThetaGPUSetup preferred program environment compilers (check instructions)% module load cobalt/cobalt-gpu; qsub –I –n 1 –A comp perf workshop –t 50% module use sameer/modulefiles; module load tau;% tar zxf /soft/perftools/tau/workshop.tgz% cd workshop/cuda;% make clean% make% ./matmult% cat ./rt% ./rt% pprof –a more% paraprof –-pack cupti ex.ppkBring ppk file to your desktop:% paraprof cupti ex.ppk &43
TAU Breakout Session – CUDA with MPI on ThetaGPUSetup preferred program environment compilers (check instructions)% module load cobalt/cobalt-gpu; qsub –I –n 1 –A comp perf workshop –t 50% module use sameer/modulefiles; module load tau;% tar zxf /soft/perftools/tau/workshop.tgz% cd workshop/CloverLeaf/CloverLeaf CUDA;% make clean% make -j% mpirun –np 3 ./clover leaf% mpirun –np 3 tau exec -T cupti,mpi –cupti ./clover leaf% pprof –a more% paraprof –-pack cupti ex.ppkBring ppk file to your desktop:% paraprof cupti ex.ppk &44
Extreme-scale ScientificSoftware Stack (E4S)
E4S: Better Quality, Documentation, Test, Integration, Delivery, Build & UseDelivering HPC software to facilities, vendors, agencies, industry, international partners in a brand-new wayCommunity PoliciesCommitment to software qualityCurated collectionThe end of dependency hellTurnkey stackA new user experienceDocPortalSingle portal to all E4S product infoQuarterly releasesRelease 22.02 – Februaryhttps://e4s.ioPortfolio testingEspecially leadership platformsBuild caches10X build time improvementE4S Strategy GroupUS agencies, industry, international46
E4S: Extreme-scale Scientific Software Stack Curated, Spack based software distribution [https://spack.io] Spack binary build caches for bare-metal installs Container images on DockerHub and E4S website of pre-built binaries of ECP ST products Base images and full featured containers (with GPU support) GitHub recipes for creating custom images from base images GitLab integration for building E4S images E4S validation test suite on GitHub e4s-cl container launcher tool for MPI substitution in applications E4S VirtualBox image with support for container runtimes Docker Singularity Shifter Charliecloud AWS and GCP images to deploy E4Shttps://e4s.io47
Extreme-scale Scientific Software Stack (E4S) E4S: HPC Software Ecosystem – a curated software portfolio A Spack-based distribution of software tested for interoperabilityand portability to multiple architectures Available from source, containers, cloud, binary caches Leverages and enhances SDK interoperability thrust Not a commercial product – an open resource for all Oct 2018: E4S 0.1 - 24 full, 24 partial release products Jan 2019: E4S 0.2 - 37 full, 10 partial release products Nov 2019: E4S 1.0 - 50 full, 5 partial release products Feb 2020: E4S 1.1 - 61 full release productshttps://e4s.io Nov 2020: E4S 1.2 (aka, 20.10) - 67 full release products Feb 2021: E4S 21.02 - 67 full release, 4 partial release May 2021: E4S 21.05 - 76 full release products Aug 2021: E4S 21.08 - 88 full release products Nov 2021: E4S 21.11 - 91 full release productsAlso include other products .e.g.,AI: PyTorch, TensorFlow (CUDA, ROCm)Co-Design: AMReX, Cabana, MFEM48
Spack is a flexible package manager for HPC How to install Spack (works out of the box): git clone https://github.com/spack/spack . spack/share/spack/setup-env.sh How to install a package: spack install tau TAU and its dependencies are installedwithin the Spack directory. Unlike typical package managers, Spack can also installmany variants of the same build.–Different compilers–Different MPI implementations–Different build optionsVisit spack.iogithub.com/spack/spack@spackpm49
Spack provides the spec syntax to describe custom configurations git clone https://github.com/spack/spack. spack/share/spack/setup-env.shspack compiler findspack external find# set up compilers# set up external packages spack install tauunconstrained spack install tau@2.31.1@ custom version spack install tau@2.31.1 %gcc@9.3.0% custom compiler spack install tau@2.31.1 %gcc@9.3.0 level zero opencl /- build option spack install tau@2.31.1 %gcc@9.3.0 mpi mvapich2@2.3 wrapperrpath dependency information Each expression is a spec for a particular configuration–––Each clause adds a constraint to the specConstraints are optional – specify only what you need.Customize install on the command line! Spec syntax is recursive–Full control over the combinatorial build space50
E4S base container images for x86 64, ppc64le, and aarch64 Hub.docker.comecpe4sPlatforms: x86 64 ppc64le aarch64GPU runtimes: Cuda ROCm oneAPISingularity imagesMiminal Spack image51
Minimal Spack base image on Dockerhub Create customcontainer images1M downloads!52
Download E4S 22.02 GPU Container Image: NVIDIA, AMD, Intel Full featured Singularity image GPU base images for– x86 64 (Intel, AMD, NVIDIA)– ppc64le– aarch64 Packages with support for allthree GPU runtimes:––KokkosTAUhttps://e4s.io53
22.02 Release: 100 Official Products dependencies (gcc, x86 64)GPU runtimes AMD (ROCm) 4.5.2 Intel (oneAPI) 2022.0.2 NVIDIA (CUDA) 11.4.2 NVHPC 22.154
22.02 Release: 100 Official Products dependencies (gcc, x86 64)Languages: Julia PythonAI products with GPU support Tensorflow Pytorch3D Visualization Paraview VisIt TAU’s paraprof 55
22.02 Release: 100 Official Products dependencies (gcc, ppc64le)GPU runtimes for IBM Power CUDA 11 NVHPC 22.1Languages Julia PythonAI packages for NVIDIA GPU TensorFlow PyTorch56
22.02 Release: 100 Official Products dependencies (gcc, ppc64le)57
E4S 22.02 Release: full featured GPU image, LLVM DOE image Full featured images ppc64le and x86 64 Docker and Singularity LLVM DOE E4S image58
E4S 22.02 Release: GPU, ppc64le for Docker Containers 100 E4S Products Support for GPUs ppc64le and x86 64% docker pull ecpe4s/e4s-gpu59
E4S Validation Test Suite Provides automated build and run testsValidate container environments and productsNew LLVM validation test suite for DOE LLVM git clone https://github.com/E4S-Project/testsuite.git60
E4S Base Container Images for x86 64, ppc64le, and aarch64 Hub.docker.comecpe4sPlatforms: x86 64 Ppc64le aarch64GPU runtimes: Cuda ROCm oneAPI61
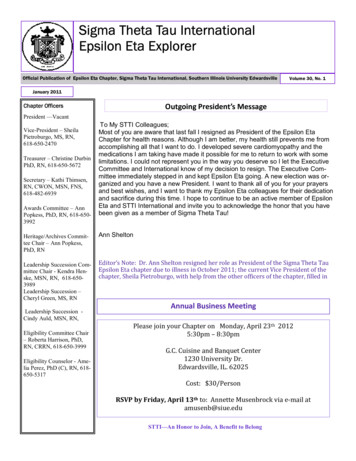
E4S 21.11 AWS image: US-West2 (OR)E4S 22.02 AWS Intel oneAPI CUDA NVHPC ROCm AWS DCV Spack BuildCache ECP: Nalu-Wind Trilinos 13.2.0 OpenFOAM ParaView TAU Docker Shifter Charliecloud E4S Singularity 62
e4s-cl: A tool to simplify the launch of MPI jobs in E4S containers E4S containers support replacement of MPI libraries using MPICH ABI compatibility layer andWi4MPI [CEA] for OpenMPI replacement. Applications binaries built using E4S can be launched with Singularity using MPI librarysubstitution for efficient inter-node communications. e4s-cl is a new tool that simplifies the launch and MPI replacement.–e4s-cl init --backend [singularity shifter] --image file --source startup cmds.sh –e4s-cl mpirun -np N command Usage:. /opt/intel/oneapi/setvars.she4s-cl init --backend singularity --image /images/e4s-gpu-x86.sif --source /source.shcat /source.sh. /spack/share/spack/setup-env.shspack load trilinos cuda cuda arch 80spack unload mpiche4s-cl mpirun -np 4 ./a.outhttps://github.com/E4S-Project/e4s-cl63
Using E4S on ThetaGPUSetup preferred program environment compilers (check instructions)% module load cobalt/cobalt-gpu; qsub –I –n 1 –A comp perf workshop –t 50% singularity run --nv –e sameer/scr/e4s/ecp.simgSingularity conda activate cudaSingularity cd /opt/demo/python tests; python ./f2.pySingularity spack findSingularity module availSingularity ls TAU/Makefile*/opt/tau/tau latest/x86 64/lib/Makefile.tau/opt/tau/tau latest/x86 64/lib/Makefile.tau-level zero-intel-icpc-mpi-pthread-pdt/opt/tau/tau latest/x86 64/lib/Makefile.tau-level zero-pthread-pdt/opt/tau/tau latest/x86 64/lib/Makefile.tau-mpi-pdt/opt/tau/tau latest/x86 au latest/x86 au latest/x86 64/lib/Makefile.tau-python-cupti-pdt/opt/tau/tau latest/x86 -python-pdt/opt/tau/tau latest/x86 ython-pdt/opt/tau/tau latest/x86 ython-pdt/opt/tau/tau latest/x86 hon-pdt64
Download TAU from U. Oregonhttp://tau.uoregon.eduhttps://e4s.io [TAU in Docker/Singularity containers]for more informationFree download, open source, BSD license65
Performance Research Laboratory, University of Oregon, Eugenewww.uoregon.edu66
Support Acknowledgements US Department of Energy (DOE)–––––ANLOffice of Science contracts, ECPSciDAC, LBL contractsLLNL-LANL-SNL ASC/NNSA contractBattelle, PNNL and ORNL contractDepartment of Defense (DoD)–PETTT, HPCMPNational Science Foundation (NSF)–SI2-SSI, Glassbox, E4S Workshop NASA Intel CEA, FrancePartners:–University of Oregon–The Ohio State University–ParaTools, Inc.–University of Tennessee, Knoxville–T.U. Dresden, GWT–Jülich Supercomputing Center67
Thank youhttps://www.exascaleproject.orgThis research was supported by the Exascale Computing Project (17-SC-20-SC), a joint project ofthe U.S. Department of Energy’s Office of Science and National Nuclear Security Administration,responsible for delivering a capable exascale ecosystem, including software, applications, andhardware technology, to support the nation’s exascale computing imperative.Thank you to all collaborators in the ECP and broader computational science communities. Thework discussed in this presentation represents creative contributions of many people who arepassionately working toward next-generation computational science.68
69
6 TAU integration with Intel oneAPI Instrumentation in TAU Intel oneAPI DPC , C , C, Fortran source and compiler-based instrumentation Intel oneAPI Clang compiler integration and instrumentation (-finstrument-functions) Intel oneAPI OpenMP Tools Interface (OMPT v5.0) Level Zero integration for DPC runtime events DPC symbol demangling support (-fno-sycl-unnamed-lambda)