Transcription
This is the pre-peer reviewed version of the following article:Randell, R., Ruddle, R., Quirke, P., Thomas, R. and Treanor, D. Working at the microscope: analysis ofthe activities involved in diagnostic pathology. Histopathology 60(3) pp.504-510which has been published in final form at 559.2011.04090.x/abstractAuthors: Rebecca Randella, Roy A. Ruddleb, Phil Quirkea, Rhys Thomasb and Darren TreanoracTitle: Working at the microscope: analysis of the activities involved in diagnostic pathologyAffiliations and addresses:aLeeds Institute of Molecular Medicine, University of Leeds, Wellcome Trust Brenner Building, St.James’s University Hospital, Leeds LS9 7TF, UKbSchool of Computing, University of Leeds, LS2 9JT, UKcSt. James’s University Hospital, Leeds Teaching Hospitals NHS TrustCorresponding author:Rebecca RandellEmail: r.randell@leeds.ac.ukTelephone: 0113 3438509Running title: Working at the microscopeKey words: histopathology, digital pathology, human-computer interaction
Aims: To study the current work practice of histopathologists in order to inform the design of digitalmicroscopy systems.Methods and results: 4 gastrointestinal histopathologists were video recorded as they undertooktheir routine work. Analysis of the video data shows a range of activities beyond viewing slidesinvolved in reporting a case. There is much overlapping of activities, supported by the ‘eyes free’nature of the pathologists’ interaction with the microscope. The order and timing of activities variesaccording to consultant.Conclusions: In order to adequately support the work of pathologists, digital microscopy systemsneed to provide support for a range of activities beyond viewing slides. Digital microscopy systemsshould support multitasking, while also providing flexibility so that pathologists can adapt their useof the technology to their own working patterns.2
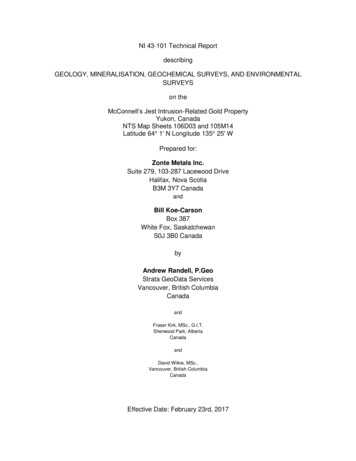
IntroductionTechnological advances mean that it is now possible to completely digitise glass slides and displaythem on a computer screen. While digital pathology was originally predominantly seen as a tool forremote primary diagnosis or expert referral,1 whole slide imaging (WSI) makes possible the use ofdigital slides for routine clinical practice.2 This could result in significant benefits in the delivery ofpatient care by, for example, enabling the streamlining of workflows.3 However, use of digitalpathology is currently largely restricted to education and external quality assessment (EQA)schemes, partly because of the current time cost associated with use of digital slides. One studyestimates that it takes 60% longer to perform diagnoses using digital slides.4We have been studying the work practice of histopathologists with the aim of developing a digitalmicroscope that allows diagnoses to be made as quickly as with a conventional microscope, makingit realistic to use digital pathology within routine clinical practice. A number of studies haveconsidered the process through which pathologists examine a slide using a microscope.5-8 However,to inform design, it is necessary to understand the work of diagnosis within its real-world context, anunderstanding not provided by existing studies. To address this, we have video recordedpathologists working at their microscopes in the context of their routine work. Our study sought toanswer the question ‘What happens at the microscope?’ by understanding how time at themicroscope is spent and how the various activities involved in working at the microscope areordered and interleaved.Materials and methodsData collectionFour consultant gastrointestinal pathologists working at Leeds Teaching Hospitals NHS Trustparticipated with approximately 2, 4, 10 and 20 years experience at consultant level.The pathologists were videoed in their offices undertaking their normal work. The video camera wasset up by the researcher at the beginning of the session and the researcher then left the room, withthe pathologist able to stop the video by remote control when they wanted. The video camera wasplaced on a tripod behind the pathologist, so as to give a view of the pathologist’s desk area,including the microscope, paperwork, glass slides, and computer (Figure 1). Each pathologist wasasked to record a reporting session lasting approximately one hour. A total of five hours and thirtyminutes of video were collected.3
[Figure 1 should be placed approximately here]In order to capture as realistically as possible the activities within the office, participants were askedto report cases in the usual way. The only exception to this was that two of the pathologists(Consultant 2 and Consultant 4) who normally use headsets with microphones to dictate were askedto report using a handheld dictaphone, in order to make it easier to identify when dictation wasoccurring. However, Consultant 2 continued reporting with a headset for practical reasons.AnalysisUsing Transana software, sections of video were indexed with descriptive codes, according to whatwas happening (e.g. viewing slides, dictating, looking at the clinical details). A ‘bottom up’ approachto coding was taken, determining appropriate codes as the analysis was conducted, as opposed toapplying predefined codes.9 The data from Transana were imported into Excel in order to analysethe amount and percentage of time spent in different activities for the reporting of each case thatwas video recorded.As the raw data showed considerable overlap between activities, two versions of the analysis wereundertaken. Firstly, we considered only what was determined to be the predominant activity(defined as the activity taking the primary focus of the participants’ attention) at any one time. Forexample, if the pathologist had viewed all the slides and then dictated his report while continuing tolook at one slide on the microscope, we treated dictation as the predominant activity. If whileviewing the slides on the microscope the pathologist made a momentary glance back to thepaperwork for the case, we considered viewing slides to be the predominant activity. We then reranthe analysis considering all activities occurring at any one time. This gives a better idea of the extentto which different resources (e.g. slides, paperwork) are used and referred to during reporting anddoes not rely on a subjective judgement of what is the predominant cognitive activity.FindingsA total of 41 cases were video recorded. Six were long cases (3-47 slides (median 6) of complexresections), 18 were short cases (1-13 slides (median 2) with simple diagnoses) and 17 weregastrointestinal biopsies (1-4 slides, median 2). There was variability in the type of cases reportedbetween participants, reflecting variation in the case mix of each consultant’s daily work. Consultant4
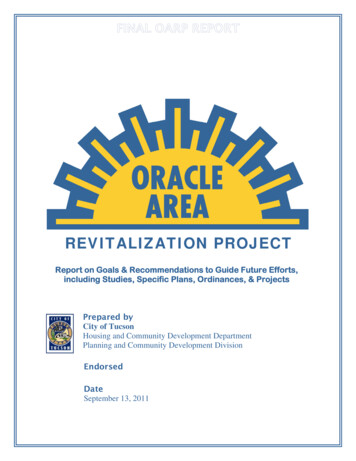
2 did not report any long cases, while all other consultants except from Consultant 4 reported onlyone long case. Only Consultants 1 and 3 reported all 3 case types.Time taken to complete a case varied from 1 minute 30 seconds to 56 minutes 19 seconds. Theaverage duration for a case was 7 minutes 17 seconds and the median was 8 minutes 20 seconds.However, the mean duration for a case varied according to the type of case. As could be expected,mean duration for long cases was significantly greater than for GI biopsy cases or short cases,although mean duration per slide was fairly consistent (see Figure 2).[Figure 2 should be placed approximately here]How time was spentBased on analysis of the predominant activity, the majority of the pathologists’ time was spentviewing slides, accounting for 57% of the time (see Table 1). The other main activity was dictatingreports, accounting for 22% of the pathologists’ time. The pathologists performed various otheractivities as part of completing a case which, while they did not take up a significant amount of thepathologists’ time, occurred frequently throughout the cases. A frequently observed activity wasthat of making handwritten notes, accounting for 4% of the pathologists’ time. On completing thecase, all pathologists recorded the diagnosis on the front of the request form. However, there werevarious other forms of handwritten notes: underlining of details on the paperwork prior to viewingthe slides, notes made on the clinical details and on pads of paper while looking at the slides,presumably to support the subsequent dictating of the report, and notes on post-it notes thenplaced on the tray of slides, possibly requesting a second opinion from a colleague. Annotating slidesaccounted for 3% of the pathologists’ time. This activity occurred either before viewing the slide inorder to assist navigating between different islands of tissue, while the slide was on the microscopeto highlight features of interest, or after having viewed the slide. Referring to paperwork accountedfor only 2% of the pathologists’ time but was very much interspersed with other activities, occurringa total of 94 times and ranging from a momentary glance lasting less than two seconds to just over 2minutes.[Table 1 should be placed approximately here]When the total effort is considered, rather than just the predominant activity, the proportion of timespent on each activity is broadly similar. However, there is a notable difference in proportion of time5
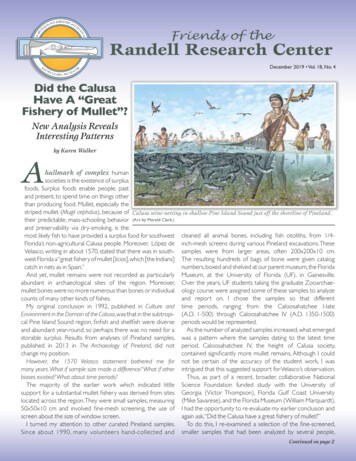
spent in referring to paperwork, increasing from 2% to 13%, indicating that referring to paperwork isa task that is frequently done while also undertaking other activities. This is discussed further below.How time was spent varied according to case type (see Table 2). Based on analysis of overlappingactivity, for short cases the proportion of time spent viewing slides was greater but a smallerproportion of time was spent annotating slides and no time was spent filling in forms. Time spentdictating varied, with a smaller proportion of time spent dictating long cases. With the long cases,the proportion of time spent in other activities (such as annotating slides and referring to books)increased.[Table 2 should be placed approximately here]How time was spent also varied according to the consultant. The proportion of time spent viewingslides, based on analysis of overlapping activity, varied from 58% to 77%, while time spent dictatingvaried from 17% to 33%. Consultant 2 did not use the computer at all, possibly undertaking all workat the computer either before or after the reporting session. Elsewhere we have highlighted the wayin which some consultants choose to integrate the work at the computer and at the microscope,while others keep these two aspects of their work quite separate.10 Consultant 2 has a practice ofkeeping a notebook with the reference number and diagnosis of every case she sees, and as a resultshe spent 13% of her time making notes.Overlapping of activitiesReferring to paperwork, using the computer, and dictating the report are the activities that mostfrequently occurred while another activity was being undertaken (see Table 3). Referring topaperwork most commonly overlapped with dictation, as the pathologists would read from theclinical details on the paperwork when beginning their reports (see Table 4). Dictation mostcommonly overlapped with viewing the slide and referring to paperwork. The extract from thetimeline for Consultant 3 illustrates the overlapping of these three activities (see Figure 3). Using thecomputer most commonly overlapped with referring to paperwork, as the pathologists would usethe accession number recorded on the paperwork in order to find the patient’s details on thelaboratory information system.[Table 3 should be placed approximately here]6
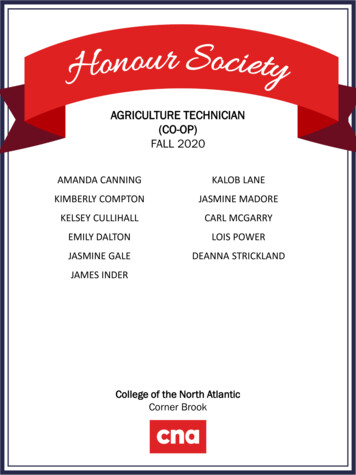
[Table 4 should be placed approximately here][Figure 3 should be placed approximately here]Order of activitiesThe timelines show how dictation and paperwork are interspersed with viewing slides (Figures 3 –5). Different patterns concerning when dictation began, and how it was interspersed with viewingslides, were observed. Consultant 1 dictated at the beginning and end of reporting each case,referring to the paperwork while dictating the clinical details at the beginning of reporting a case andlooking at the slides when dictating at the end of reporting a case (see Figure 4). Like Consultant 1,Consultant 2 dictated at the beginning reporting each case, referring to the paperwork whiledictating the clinical details, but then continued to move between viewing the slides and dictating(see Figure 5). In contrast, Consultants 3 and 5 tended to dictate only at the end of reporting a case(see Figure 3). The extract from the timeline for Consultant 3 also shows him repeatedly returning tothe paperwork, in contrast to the pattern of Consultants 1 and 2.[Figure 4 should be placed approximately here][Figure 5 should be placed approximately here]Interaction featuresApparent from the videos was the ‘eyes free’ nature of the pathologists’ interaction with themicroscope. The pathologists controlled the microscope, in terms of navigating the slide, changingmagnification, and focusing, without looking at what they were doing, allowing them to keep theirvisual attention focused on the slide. They also frequently placed the slide on the microscope or tookit off the microscope without looking at what they were doing. This supports multitasking, allowingthem, for example, to be referring to the paperwork while placing the slide on the microscope or tobe looking at the next slide in the tray while taking the slide off the microscope.While the ‘eyes free’ nature of the interaction allowed the pathologists to focus on viewing the slide,the videos showed the pathologists frequently moving from viewing the slide through themicroscope and glancing elsewhere, such as to refer to paperwork, before returning to the view theslide again. In talking to pathologists about the use of the microscope, often mentioned is the senseof immersion that the microscope provides, that it is just ‘them and the slide’. In fact, the videos7
suggest that pathologists frequently switch between being immersed in a slide and referring to othermedia.DiscussionImplications for designThe findings highlight the range of activities involved in reporting a case, of which the viewing ofslides is only one. Viewing slides is the predominant activity for only 57% of the pathologists’ time.When considering not only reporting time, this figure is likely to be a overestimation, due to theamount of time that is spent organising and prioritising cases prior to reporting.10 The implication ofthis is that digital microscopy systems should support not just the viewing of digital slides but alsothe other activities that are interweaved with that work. When viewing slides is the predominantactivity for only 57% of the pathologists’ time, it limits the amount of time savings that can be madesimply through improving the speed with which the pathologist is able to view the slide. If theadditional activities are not taken into account and supported, we run the risk that any time savingsin the time taken to view a slide will be outweighed by extra time taken in carrying out thesurrounding activities.Presently, pathologists use a microscope and a computer, as well as referring to a number of paperbased media, which has inherent expense and inefficiency. Apparent from looking at the findings ishow many of the activities involved in reporting a case could easily be transferred to the computer.While use of the computer as a predominant activity only takes up 4% of the pathologists’ time, withthe move to electronic patient records, we can imagine that referring to paperwork and filling inrequests for additional work will in the future be computer-based. Similarly, use of digital dictation isincreasing. Such changes would mean that for 43% of the time pathologists will be using, or at leastreferring to information held on, the computer. Thus, additional benefits of digital pathology are theamalgamation of two tools into one and the removal of paper-based processes.The findings highlight that there is much overlapping of activities and that pathologists need to beable to refer to other media while viewing slides. Of particular importance is the provision of supportfor both dictating and referring to paperwork while viewing slides. The way in which the microscopeenables the pathologists to easily move between being immersed in viewing the slide and not raisesthe question of what information should be displayed on a digital microscope and the layout andnature of the display. While the obvious solution is to provide all information relating to a case viathe display, this may negatively impact the pathologist’s ability to be completely focused on the8
slide. An alternative is to have multiple displays, one for viewing slides and one for accessing otherinformation relating to the case, as is currently done in radiology.11 The potential and impact of arange of approaches should be explored experimentally.The ease with which pathologists interact with the microscope suggests that, for digital microscopysystems to be acceptable to pathologists, they should allow the same or a similar level of ease ofuse. Like the ‘eyes free’ interaction with the microscope, digital microscopy systems should allow thepathologist to remain focused on the task, rather than focusing their attention on interacting withthe technology. At the same time, the different patterns of working suggest the need for digitalmicroscopy systems that are flexible, that pathologists are able to adapt to suit their practice.LimitationsThe findings presented here provide an understanding of the pathologist’s work at the microscope,in terms of the activities that make up ‘working at the microscope’ and the artefacts used to supportthat work. The methods used allowed us to capture naturalistic data with minimum disruption forthe participants. What the use of video did not allow us to do was to capture some of the detail ofwhat was happening, such as exactly what element of the paperwork they were referring to and thenature of the notes being made and the annotations on slides, nor the participants’ perspective onwhat they were doing and why, and thus we have had to make assumptions about such details. Wehave subsequently gone on to carry out naturalistic observations, sitting with pathologists in theiroffice as they undertake their work, in order to gather such detail. This has been reportedelsewhere.10AcknowledgementsWe would like to thank the pathologists at Leeds Teaching Hospitals NHS Trust who enabled us toundertake this work by agreeing to participate in the study. This report is independent researchcommissioned by the National Institute for Health Research. The views expressed in this publicationare those of the author(s) and not necessarily those of the NHS, the National Institute for HealthResearch or the Department of Health. The authors acknowledge the support of the NationalInstitute for Health Research, through the Comprehensive Clinical Research Network.Competing interestsNone to declareReferences1.Wells CA, Sowter C. Telepathology: a diagnostic tool for the millennium? The Journal ofPathology 2000;191;1-7.2.Leong FJW-M, McGee JOD. Automated complete slide digitization: a medium forsimultaneous viewing by multiple pathologists. The Journal of Pathology 2001;195;508-514.9
3.Gilbertson J, Yagi Y. Histology, imaging and new diagnostic work-flows in pathology.Diagnostic Pathology 2008;3;S14.4.Treanor D, Quirke P. The virtual slide and conventional microscope - a direct comparison oftheir diagnostic efficiency. Annual Meeting of the Pathological Society of Great Britain and Ireland.Glasgow, 2007.5.Crowley RS, Naus GJ, Stewart J, III, Friedman CP. Development of Visual Diagnostic Expertisein Pathology - An Information-processing Study. J Am Med Inform Assoc 2003;10;39-51.6.Krupinski EA, Tillack AA, Richter L et al. Eye-movement study and human performance usingtelepathology virtual slides. Implications for medical education and differences with experience.Human Pathology 2006;37;1543-1556.7.Tiersma ESM, Peters AAW, Mooij HA, Fleuren GJ. Visualising scanning patterns ofpathologists in the grading of cervical intraepithelial neoplasia. J Clin Pathol 2003;56;677-680.8.Treanor D, Lim CH, Magee D, Bulpitt A, Quirke P. Tracking with virtual slides: a tool to studydiagnostic error in histopathology. Histopathology 2009;55;37-45.9.Miles MB, Huberman AM. Qualitative data analysis: an expanded sourcebook. 2nd ed. ed.Thousand Oaks, California: SAGE Publications, 1994.10.Randell R, Ruddle RA, Thomas R, Treanor D. Diagnosis at the microscope: a workplace studyof histopathology. Cognition, Technology & Work In press.11.Krupinski EA. Virtual slide telepathology workstation of the future: lessons learned fromteleradiology. Human Pathology 2009;40;1100-1111.10
ActivityDescriptionTotalTotal timenumber of (hh:mm:ss)occurrences basedonpredominantactivityViewingUsing a microscope to look20902:51:18slideat the glass slideDictationDictating a mputer Referring to or using a2000:14:05computer, typically to viewprevious reports from thesame patient or to viewthemacroscopicdescriptionNotesMaking notes about a6500:11:56case, either on thespecimen requisition formor on a notepadAnnotating Making marks on a slide5600:08:05with a felt tip pen, typicallyto indicate the contents ofthe slide before viewing ortorecorddiagnosticinformation after viewingBookReferring to a reference500:05:55textbookPaperwork Reading the clinical details9400:05:17and macroscopic specimendescriptiononthespecimen acquisition formFillingCompleting a paper-based900:04:55formsform, most frequentlylaboratory work vity57%Proportionoftimebased onall activity22%22%4%6%4%5%3%3%2%2%2%13%2%2%66%Table 1: How time was spent, based on analysis of predominant activity and overlapping activity11
ActivityLongShortGI biopsyOverallRange (%)OverallRange (%)OverallRange (%)(%)(%)(%)Viewing 3-14100-31174-57Filling forms10-500-040-17Table 2: How time was spent, according to case type, based on analysis of overlapping activity12
ActivityUndertaken whilemultitasking (%)Paperwork85Computer78Dictation64Filling forms49Annotation32Notes15Viewing slide14Book9Table 3: Proportion of time activities undertaken while participant was multitasking13
ActivityOverlap withpaperworkOverlap illing forms34%15%Annotation18%0%Notes5%0%Viewing slide1%0%Book0%0%Table 4: Proportion of time activities overlappedOverlap withdictation43%8%0%1%4%12%5%Overlap withfilling forms5%5%0%0%0%0%0%Overlap withannotationOverlapwith notes5%0%0%0%0%1%0%2%0%1%0%0%1%0%Overlap withviewing slide5%0%39%0%13%8%5%Overlapwith book0%0%0%0%0%0%0%-
Figure 1: Still from video camera of one of the participants during a reporting session
Figure 2: Mean duration according to case type, with duration per slide calculated by dividing caseduration by number of slides (error bars represent the standard deviation)16
Figure 3: Extract from timeline for Consultant 317
Figure 4: Extract from timeline for Consultant 118
Figure 5: Extract from timeline for Consultant 219
pathologists working at their microscopes in the context of their routine work. Our study sought to . Four consultant gastrointestinal pathologists working at Leeds Teaching Hospitals NHS Trust participated with approximately 2, 4, 10 and 20 years experience at consultant level. The pathologists were videoed in their offices undertaking their .