Transcription
Atlanta MetroSentinel Community Site (SCS)Drug Use Patterns and Trends, 2016October 2016NDEWS Coordinating CenterNDEWS is funded under NIDA Cooperative Agreement DA038360 awarded to the Center for Substance Abuse Research (CESAR)at the University of Maryland, College Park. Opinions expressed in this report may not represent those of NIH or NIDA.
Sentinel Community Site (SCS) LocationsSentinel Community Epidemiologists (SCEs)Atlanta MetroBrian J. Dew, PhDDepartment of Counseling andPsychological ServicesGeorgia State UniversityPhone: 404-413-8168bdew@gsu.eduChicago MetroLawrence J. Ouellet, PhDSchool of Public HealthUniversity of Illinois at ChicagoPhone: 312-355-0145ljo@uic.eduDenver MetroCindy Laub, PhDOffice of Behavioral Health StrategiesCity and County of DenverPhone: 720-944-1148cindy.laub@denvergov.orgWayne County (Detroit Area)Cynthia L. Arfken, PhDDepartment of Psychiatry andBehavioral NeurosciencesWayne State UniversityPhone: 313-993-3490cynthia.arfken@wayne.eduLos Angeles CountyMary-Lynn Brecht, PhDIntegrated Substance Abuse ProgramsUniversity of California at Los AngelesPhone: 310-267-5275lbrecht@ucla.eduMaineMarcella H. Sorg, PhD, RNRural Drug and Alcohol ResearchProgramUniversity of MainePhone: 207-581-2596mhsorg@maine.eduSoutheastern Florida (Miami Area)James N. Hall, BACenter for Applied Research onSubstance Use and Health DisparitiesNova Southeastern UniversityPhone: 786-547-7249upfrontin@aol.comNew York CityDenise Paone, EdDBureau of Alcohol and Drug UsePrevention, Care and TreatmentNew York City Department of Healthand Mental HygienePhone: 347-396-7015dpaone@health.nyc.govPhiladelphiaSuet T. Lim, PhDCity of PhiladelphiaDepartment of Behavioral Health andIntellectual disAbility ServicesCommunity Behavioral HealthPhone: 215-413-7165suet.lim@phila.govSan FranciscoPhillip O. Coffin, MD, MIASan Francisco Department of PublicHealthPhone: 415-437-6282phillip.coffin@sfdph.orgKing County (Seattle Area)Caleb Banta-Green, MSW, MPH, PhDAlcohol and Drug Abuse InstituteUniversity of WashingtonPhone: 206-685-3919calebbg@u.washington.eduTexasJane C. Maxwell, PhDSchool of Social WorkThe University of Texas at AustinPhone: 512-656-3361jcmaxwell@austin.utexas.edu
National Drug Early Warning System (NDEWS)Sentinel Community Site (SCS)Drug Use Patterns and Trends, 2016The National Drug Early Warning System (NDEWS) was launched in 2014 with the support of theNational Institute on Drug Abuse (NIDA) to collect and disseminate timely information about drugtrends in the United States. The Center for Substance Abuse Research (CESAR) at the University ofMaryland manages the NDEWS Coordinating Center and has recruited a team of nationallyrecognized experts to collaborate on building NDEWS, including 12 Sentinel CommunityEpidemiologists (SCEs). The SCEs serve as the point of contact for their individual SentinelCommunity Site (SCS), and correspond regularly with NDEWS Coordinating Center staffthroughout the year to respond to queries, share information and reports, collect data andinformation on specific drug topics, and write an annual SCE Narrative describing trends andpatterns in their local SCS.This Sentinel Community Site Drug Use Patterns and Trends report contains three sections: The SCS Snapshot, prepared by Coordinating Center staff, contains graphics that displayinformation on drug use, substance use disorders and treatment, drug poisoning deaths,and drug seizures. The SCS Snapshots attempt to harmonize data available for each of the12 sites by presenting standardized graphics from local treatment admissions and fournational data sources. The SCE Narrative, written by the SCE, provides their interpretation of important findingsand trends based on available national data as well as sources specific to their area, suchas data from local medical examiners or poison control centers. As a local expert, the SCEis able to provide context to the national and local data presented. The SCS Data Tables, prepared by Coordinating Center staff, include information ondemographic and socioeconomic characteristics of the population, drug use, substanceuse disorders and treatment, drug poisoning deaths, and drug seizures for the SentinelCommunity Site. The SCS Data Tables attempt to harmonize data available for each of the12 sites by presenting standardized information from local treatment admissions and fivenational data sources.The Sentinel Community Site Drug Use Patterns and Trends reports for each of the 12 SentinelCommunity Sites and detailed information about NDEWS can be found on the NDEWS website atwww.ndews.org.Atlanta Metro SCS Drug Use Patterns and Trends, 20161
National Drug Early Warning System (NDEWS)Sentinel Community Site (SCS)Drug Use Patterns and Trends: SCS SnapshotThe SCS Snapshot is prepared by NDEWS Coordinating Center staff and contains graphics thatdisplay information on drug use, substance use disorders and treatment, drug poisoning deaths,and drug seizures. The SCS Snapshots attempt to harmonize data available for each of the 12sites by presenting standardized graphics from local treatment admissions and four national datasources: National Survey on Drug Use and Health;Youth Risk Behavior Survey;SCE-provided local treatment admissions data;National Vital Statistics System mortality data queried from CDC WONDER; andNational Forensic Laboratory Information System.The SCS Snapshots for each of the 12 Sentinel Community Sites and detailed information aboutNDEWS can be found on the NDEWS website at www.ndews.org.Atlanta Metro SCS Drug Use Patterns and Trends, 20162
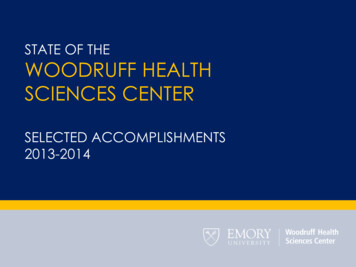
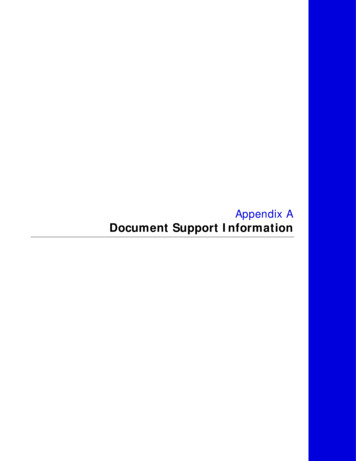
Atlanta Metro SCS Snapshot, 2016Substance UseNational Survey on Drug Use and Health (NSDUH): Survey of U.S. Population*Persons 12 Years Reporting Selected Substance Use, Atlanta Region , 2012-2014Estimated Percent, 95% Confidence Interval, and Estimated Number of Persons**BingeAlcohol***19%Marijuana8%Illicit Drugother thanMarijuana4%94,212Nonmedicaluse ofPain %65%70%*U.S. Population: U.S. civilian non-institutionalized population. Atlanta Region: NSDUH Region 3 (Clayton, DeKalb, Fulton, Gwinnett, Newton, and Rockdalecounties). **Estimated Number: Calculated by multiplying the prevalence rate and the population estimate of persons 12 years (2,431,810) from Table C1 of theNSDUH Report. ***Binge Alcohol: Defined as drinking five or more drinks on the same occasion.Source: Adapted by the NDEWS Coordinating Center from data provided by SAMHSA, NSDUH. Annual averages based on combined 2012 to 2014 NSDUH data.Youth Risk Behavior Survey (YRBS): Survey of Student PopulationPublic High School Students Reporting Lifetime (LT) Use of Selected Substances, Georgia , 20131Estimated Percent and 95% Confidence IntervalLT Alcohol Use59%LT MarijuanaUse36%LT Cocaine Use7%LT Inhalants Use10%LT MDMA UseSubstance use increased from 2011†7%Substance use decreased from 2011†LT Rx Drug 2013: 2015 YRBS data not available for Atlanta or Georgia so 2013 Georgia data are presented. Georgia: Data not available for Atlanta so data for State of Georgia provided.*LT Rx Drug Use: Defined as ever took prescription drugs without a doctor’s prescription.†Statistically significant change: p 0.05 by t-test.Source: Adapted by the NDEWS Coordinating Center from data provided by CDC, 2001-2013 high school YRBS data.1Atlanta Metro SCS Drug Use Patterns and Trends, 2016375%
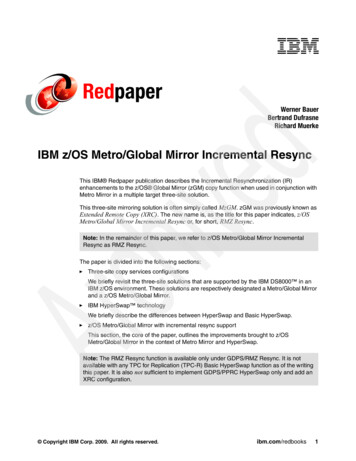
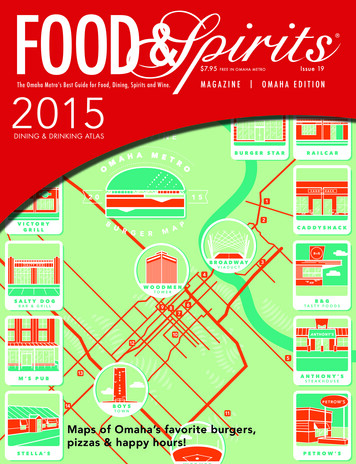
Substance Use Disorders and TreatmentNational Survey on Drug Use and Health (NSDUH): Survey of U.S. Population*Substance Use Disorders** in Past Year Among Persons 12 Years, Atlanta Region , 2012-2014Estimated Percent, 95% Confidence Interval, and Estimated Number of Persons***Illicit Drugs orAlcohol8%Alcohol6%Illicit 0%45%50%*U.S. Population: U.S. civilian non-institutionalized population. **Substance Use Disorders in Past Year: Persons are classified as having a substance use disorder inthe past 12 months based on responses to questions that meet the criteria specified in the 4th edition of the Diagnostic and Statistical Manual of Mental Disorders(DSM-IV). Atlanta Region: NSDUH Region 3 (Clayton, DeKalb, Fulton, Gwinnett, Newton, and Rockdale counties). ***Estimated Number: Calculated by multiplyingthe prevalence rate and the population estimate of persons 12 years (2,431,810) from Table C1 of the NSDUH Report.Source: Adapted by the NDEWS Coordinating Center from data provided by SAMHSA, NSDUH. Annual averages based on combined 2012 to 2014 NSDUH data.Treatment Admissions Data from Local SourcesTrends in Treatment Admissions*, by Primary Substance of Abuse, Atlanta MSA , 2011-2015(n Number of Treatment aineMethamp.Heroin750500Rx Opioids25002011(n 9,367)2012(n 9,000)2013(n 8,911)2014(n 8,384)2015(N/A)Demographic Characteristics of Treatment Admissions*, Atlanta MSA , 2014Cocaine(n 845)Methamp.(n 736)Heroin(n 631)Rx Opioids(n 467)AGESEXMarijuana(n % 3%93%77%85%19% 4%12%3%White, Non-Hisp.MaleFemaleUnder 26 yrs.26-44 yrs.45 yrs.African-Am. /Black, Non-Hisp.OtherCalendar year data is not available for the Atlanta MSA SCS at this time. 2011-2014 treatment admissions data is from last year’s (2015) Snap Shot.*Treatment Admissions: Includes admissions to publicly-funded programs. Atlanta MSA: Includes the following 29 counties; Barrow, Bartow, Butts, CarrollCherokee, Clayton, Cobb, Coweta, Dawson, DeKalb, Douglas, Fayette, Forsyth, Fulton, Gwinnet, Haralson, Heard, Henry, Jasper, Lamar, Meriwether, Morgan,Newton, Paulding, Pickents, Pike Rockdale, Spalding, and Walton. **Marijuana: The data does not differentiate between marijuana and synthetic cannabinoids.See Sentinel Community Site (SCS) Data Tables and Overview & Limitations section for more information regarding the data.Source: Data provided to the Atlanta Metro NDEWS SCE by the Georgia department of Human Services.Atlanta Metro SCS Drug Use Patterns and Trends, 20164
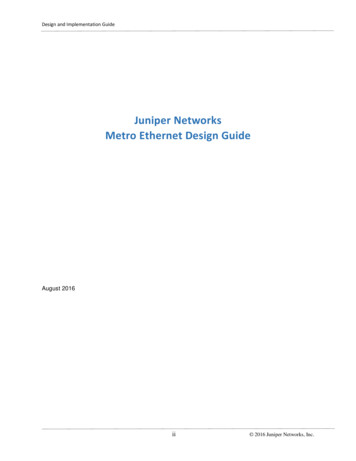
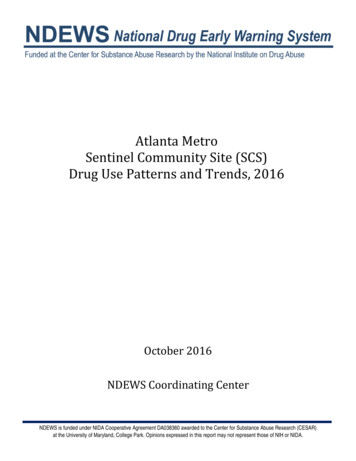
Drug Overdose (Poisoning) DeathsNational Vital Statistics System (NVSS) via CDC WONDERTrends in Drug Overdose (Poisoning) Deaths*, by Drug**, Atlanta MSA , 2010–2014(Number of Deaths and Percent of Drug Overdose (Poisoning) Deaths with Drug(s) Specified )900800Drug Overdose zepinesCocainePsychostimulants10002010(78.2%) 2011(73.6%) 2012(76.6%) 2013(76.4%) 2014(83.0%) Trends in Opioid Overdose (Poisoning) Deaths*, by Opioid, Atlanta MSA , 2010–2014(Number of Deaths, by Drug** and Percent of Drug Overdose (Poisoning) Deaths with Drug(s) Specified )900Any OpioidsHeroinNatural Opioid AnalgesicsMethadoneSynthetic Opioid Analgesics8007006005004003002001000SUP2010(78.2%) 2011(73.6%) 2012(76.6%) 2013(76.4%) 2014(83.0%) *Drug Overdose (Poisoning) Deaths: Defined as deaths with ICD-10 underlying cause-of-death (UCOD) codes: X40-X44, X60-X64, X85, and Y10-Y14. **Drug Overdose(Poisoning) Deaths, by Drug: Drug overdose (poisoning) deaths with ICD-10 multiple cause-of-death (MCOD) T-codes: Benzodiazepines (T42.4); Cocaine (T40.5);Psychostimulants with Abuse Potential [excluding cocaine] (T43.6)—may include amphetamines, caffeine, MDMA, methamphetamine, and/or methylphenidate; AnyOpioids (T40.0-T40.4, OR T40.6). Specific opioids are defined: Opium (T40.0); Heroin (T40.1); Natural Opioid Analgesics (T40.2)—may include morphine, codeine,and semi-synthetic opioid analgesics, such as oxycodone, hydrocodone, hydromorphone, and oxymorphone; Methadone (T40.3); Synthetic Opioid Analgesics[excluding methadone] (T40.4)—may include drugs such as tramadol and fentanyl; and Other and Unspecified Narcotics (T40.6). Atlanta MSA: Comprised ofBarrow, Bartow, Butts, Carroll, Cherokee, Clayton, Cobb, Coweta, Dawson, DeKalb, Douglas, Fayette, Forsyth, Fulton, Gwinnett, Haralson, Heard, Henry, Jasper,Lamar, Meriwether, Morgan, Newton, Paulding, Pickens, Pike, Rockdale, Spalding, and Walton Counties. Percent of Drug Overdose (Poisoning) Deaths with Drug(s)Specified: The percentage of drug overdose (poisoning) deaths with specific drugs mentioned varies considerably by state/catchment area. This statistic describesthe annual percentage of drug overdose (poisoning) deaths that include at least one ICD-10 MCOD code in the range T36-T50.8. SUP Suppressed: Counts aresuppressed for subnational data representing 0–9 deaths. See Sentinel Community Site (SCS) Data Tables and/or Overview & Limitations for additional informationon mortality data.Source: Adapted by the NDEWS Coordinating Center from data provided by the Centers for Disease Control and Prevention (CDC), National Center for HealthStatistics, Multiple cause of death 1999-2014, available on the CDC WONDER Online Database, released 2015. Data compiled in the Multiple cause of death 19992014 were provided by the 57 vital statistics jurisdictions through the Vital Statistics Cooperative Program. Retrieved between December 2015 - May 2016, fromhttp://wonder.cdc.gov/mcd-icd10.htmlAtlanta Metro SCS Drug Use Patterns and Trends, 20165
Law Enforcement Drug SeizuresNational Forensic Laboratory Information System (NFLIS)Drug Reports* for Items Seized by Law Enforcement in the Atlanta MSA in 2015DEA National Forensic Laboratory Information System (NFLIS)Top 10 Drug Reports and Selected Drug CategoriesDrug IdentifiedNumber (#)Percent ofTotal DrugReports (%)17,815100%TOTAL Drug ReportsTop 10 Drug nspecified annabis3802.1%Amphetamine2241.3%Top 10 Total15,91689.3%2,86316.1%490.3%Other Fentanyls***2 0.1%Synthetic Cathinones5603.1%Synthetic .1%2C Phenethylamines180.1%Top 5 Drugs, by Selected Drug Category(% of Category)**Synthetic Cathinones(n 560)Ethylone (86%)alpha-PVP (6%)Methylone (4%)4-FMC; Flephedrone (0.9%)Dibutylone (0.9%)Other (2%)Synthetic Cannabinoids(n 148)XLR-11 (45%)AB-CHIMINACA (26%)5-Fluoro AMB (7%)AB-FUBINACA (7%)Other (16%)Selected Drugs/Drug CategoriesOpioidsFentanylPiperazines(n 43)TFMPP (47%)1-(2-Fluorophenyl)Piperazine (23%)mCPP (21%)BZP (9%)*Drug Reports: Drug that is identified in law enforcement items, submitted to and analyzed by federal, state, or local forensic labs, and included in the NFLIS database.The NFLIS database allows for the reporting of up to three drugs per item submitted for analysis. The data presented are a total count of first, second, and third listedreports for each selected drug item seized and analyzed. Atlanta MSA: Includes the following 29 counties--Barrow, Bartow, Butts, Carroll, Cherokee, Clayton, Cobb, Coweta, Dawson, DeKalb, Douglas, Fayette, Forsyth, Fulton,Gwinnett, Haralson, Heard, Henry, Jasper, Lamar, Meriwether, Morgan, Newton, Paulding, Pickents, Pike, Rockdale, Spalding, and Walton.**Percentages may not sum to 100 due to rounding. ***Other Fentanyls are substances that are structurally related to fentanyl (e.g., acetylfentanyl and butyrlfentanyl). See Notes About Data Terms in Overview and Limitations section for full list of Other Fentanyls that were reported to NFLIS during the January to December2015 timeframe. See Sentinel Community Site (SCS) Data Tables and Overview & Limitations for more information regarding the data.Source: Adapted by the NDEWS Coordinating Center from data provided by the U.S. Drug Enforcement Administration (DEA), Diversion Control Division, Drug andChemical Evaluation Section, Data Analysis Unit. Data were retrieved from the NFLIS Data Query System (DQS) on May 18, 2016.Atlanta Metro SCS Drug Use Patterns and Trends, 20166
National Drug Early Warning System (NDEWS)Sentinel Community Site (SCS)Drug Use Patterns and Trends: SCE NarrativeThe SCE Narrative is written by the Sentinel Community Epidemiologist (SCE) and providestheir interpretation of important findings and trends based on available national data aswell as sources specific to their area, such as data from local medical examiners or poisoncontrol centers. As a local expert, the SCE is able to provide context to the national andlocal data presented.This SCE Narrative contains the following sections: SCS HighlightsChanges in LegislationSubstance Use Patterns and TrendsLocal Research Highlights (if available)Infectious Diseases Related to Substance Use (if available)The SCE Narratives for each of the 12 Sentinel Community Sites and detailed informationabout NDEWS can be found on the NDEWS website at www.ndews.org.Atlanta Metro SCS Drug Use Patterns and Trends, 20167
National Drug Early Warning System (NDEWS)Atlanta Metro Sentinel Community Site (SCS)Drug Use Patterns and Trends, 2016: SCE NarrativeBrian J. Dew, Ph.D., and Ned Golubovic, M.S.Georgia State UniversityHighlights Numerous indicators suggest that alprazolam is the primary benzodiazepine abused in metropolitan Atlanta andthroughout Georgia. It is the benzodiazepine most frequently detected in Georgia Poison Control calls, GeorgiaMedical Examiner results, Fulton County Medical Examiner results, and ethnographic reports with users. Conversations with local users indicate an increase in the supply of, and demand for, liquid alprazolam. Although“super pills” have caused deaths in Florida and have been confiscated in Kentucky and Tennessee in 2016, thiscombination of alprazolam and fentanyl has not been reported in the Atlanta metropolitan statistical area (MSA). Compared with the previous two years, the availability of, and purity and pricing for, cocaine hydrochloride andcrack/cocaine in Atlanta remained stable in 2015. The majority of cocaine in Atlanta continues to be Colombian,and the City remains a primary hub for distribution along the East Coast. Although the supply of and demand for cocaine remains stable, deaths related to the drug’s use increased morethan 33% both in Atlanta and throughout Georgia in 2015 versus deaths in 2013. Local ethnographic reports suggest an increased demand for higher quality marijuana and tetrahydrocannabinol(THC)-based liquids, with the latter being increasingly smoked in vapor pens and e-cigarettes. Multiple data sources indicate increased supply of methamphetamine in Atlanta with elevated average puritylevels of between 85% and 90%. Increased purity levels of methamphetamine have led to more deaths both inAtlanta and throughout Georgia. Two large seizures of methamphetamine totaling more than 18 million in street value were made in the Atlantasuburbs in 2015. Law enforcement officials confiscated more than 65 gallons of liquid methamphetamine at thesetwo “conversion labs.” The types and amounts of synthetic cathinones available in Atlanta continue to change with the influx of ethylonein 2015. In South Georgia, law enforcement and public health officials indicate an increasing amount of alpha-PVP(Flakka) entering the State via Florida. Heroin use in Atlanta continues to increase. Calls into Georgia Poison Control have doubled in the past three years,and multiple death-related data (drug poisoning, Georgia Medical Examiner, and Fulton County Medical Examiner)suggest over a 100% surge in heroin-related fatalities in 2015 compared with 2013. From conversations with local HIDTA and law enforcement officials, Atlanta is increasingly being considered aprimary distribution center for heroin.Atlanta Metro SCS Drug Use Patterns and Trends, 20168
Changes in LegislationIn April 2014, a bill authorizing Georgia practitioners, including medical professionals and pharmacists,to begin issuing prescriptions for opioid antagonists (naloxone) was passed. Under this law, opioidantagonist prescriptions do not have to be issued to a particular person. Rather, practitioners areallowed to prescribe an opioid antagonist in the name of an organization, clinic, or law enforcementagency. For example, practitioners can prescribe naloxone to harm reduction organizations, painmanagement clinics, and police and fire departments. Additionally, practitioners can now prescribethese medications to family members, friends, or other persons in a position to assist a person at risk ofexperiencing an opioid-related overdose.On April 2015, the Haleigh’s Hope Act, a bill regulating medical marijuana use in the state of Georgia,went into effect. This law permits the therapeutic and treatment application of cannabis and itsderivatives. Such therapeutic and treatment applications include consumption of cannabis as liquid, pill,injection, or other delivery system that does not include smoking. Although, this law decriminalizedpossession of cannabis for certain qualified individuals, it did not legalize the production or sales ofmarijuana in the state of Georgia. To qualify for exemption from prosecution for possession ofmarijuana in Georgia, the patient must suffer from one of these qualifying illnesses: cancer, amyotrophiclateral sclerosis (ALS), seizure disorders, multiple sclerosis, Crohn’s disease, mitochondrial disease,Parkinson’s disease, or sickle cell disease.During the 2016 legislative session, a medical marijuana expansion bill was introduced. This legislationintended to legalize in-state medical marijuana cultivation for up to five licensed producers. This billpassed the Georgia House of Representatives and was moved to the Senate with slight modification.Nevertheless, the bill was held by the Senate Health and Human Services Committee and did not get ahearing.Substance Use Patterns and TrendsBENZODIAZEPINES Numerous indicators suggest that alprazolam is the primary benzodiazepine abused inmetropolitan Atlanta and throughout Georgia. It is the benzodiazepine most frequentlydetected in Georgia Poison Control calls, Georgia Medical Examiner results, Fulton CountyMedical Examiner results, and ethnographic reports with users. Conversations with local users indicate an increase in the supply of, and demand for, liquidalprazolam. Although “super pills” have caused deaths in Florida and have been confiscated inAtlanta Metro SCS Drug Use Patterns and Trends, 20169
Kentucky and Tennessee in 2016, this combination of alprazolam and fentanyl has not beenreported in the Atlanta metropolitan statistical area (MSA).The supply, use of, and demand for benzodiazepines remained mostly stable in metropolitan Atlanta in2015. Alprazolam continued to be the preferred benzodiazepine, followed by diazepam, and lorazepam.Statewide mortality data from 2007 to 2011 indicated significant increases in deaths withbenzodiazepines on board at time of death. Nevertheless, since 2011, this prevalence has stabilized.Similar trends were also found among benzodiazepine-related deaths in Fulton County during the pastfour years. As indicated in Exhibit 1, the number of benzodiazepine-related drug poisoning calls inAtlanta during 2015 increased nearly 10% after four years of stable trends.Exhibit 1. Drug Poisoning Calls in Metropolitan Atlanta by Select Drug Cocaine2014Heroin2015MethSource: Georgia Poison Control Call Volume DatabaseResults from ethnographic reporting indicated a growing supply of, and preference for, liquidalprazolam, which could be purchased for between 2 and 3 per milliliter in metropolitan Atlanta.Retail pricing for 1-milligram “blue footballs” (nickname commonly used to describe a 1-mL dose ofalprazolam in pill form) in Atlanta remained consistent at between 2 and 4, whereas 2-mg alprazolambars cost between 5 and 10. Although “super pills,” consisting of both alprazolam and fentanyl, werefound in Florida, Kentucky, Tennessee, and Ohio in late 2015 and early 2016, law enforcement officialshave not discovered this combination in Atlanta.Atlanta has witnessed a recent increase in public attention related to illicit use of benzodiazepines. InMarch 2016, a three-year investigation culminated in the arrest and firing of two pharmacists and threetechnicians at a prominent, university-affiliated hospital located in Midtown Atlanta. These arrestsinvolved illegally ordering large amounts of alprazolam and illegally selling the product on Atlanta’sstreets.Atlanta Metro SCS Drug Use Patterns and Trends, 201610
COCAINE Compared with the previous two years, the availability of, and purity and pricing for, cocainehydrochloride and crack/cocaine in Atlanta remained stable in 2015. The majority of cocaine inAtlanta continues to be Colombian, and the City remains a primary hub for distribution alongthe East Coast. Although the supply of and demand for cocaine remains stable, deaths related to the drug’s useincreased more than 33% both in Atlanta and throughout Georgia in 2015 versus deaths in 2013.Although Atlanta has historically been known for its high use of both cocaine hydrochloride and crackcocaine, multiple data sources (e.g., substance abuse public treatment admissions, Georgia MedicalExaminer’s Office, and Georgia Poison Control Center) indicated a decrease in the drug’s use from 2000to 2013. Nevertheless, from 2013 to 2015, multiple sources indicated a stabilization at these lowerlevels. Cocaine-related telephone calls to the Georgia Poison Control Center for metropolitan Atlantaand cocaine law enforcement seizures were stable for the past three years. Although the use and price(retail and wholesale levels) of cocaine remained consistent in 2015, there were mixed reports as topotential changes in purity levels and supply. The DEA confirmed local cocaine purity levels to be stableat between 40% and 50%, but ethnographic results among local users suggest an increase in 2015. Thecocaine in Atlanta continues to be predominantly Columbian, although there have been increasingamounts of higher grade Peruvian cocaine transported into Atlanta.In 2015, local High Intensity Drug Trafficking Administration (HIDTA) officials found an inconsistentsupply of cocaine in the City, while reporting that dealers who could not obtain cocaine began sellingmethamphetamine. Local HIDTA officials report early 2016 retail prices for crack cocaine to be between 20 and 40 for a rock and 80 and 100 for a gram of cocaine hydrochloride. Whole prices for cocainein the first three months of 2016 averaged between 32,000 and 36,000 per kilogram. These pricesreflect a stable market for cocaine prices over the past two years.Although cocaine use has stabilized, the number of deaths associated with cocaine use has increased inmetropolitan Atlanta and Georgia. Since 2012, the number of cocaine-related drug poisoning deaths inAtlanta rose from 64 to 98, whereas the number of statewide deaths with cocaine found on board, asindicated in Exhibit 2, increased more than 42% from 172 to 245.Atlanta Metro SCS Drug Use Patterns and Trends, 201611
Exhibit 2. Georgia’s Number of Decedents with Select Drugs on Board at Time of Death (2007-2015)6005004003002001000Cocaine2007 2008 2009 2010 2011 2012 2013 2014 2015394223207266203172181245245Methamphetamine ource: Georgia Medical Examiner’s OfficeResults from the Fulton County Medical Examiner’s Office for 2015 indicate that nearly 20% of alldecedents tested positive for cocaine, with 66% being African American and 80% male. The primaryreason for the increase in deaths is largely a result of the increase in local polysubstance use, especiallyheroin and fentanyl.Using patterns and preferred routes of administration related to local cocaine use remained consistent in2015. Crack cocaine comprised nearly two thirds of all cocaine users in metropolitan Atlanta, and its userscontinued to be predominantly African American and older than 35 years of age. Users of cocainehydrochloride tended to be White, young, affluent, and residing in suburban counties.MARIJUANA Local ethnographic reports suggest an increased demand for higher quality marijuana andtetrahydrocannabinol (THC)-based liquids, with the latter being increasingly smoked in vapor pensand e-cigarettes.Marijuana remained the most widely available and commonly used illicit drug in both metropolitanAtlanta and Georgia. Availability remained high, whereas demand for marijuana containing elevated THCincreased. In addition, recent results from ethnographic reporting and discussions with local DrugEnforcement Administration (DEA) officials indicated a sharp increase in demand for liquid THC thatcould be consumed via e-cigarette and/or vapor technologies. Liquid forms of THC were purchased inlocal smoking-oriented stores (e.g., head shops), via the Internet, and bought in states like Colorado andWashington. Prices for liquid THC in 2015 ranged from 15 to 35 per cartridge, and users reported thatsupply was increasing in metropolitan Atlanta.Atlanta continued to serve as a primary distribution center for marijuana. The majority of marijuanaavailable in Atlanta continued to come from Mexico, with smaller amounts originating in Canada and theAtlanta Metro SCS Drug Use Patterns and Trends, 201612
Caribbean. Local HIDTA officials, along with results from local ethnographic reporting, noted increases inTHC levels found in Mexican-produced marijuana in Atlanta. Law enforcement officials suggested thatthis increase in purity was an effort on behalf of Mexican growers and distributors to compete withhigher quality domestic marijuana grown in Colorado, Washington, and California.Results from the Georgia Poison Control center indicated a recent uptick in marijuana-related calls,especially at the state level. Marijuana-related calls for metropolitan Atlanta increased from 51 in 2012,58 in 2013, 61 in 2014 and 85 in 2015, whereas statewide calls increased from 87 to 140 during thissame time period.METHAMPHETAMINE Multiple dat
Lamar, Meriwether, Morgan, Newton, Paulding, Pickens, Pike, Rockdale, Spalding, and Walton Counties. Percent of Drug Overdose (Poisoning) Deaths with Drug(s) Specified: The percentage of drug overdose (poisoning) deaths with specific drugs mentioned varies considerably by state/catchment area. This statistic describes . Drug Overdose (Poisoning)