Transcription
Exercise with EO Browser: Air Pollution(Sentinel-2, Sentinel-5P)Amalia Castro Gómez (RSAC c/o ESA/ESRIN), Nicolas Wagener (Young GraduateTrainee at ESA/ESRIN),Francesco Sarti (ESA/ESRIN)December 2019ESA UNCLASSIFIED - For Official Use
Learning goals Define suitable search criteria (time range, area, satellite, satellite product, visualizationtype) in EO Browser for a case study in air pollution Interpret Sentinel-5P NO2 maps Understand the different levels of processing for Sentinel-2 products (L1C and L2A) Get basic introduction to the concepts of satellite revisit and coverage (including orbit, swath) Compare images from different sensors in EO BrowserESA UNCLASSIFIED - For Official UseSlide 2
Overview1. Overview of Sentinel-5P2. Exercise with Sentinel-5P and Sentinel-2:1.NO2 with Sentinel-5P2.Context information with Sentinel-23.Comparison of both sensorsESA UNCLASSIFIED - For Official UseSlide 3
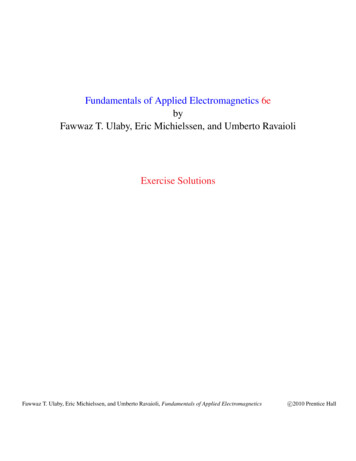
1. Overview of Sentinel-5Phttp://www.tropomi.euSentinel-5 Precursor (S-5P) is the satellite developed in preparation for the Sentinel-5 mission that will belaunched in the future. It carries only one sensor, called TROPOMI, which is the most advancedmultispectral imaging spectrometer to date.TROPOMI observes the sunlight that is scattered back to space by the surface of the Earth and by theatmosphere, and it detects the unique fingerprints of gases in different parts of the electromagneticspectrum.It can detect a wide range of pollutants, because it measures in the Ultra Violet, Visible, Near Infrared andShort Wave Infrared parts of the electromagnetic spectrum.For example NO2, O3, formaldehyde, SO2, CH4, CO can be measured.O2O3H 2OH 2OCO2O3ESA UNCLASSIFIED - For Official UseSlide 4
1. Overview of Sentinel-5PESA UNCLASSIFIED - For Official UseSlide 5
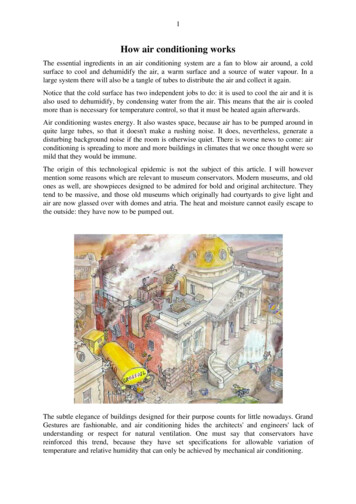
1. Overview of Sentinel-5PNO2 image over Europe. Cities are highlighted, can you identify them? Can you see the ship routes?ESA UNCLASSIFIED - For Official UseSlide 6
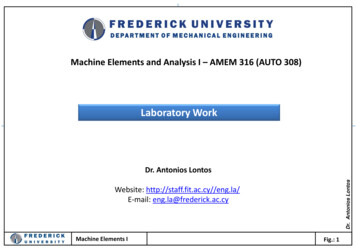
1. Overview of Sentinel-5PNO2 image over Europe. Cities are highlighted, can you identify them? Can you see the ship routes?London areaThe Netherlands, BelgiumMadridRomeShip routesESA UNCLASSIFIED - For Official UseSlide 7
Overview1. Overview of Sentinel-5P2. Exercise with Sentinel-5P and Sentinel-2:1.NO2 with Sentinel-5P2.Context information with Sentinel-23.Comparison of both sensorsESA UNCLASSIFIED - For Official UseSlide 8
2. Exercise overviewWe will find a NO2 map from Sentinel-5P. Then we will use Sentinel-2 (True Colour display) tounderstand which features/elements exist in the areas where NO2 levels are high.Since the Sentinel-5P images cover larger areas than the Sentinel-2 images, we will display at the same timethe images Sentinel-2 acquired on two different days, so as to cover all the area of northern Italy.WHY?We will look at this later in theexercise, in Note 2ESA UNCLASSIFIED - For Official UseSlide 9
2.1. NO2 with /Register for free with an email address, to have fullaccess to all the tools.ESA UNCLASSIFIED - For Official UseSlide 10
2.1. NO2 with Sentinel-5P1. Where to search? Navigate to the area of northern Italy (simply use your mouse to adjust the display asseen below. There is no need to upload polygons or enter coordinates).2.Which sensor? Select Sentinel-5P (NO2)3.When to search? Define Time range: 2018-07-27 to 2018-07-27 (yes, the same day for both!)4.Click Search1234ESA UNCLASSIFIED - For Official UseSlide 11
2.1. NO2 with Sentinel-5PWe will choose the first result (from 12:18:06 UTC): click VisualizeESA UNCLASSIFIED - For Official UseSlide 12
2.1. NO2 with Sentinel-5P1.To display the NO2 map, you may need to click on Nitrogen Dioxide, under Custom2.Visualize the legend too1ESA UNCLASSIFIED - For Official Use2Slide 13
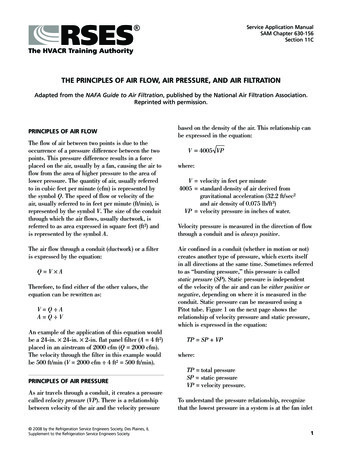
2.1. NO2 with Sentinel-5PWhat you are seeing are the NO2 concentrations over Europe as mapped by the satellite Sentinel-5P onJuly 27th 2018. NO2 concentrations in clean air are close to 0 and they only rise when an emission sourceis present. For example, large amounts of NO2 are released by the burning of fossil fuels so industry andvehicle traffic contribute to high levels of NO2. As you can see in the image, high concentrations can befound mostly in urban areas, e.g. Milan, Rome, Lyon.Ships are another large emission source for NO2 and other air pollutants. As you can see, Venice, which hasone of Italy’s largest harbours shows very high NO2 levels.Observe also that many pixels in the image are empty. That is because these pixels couldn’t be retrievedfor example due to clouds. Since the pixels are also quite large (one S-5P pixel covers an area of 7km*7km) itgets difficult to interpret this image. Let’s use data from Sentinel-2 for better understanding of the scene.But first let’s save (pin) our image!ESA UNCLASSIFIED - For Official UseSlide 14
2.1. NO2 with Sentinel-5PSave the Sentinel-5P NO2 image from 2018-07-27 by using Pin image function.ESA UNCLASSIFIED - For Official UseSlide 15
Overview1. Overview of Sentinel-5P2. Exercise with Sentinel-5P and Sentinel-2:1.NO2 with Sentinel-5P2.Context information with Sentinel-23.Comparison of both sensorsESA UNCLASSIFIED - For Official UseSlide 16
2.2. Context information with Sentinel-21.Where to search? Keep the same area as before (northern Italy)2.Which sensor? Select Sentinel-2 (both L1C & L2A)* See Note 1 in next slides3.When to search? Define Time range: 2018-07-31 to 2018-07-31 (same date for both!)4.Click Search.2134ESA UNCLASSIFIED - For Official UseSlide 17
2.2. Context information with Sentinel-2– NOTE 1When the satellite acquires the image, it sends it to a ground station. But the image is not yet ready to beused because its quality is not yet good enough!A simple explanation of this is that the image has geometric distortions (e.g. due to the rotation of the earth)and the values recorded are influenced by the fact that the atmosphere absorbs part of the radiation.ESA UNCLASSIFIED - For Official UseSlide 18
2.2. Context information with Sentinel-2– NOTE 1But what does L1C and L2A mean?As we just said, Sentinel-2 acquires an image over a certain area, and then sends it to a ground station inEarth. This image is called Level 0, because no corrections have been applied to it yet: the image stillpresents distortions that affect its geometry and the values recorded. Corrections are applied gradually (notall of them at once). Every time a correction is applied, we say the level of the image increases (e.g. Level 1A, then Level 1-B, etc).Level 1C (L1C) images have had all the corrections done except for the atmospheric correction: thedistortion of the atmosphere is still present. The values represent what the satellite measures at the top of theatmosphere (not at the bottom of the atmosphere!).After the algorithm that makes this last correction is applied, the outcome is called a Level-2A product (L2A).L2A products therefore represent the measurement at the BOTTOM of the atmosphere, i.e. at the level ofthe ground.ESA UNCLASSIFIED - For Official UseSlide 19
2.2. Context information with Sentinel-2– NOTE 1Ideally we would only use L2A products, but when Sentinel-2 started acquiring images, the algorithm thatcreates L2A products was not applied to L1C images in an automatic way. This means L2A images of thatperiod do not show in EO Browser.Users needed to apply the algorithm themselves (by downloading the L1C image, opening it in the ESA SNAPsoftware, and using the Sen2Cor plugin in that software to create the L2A product).It was only later on that the algorithm started being applied automatically to L1C products: L2A productsbecame available as routine and could therefore appear in EO Browser.This is the reason we prefer to select L1C AND L2A: to be sure that, whenever we search for an image in EOBrowser, we will be able to find one. Otherwise, if we only selected L2A and we were looking for older dates (e.g.end of 2015), we may not find L2A results in EO Browser More info at sentinel-2-msi/processing-levels sentinel-2-msi/product-types/level-2aESA SNAP Software: https://step.esa.int/main/toolboxes/snap/Sen2Cor plugin: n2cor/ESA UNCLASSIFIED - For Official UseSlide 20
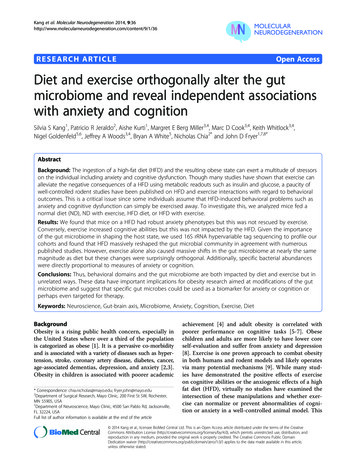
2.2. Context information with Sentinel-2– NOTE 1As we said, the original image received by the ground station is called a Level-0 image.After each correction, the level increases.Level-2ACorrect for effectsof atmosphereSubset of Level-1CSubset of Level-2ANote the image used as example ( ) for L1A to L1C is different than the image whosesubset illustrates L1C and L2A ( ): since it is a subset, its geometry is different. Andsince it is taken over a different area, the coastline and features look different.ESA UNCLASSIFIED - For Official UseSlide 21
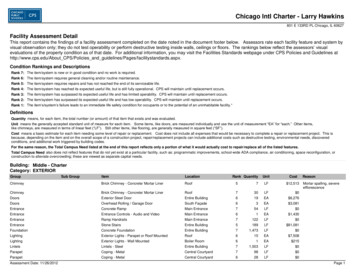
2.2. Context information with Sentinel-2– NOTE 1Subset of a Level-1C image (beforecorrecting for the effects of the atmosphere)ESA UNCLASSIFIED - For Official UseSubset of a Level-2A image(after correctingfor the effects of the atmosphere)Slide 22
2.2. Context information with Sentinel-2Then a list of various results will display. Let’s have a closer look at it.ESA UNCLASSIFIED - For Official UseSlide 23
2.2. Context information with Sentinel-2We see all the images acquired that day in that area by Sentinel-2. Their footprints appear as bluesquares in EO Browser.Observe images have a small overlap with each other: this ensures different images can be merged together,if needed, and ensures no areas remain uncovered.One imageAnother imageESA UNCLASSIFIED - For Official UseSlide 24
2.2. Context information with Sentinel-2We will choose the first result (from 2018-07-31 10:27:01 UTC) with 3.79% of cloud cover: click Visualize.ESA UNCLASSIFIED - For Official UseSlide 25
2.2. Context information with Sentinel-21. Then choose a visualization, for example True Colour2. Next pin the image, in order to save it3. Go back to the Visualizations tab21ESA UNCLASSIFIED - For Official UseSlide 26
2.2. Context information with Sentinel-2Let’s find an image from 2018-07-28. You could search from the Search tab, as you learned in theprevious slides. Alternatively, here we show you a shortcut:1. Always in the Visualization tab, click the calendar icon2. Select 2018-07-283. The display of the image will update4. Pin the image to save it142ESA UNCLASSIFIED - For Official Use3Slide 27
2.2. Context information with Sentinel-2 – NOTE 2Did you notice how the images Sentinel-2 acquires in a single day look like, when put all together?They cover a different area each day 28-07-2018ESA UNCLASSIFIED - For Official UseWHY?31-07-2018Slide 28
2.2. Context information with Sentinel-2 – NOTE 2Hint ntinel2 global coverage?source post pageESA UNCLASSIFIED - For Official UseSlide 29
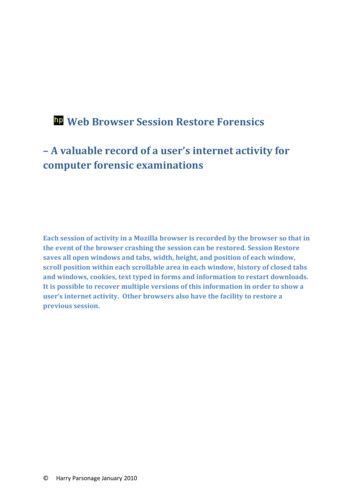
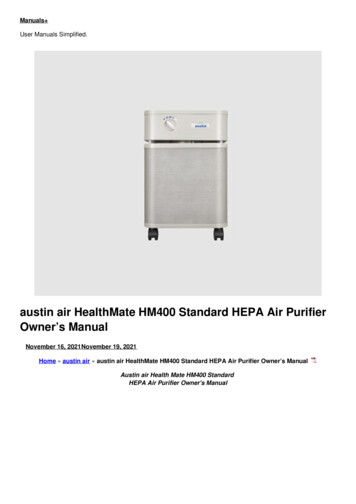
2.2. Context information with Sentinel-2 – NOTE 2Answer: Satellites follow an orbit around the Earth, and can only “see” thepart of the ground surface that is under that orbit.What they see is called swath. The swath is in a different location everyday, because the Earth rotates.After some days, Sentinel-2 has imaged the whole Earth, and the cycle startsagain.28-07-2018ESA UNCLASSIFIED - For Official Use29-07-201830-07-201831-07-2018Slide 30
Overview1. Overview of Sentinel-5P2. Exercise with Sentinel-5P and Sentinel-2:1.NO2 with Sentinel-5P2.Context information with Sentinel-23.Comparison of both sensorsESA UNCLASSIFIED - For Official UseSlide 31
2.3. Comparison of both sensorsIn your Pins tab you should have the following below.Click Compare to start the comparison of the images. Opacity sliders will then be available.ESA UNCLASSIFIED - For Official UseSlide 32
2.3. Comparison of both sensorsThe Sentinel-5P image covers a larger area than the Sentinel-2 image. Therefore we use two Sentinel-2images, which overlap only a bit with each other, and which allow us to cover a larger part of Italy when weput them together. In this way we have more areas of comparison between the two satellites.ESA UNCLASSIFIED - For Official UseSlide 33
2.3. Comparison of both sensors1. Use thesymbol to drag the Sentinel-5P image to the top of the list2. Lower its opacity12ESA UNCLASSIFIED - For Official UseSlide 34
2.3. Comparison of both sensorsESA UNCLASSIFIED - For Official UseSlide 35
2.3. Comparison of both sensorsZoom into the Milan area and investigate what can cause high levels of NO2.As expected, most high NO2 concentration occur in large cities. However, there are a few examples of highconcentrations outside of cities. Two are shown in the next slide. Have a look at the Sentinel-5P image as itcompares to the Sentinel-2 images. Can you make other interesting observations?ESA UNCLASSIFIED - For Official UseSlide 36
2.3. Comparison of both sensorsESA UNCLASSIFIED - For Official UseSlide 37
Learning goals Define suitable search criteria (time range, area, satellite, satellite product, visualizationtype) in EO Browser for a case study in air pollution Interpret Sentinel-5P NO2 maps Understand the different levels of processing for Sentinel-2 products (L1C and L2A) Get basic introduction to the concepts of satellite revisit and coverage (including orbit, swath) Compare images from different sensors in EO BrowserESA UNCLASSIFIED - For Official UseSlide 38
Thank you for your attention!www.esa.intESA UNCLASSIFIED - For Official Use
ESA UNCLASSIFIED - For Official Use Slide 9 We will find a NO 2 map from Sentinel-5P.Then we will use Sentinel-2 (True Colour display) to understand which features/elements exist in the areas where NO 2 levels are high. Since the Sentinel-5P images cover larger areas than the Sentinel-2 images, we will display at the same time