Transcription
GEOLOGICAL SURVEY CIRCULAR 276WATER RESOURCES OFTHE LOUISVILLE AREAKENTUCKY AND INDIANA
N0\1 5 1953UNITED STATES DEPARTMENT OF THE INTERIORDouglas McKay, SecretaryGEOLOGICAL SURVEYW. E. Wrather, DirectorGEOLOGICAL SURVEY CIRCULAR 276WATER RESOURCES OF THE LOUISVILLE AREA, KENTUCKY AND INDIANABy M. I. Rorabaugh, F. F. Schrader, and L. B. LairdWashington, D. C., 1953Free on application to the Geological Survey, Washington 25, D. C.
PREFACEThis report is one of a series on the water resourcesof selected industrial areas of national importance.These reports are prepared in the Water ResourcesDivision of the U.S. Geological Survey, and providevaluable information for national defense and for orderly planning of municipal and industrial expansion. TheWater Utilization Section of the Technical CoordinationBranch provides technical guidance in the preparationof these reports. This report was prepared under thedirect supervision of the following persons: W. L.Lamar, district chemist (Quality of \Vater); M. I.Rorabaugh, district engineer (Ground Water); andF. F. Schrader, district engineer (Surface Water).The authors express appreciation for the able assistance of E. A. Bell, (Ground \Vater), and L. E. Carreon,(Surface Water),Many persons and organizations contributed information used in this report. The authors wish to acknowledge the courtesy and cooperation of the followingagencies: Louisville Chamber of Commerce, Louisville and Jefferson County Planning and Zoning Commission; Louisville and Jefferson County MetropolitanSewer District; Louisville Water Company; LouisvilleDepartment of Works (city engineer); Indiana Gas andWater Company; Louisville Extension Water District;Kentucky Department of Mines and Minerals; KentuckyGeological Survey; Kentucky agricultural and Industrial Development Board; Kentucky Flood Control andWater Usage Board; Kentucky Department of Highways;Kentucky State Department of Health; U. S. Army,Corps of Engineers; and U. S. Department of Commerce, Weather Bureau.Many of the data summarized in the report werecollected by the Geological Survey in cooperation withpertinent agencies of the city of Louisville, Ky.;Jefferson County, Ky.; the Commonwealth of Kentucky;and the State of Indiana, Chemical examinations weremade by the Geological Survey, except as otherwiseindicated.In addition, thanks are due many individuals, welldrillers, and industries for furnishing informationfrom their files and for granting permission to theGeological Survey for the collection of field data attheir installations.II
CONTENTSSummary . . . . Introduction . . . . . .Description of area . . Topography . . . . . . . . Geology . . . . . . . Climate . . . Natural resources . . .History . . . . . Population . . . . . . Transportation . Industrial development . . Datum planes . Occurrence of water . . Surface water . .The Ohio River . Navigation .Discharge . . . . . .Floods . . . . Quality . . . .Small streams . . Harrods Creek Beargrass Creek . . Silver Creek . . Floyds Fork Por:d Creek . . .Ground water . .Occurrence . Consolidated formations . .Ohio River valley alluvium Recharge and ground-water movement . .Fluctuations of water levels . .Downtown area of Louisville . . . West-central area . . . "Rubbertown" 8292929PageGround water-continuedFluctuations of water levels-continuedDistillery area.Jeffersonville.Quality ,.;: ground water.\Vater from the limestones.Water from the sand and gravel.Effects of river-water infiltration.Variations in quality . Temperature of ground water . Public water supplies.City of Louisville. . . New Albany, Indiana . . . Jeffersonville, Indiana.Louisville extension water district. . Present use of water.Public supplies. . Private industrial use.Surface water. . Ground water.Irrigation and rural supplies.Fluctuation of water use.Summary of use.Potential supply. Surface water.Ground water.Water laws.Federal laws . o: Ohio River Valley Water SanitationCommission . ·····Kentucky law.Indiana law . . . . Map of the Louisville area, Kentucky and Indiana, showing the availability of ground water In pocket2. Map of the Louisville area, Kentucky and Indiana, showing where hydrologic and geologicdata have been collected . In pocket1. Precipitation at Louisville.32. Climatological data for Louisville.43. Population growth - Louisville metropolitan area .,. . . . . 54. Localized hydrologic cycle -Louisville metropolitan area 65. Minimum daily and monthly discharge, Ohio River at Louisville, 1928-52.86. Duration curve of daily flows, Ohio River at Louisville, 1928-52 . .,.97. Drought frequencies, Ohio River at Louisville, 1928-52. . .98. Maximum annual elevations of Ohio River at Louisville, 1832-1952 (only major floods priorto 1872).109. Stage hydrographs of Ohio River at Louisville, 1937 and 1945 floods.1110. Flood-stage frequencies, Ohio River at Louisville, 1832-1952.1111. Water-surface profile of 1937 flood on the Ohio River at Louisville, mile 592 to mile 627 .1212. Frequency of floods by months, Ohio River at Louisville, 1875-1952.1313. Location of flood walls and areas flooded in 1937.1414. Cumulative frequency curve of hardness of Ohio River water at Louisville, 1950-52.15III
Figure .32.33.34.35.36.37.38.39.40.41.Temperatures of Ohio River water and of air at Louisville, 1946-52.Durati : n curve of daily flows, Harrods and Beargrass Creeks, 1944-52.Chemical character of waters from small streams in Louisville area . .Duration curve of daily flow; Silver Creek, Floyds Fork, and Pond Creek, 1944-52.Longitudinal section of Ohio River valley at Louisville.Cross-sections of the Ohio River flood plain at Louisville. .Cross-sections of the Ohio River flood plain southwest of Louisville.Map of alluvium in Louisville area showing water-level contours in December 1952. .Artificial recharge in the Louisville area, 1944-52.Precipitation, river level, and water-table elevation in downtown Louisville, 1937-52.Pumpage, precipitation, and water-table elevation, in the west-central area of Louisville,1943-52.Pumpage, precipitation, river level, and water-table elevation in the "Rubbertown" area,1941-52. . .Pumpage, precipitation, and water-table elevation in the Distillery area of Louisville,1937-52. .Pumpage and water-table elevation at Jeffersonville public supply, 1943-52.Chemical character of selected ground waters of the Louisville area.Map of the Louisville area showing hardness of ground waters, 1952.Trends in hardness of ground water in the Louisville area . u . . . . . . . . . . . . . . . . . . . . . . . . . . . . . . . . . . . . . . .Map of the Louisville area showing maximum and minimum temperatures of ground water,1945-52. . . . . .Temperature characteristics of infiltrated river water (data from Ranney collector atBells Lane).Maximum and average of several constituents of the Louisville public water supply, 1952.Source and use of water from public supplies in Louisville metropolitan area, 1952 ,.Pumpage by Louisville Water Co., 1860-1952.Ground-water pumpage for municipal use, 1938-52.Ground-water pumpage in the Louisville metropolitan area, 1937-52.Distribution of ground-water pumpage in the Louisville area, 1952.Summary of water use in the Louisville metropolitan area, 1952 . ···· ···· . ·· . .Comparison of water use in 1952 with estim.ated potential 24344454647TABLESTable 1.2.3.4.5.6.7.IVChemical quality of surface waters in the Louisville area . .Water-bearing characteristics of typical formations . .Water-bearing properties of the principal formations in the Louisville area . .Chemical quality of water from selected wells in the Louisville area . .Use of untreated river water for cooling purposes, 1944-52 . .Estimated average daily net withdrawals of ground water by industries in the Louisvillemetropolitan area, 1937-52 . .Summary of use of water in the Louis,rille metropolitan area, 1952 . . .Page16222335434446
WATER RESOURCES OF THE LOUISVILLE AREA, KENTUCKY AND INDIANABy M. I. Rorabaugh, F. F. Schrader, and L. B. LairdSUMMARYThe most imp9rtant sources of water in the area arethe Ohio River and wells. The quantity of water flowing in the Ohio River ranges from a minimum of 1, 360mgd (million gallons per day) or 2, 100 cfs (cubic feetper second) to a maximum of 717,000 mgd (1, 110,000cfs): the average flow is 75,000 mgd (116, 000 cfs).Temperature of the river water ranges from 32 F toabout 85 F. Pollution and floods are major problems.Ground-water sources have an estimated potential ofabout 450 mgd. This water is suitable for domesticand industrial use. Under present conditions, its temperature varies only a few degrees above and below anaverage qf 58 F, but under conditions of full development, the range would be much wider because most ofthe water would be derived by induced infiltration fromthe river. However, the temperature range wouldnever be as wide as chat of the river water.Major water problems include Ohio River floods,local flooding because of inadequate drainage, pollutionof the Ohio River and local tributaries, and insufficientsupplies of ground water in the industrial area. Thehighly polluted Ohio River is used as a source for municipal and industrial water and also for disposal of rawsewage and industrial waste. Natural local drainage inparts of the area is poor, and rapid expansion of industrial and residential areas have created serious problems of storm-water and sanitary drainage. Poor natural drainage has adversely affected agricultural landadjacent to the city.Flood walls to provide protection from high watersof the Ohio River are nearing completion at the presenttime. Public agencies are actively engaged in seekingsolutions to the other pressing problems of the area.DESCRIPTION OF AREAPresent water use is only a small percentage of theavailable supply. Total surface-water use was 730mgd in 1952, and total ground-water use in the sameyeat'\vas 35 mgd. Four public systems furnish 74.2mgd of treated water to about 500, 000 persons, and tomany industries. Domestic use was 18. 6 mgd and theindustrial and commercial use was 746 mgd.INTRODUCTIONThe purpose of this report is to summarize the available information on water for the Louisville area;to present the information in a form suitable for usein the initial planning of water supplies for both defense and non-vital industries; and to assist in futuredevelopment and use of the water resources of thearea. Demands for water are increasing. Quantitygenerally is the most important consideration. However, water used in the manufacture of many productsfor example: alcohol, chemicals, and syntheticrubber-must meet rigid conditions ofquality or temperature. Chemical and temperature characteristicsof the waters in the area are. described in this report.The large quantity of water available in the OhioRiver provides assurance that a local water shortageis unlikely. However, other sources may be moreeconomical for some uses. Small streams, wells, orthe public supplies may be the most economical sourceif the quantity required is small or if the place of usage is a considerable distance from the river. Watertemperature and quality are other factors to be considered when the most economical source is selected.The metropolitan area considered in.this report includes Jefferson County in Kentucky, and parts of Clarkand Floyd Counties in Indiana. It includes the city ofLouisville, Ky., and the cities of Jeffersonville,Clarksville, and New Albany, Ind.The Louisville metropolitan area is near the centerof the Ohio River drainage basin and is between thelarge population centers of the Midwest and those of theSouth. (See lo ;:ation sketch, pl. 1.)TopographyThe topography of the area is of three distinct types.The eastern one-third of Jefferson County is relativelyrough; it is made up of broad ridges, which are dissected by Floyds Fork and its tributaries. Valleys withgentle slopes have been cut to depths of about 100 feetbelow the ridges. General elevation of this part of thearea is 700 to 750 feet above mean sea level.The second type of topography is extremely rough(designated as 11 Knobs 11 on pl. 1). There are two suchareas; one is in Indiana southwest of New Albany, andthe other forms a triangular area south of Louisville.These knobs are remnants of an old plateau and riseabruptly 250 to 500 feet above the relatively level areasforming their base. In the Indiana area, Knob Creekand French Creek have down-cut to a depth of about 300feet to form ridges, knobs, and very steep valleyslopes. The area south of Louisville is trenched byPond Creek at elevations of 420 to 450 feet above sea
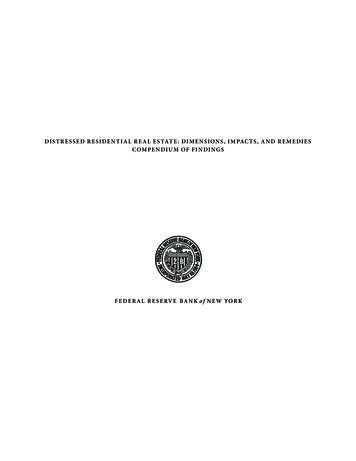
2WATER RESOURCES OF THE LOUISVILLE AREAlevel. The tops of the knobs are at elevations of 700to 900 feet above sea level.The third topographic type has relatively flat reliefand comprises the remainder of the area considered inthe report. The area northeast of Jeffersonville andthe area of central and northern Jefferson County(Muscatatuck re;;ional slope).slope gently from a general elevation of 700 feet at the northeast to about 450feet at the southwest. A belt about 3 miles wide alongthe Ohio River northeast of Louisville is deeply incised JY Harrods Creek and by other smaller tributaries tothe Ohio Eiver. The draiaage area of Beargrass Creekis gei1tly rolling. South of Louisville and north of theKnobs is an area of about 25 square miles, locally referred to as the ''wet woods.'' This area, a formerswamp, has been drained by a network of ditches,draining to the Ohio River through Pond Creek. The"wet woods" has very little relief and ranges from 450to 475 feet above mean sea level. The Ohio River floodplain is a 0elt along the Ohio River, ranging from awidth of aoout half a mile, northeast of Louisville, toa width of about 5 miles, southwest of the city. Thisarea, which has a general elevation of 425 to 475 feetabove sea level, is gently rolling and is drained bysmall tributaries to the Ohio River.GeologyThe rocks underlying the Louisville area are limestones, shales, and sandstones of Ordovician, Silurian, Devonian, and Carboniferous (Mississippian) age.The formations are fairly uniform in thicknessthroughout the area and have a gentle dip of about 40feet to the mile toward the west and southwest. Erosion of this sloping sequence of rocks has produced thetopographic features described above. The oldestrocks are exposed in eastern Jefferson County (limestone and shale of the Arnheim formation, Waynesvillelimestone, Lib12rty formation, and Saluda limestone ofOrdovician age; and Brassfield limestone, Osgood formation, Laurel dolomite, and Waldron shale of Silurian age). Erosion of this alternating series of shalesand limestones has produced the rough topography ofeastern Jefferson County. In contrast, the Muscatatuck regional slope is underlain by massive, relatively pure limestones (Louisville limestone of Silurianage, and Jeffersonville limestone and Sellersburglimes tone of Middle Devonian age). Erosion of thesehard formations have produced a relatively flat surface. The Scottsburg Lowland is underlain by the easily eroded New Albany shale of Late Devonian age.The Knobs area is made up of formations of Mississippian age (New Providence shale, Kenwood sandstone,Rosewood shale, Holtsclaw sandstone, and Warsawlimestone).In glacial times, the Ohio River cut a deep valley into the consolidated rocks (bedrock) and later filled thisvalley with glacial outwash sands and gravels and riverdeposits. The valley is about 1 miles wide northeastof Louisville. At Louisville, it widens to nearly 6miles, then gradually narrows to about 1 miles at thesouthwestern corner of Jefferson County. The deepestof several old channels passes under downtown Louis rille and the Rubbertown area, and then it coincideswith the path of present river to the south. Elevationof the valley floor in this channel is about 335 feet above mean sea level under Louisville, and it slopes toabout 325 feet at the southern limit of the county.The bedrock under the central part of Louisville andJeffersonville is limestone, and in New Albany, westernLouisville, and southwest of Louisville, it is shale.The present Ohio River flows on abed of sand andgravel along the northern and western edge of the oldvalley. The river is controlled by navigation dams.Normal pool elevation above the dam at Louisville is420 feet above sea level, and below the dam it is 383feet (Ohio River datum).ClimateLouisville's climate is continental in type. It is theresult of two major influences: warm moisture-ladenair masses moving up the Mississippi and Ohio valleysfrom the Gulf of Mexico, and artie air masses movinginto the area from the north and west. As a result, theweather is quite changeable, and extreme conditions donot prevail for long periods of time. Winters are moderately cold and summers are warm,according to 79years of record collected by the United States WeatherBureau. Temperatures rarely exceed 100 F in summerand rarely fall below 0 F in winter; the mean annualtemperature is 57. 0 F. The frost-free period is fromearly April until late October.The average annual precipitation at Louisville is42. 95 inches. Figure 1 shows annual precipitationsince 1872 and monthly distribution of precipitation andsnowfall. During spring and summer, thunderstormswith high intensities of rainfall are common.Figure 2 presents data on maximum and mean windvelocity, percent of possible sunshine, temperatur .and relative humidity. Relative humidity remains fairlyhigh throughout the summer. Cloud cover is about equally distributed throughout the year with some increase in the winte·r. Heavy fog is unusual, averagingabout 10 days per year and occurring in the period September through March.Prevailing winds are from the south; monthly averages range from 10 miles per hour in February, March,and April to about 7 miles per hour during the summer.The strongest winds are usually associated with thunderstorm activity; the maximum wind velocity recorded(average velocity for the fastest mile) in 39 years is 68miles per hour.Natural ResourcesWater is the most important natural resource of thearea. It is used for public-water supply, cooling, manufacturing, generation of hydro-electric and steamelectric power, irrigation, recreation, waste disposal,and navigation. Other natural resources include thesoils, limestones, shales, clays, and sand and gravel.The first settlement was made on Corn Island in 1778in connection with the expedition of General GeorgeRogers Clark. In the same year, or early in 1779, thesettlement was moved to the south bank of the OhioRiver near Twelfth Street. The falls of the Ohio Riverat Louisville was the only major obstruction to navigation between Pittsburgh and New Orleans, and all
3DESCRIPTION OF AREAen 20IIJJ: 25C: -r-,----,--. -----.-.--r-,---- 79 -year record(J'jILlJ: -Maximum16 12 t cr . 0. 80""" 0 IIJa:"'"' - a. 4 v , '- 0zz 20 -4-- - - -- -r -- z JJ:. 0 J ····':1:·:::: J:1-. ::: Minimum::·:· I '-""' . . . ]:'' . ····· . ·;.,;.;.· . :: ::{:lilililF M A M JJ. A s 0 N 0.t-tz 0 0cn50 -- -- ---4 N- -- ---- --- r--r--- -4---- -- --- IIJJ:0z.z0t 301-- a.0ILla:0.201-- J (:lzzcr101-- OL- 187018801890190019101920Figure 1. -Precipitation at Louisville.193019401950
4WATER RESOURCES OF THE LOUISVILLE AREAwso --r- -- -- --.--,--,- -- z::t:(/)z 60 -- - -- -p ---r LLIJCD 40F -4 -P 00.lL0 20 zw0a::LLI0.MAWind velocity- 79 -year reco·rdSunshine -51-year recordAir temperature-79-year recordAverage relative humidity -64-year recordJFMAMFigure 2. -climatological data for Louisville.JJAS0N0
5DESCRIPTION OF AREAriver freight had to be unloaded and reloaded.· As thecountry west of the Allegheny Mountains was settledby English from Virginia, followed by a large Germanelement, Louisville became an important river port.Construction of a canal and locks in 1830 greatly increased navigation on the Ohio River, and Louisvillerapidly grew to take its place among the principalcities of the country.PopulationThe population of the tri-county metropolitan area in1950 was about 580, 000. The gain during the period1940-50 was nearly 30 percent (fig. 3). The LouisvilleChamber of Commerce expects that the population ofJefferson County will be nearly 590,000 by 1960, andthat the tri-county population will be greater than700,000.800-700600 Cl)0 500FLOYD CO.,IND.CLARK CO . IND.%JEFFERSONCl);::)%0:z:!CO . KY.21-z 400z0I 300a. 0 1-"" 4% 1- "" /: Cl) 200100- - % % }:% % /: 2:: %:% %% % %% % % ;; %%'i. % % % % %% % %%% % %% % .J;::) stone; several quarries are operated to provide roadmaterial and concrete aggregate; clay and shale providematerial for the manufacturing of brick, tile, and building block. Sand and gravel are produced from pits andhy dredging the river bed. The most important naturalresource, water, has been developed extensively by industry. A large supply of even-temperatured groundwater permitted development of distilleries and chemical plants and provided the coolant for air conditioningof many buildings in the doV{ntown area. Dairies, breweries, meat packing plants, tobacco processing plants,food processing plants, metal working plants, and refineries also use large amounts of water. More than700 manufacturing plants employ nearly 100,000 persons in Louisville. At New Alb.any, about 40 industriesproduce furniture, prefabricated houses, clothing, metal products, chemical products, and other commodities.Principal large industries at Jeffersonville are a boatand machine company, a U.S. Army Quartermaster Depot, and a soap manufacturer. The Indiana OrdnanceWorks and the Hoosier Ordnance Works are located ashort distance up river from Jeffersonville. %% m :%0!!!Figure 3. -Population growth - Louisville metropolitan area.TransportationThe area is served by 8 railroads, 10 bus lines, 12barge firms, 5 airlines, about 100 truck lines, and anetwork of Federal, State, and county highways. Thesefacilities provide direct passenger and freight serviceto principal cities in all directions. Barge lines in theLouisville area handle more than 7 million tons offreight each year.Industrial DevelopmentIndustry of a diversified nature developed as Louisville grew. Good farm land was used for truck farmingand stock raising,and the city provided a ready marketfor potatoes, fresh vegetables, meat, and dairy products. Natural resources have been deveJoped, largecement plants at Speed, Ind. (just north of the area)and at Kosmosdale, Ky., process cement from lime-The Ohio River, in addition to providing cheap transportation, provides large amounts of raw water tochemical plants and steam-electric plants. Hydroelectric power is also generated at the dam on the OhioRiver.Datum PlanesThe elevation of a point is its vertical distance above(or below) some arbitrarily assumed level surface.Such a surface is called a datum olane. The datumplane to which most elevations ar-;-;ererred is meansea level. The datum is transferred from the seacoast to interior areas, such as Louisville, by a levelnetwork. Three such level networks have been run between the sea coast and Louisville. Because of smallerrors in the leveling, the results of the three networksdo not quite agree; therefore, there are three sea leveldata for the Louisville area.The Corps of Engineers established a level networkin 1896-1906. This datum, referred to as Ohio Riverdatum, is used as a reference on the Ohio River. Asecond network of bench marks was established by thecity of Louisville in 1906, and adjusted to the U;S. Geological Survey network in 1912, it is referred to as theadjustment of 1912. A third datum, the United StatesCoast and Geodetic Survey adjustment of 1929, is available over the area. The three datum planes are nearlyparallel in the Louisville area; their relative positionis as follows:Elevation of normal upper pool at dam 41, measuredin feet above mean sea level, is Ohio River datum,420.00 feet; Adjustment of 1912, 419.53 feet; Datum of1929, 419.08 feet.In this report, discussion and data for the Ohio Riverare based upon Ohio River datum. All of the Louisvillecity, street, and sewer elevations are based upon theadjustment of 1912. Because the ground-water work isclosely related to many city problems, records ofground-water level have been based upon the adjustmentof 1912. On illustrations relating river records toground-water records, the river records have been converted to adjustment of 1912. The 1929 datum is used
6'{vATER RESOURCES OF THE LOUISVILLE AREAOf the' nearly 43 inches of precipitation at Louisville,about 15 inches becomes runoff and flows to the OhioRiver in small streams. Much of the remainder is evaporated and transpired by vegetation. In the flood-plainarea, where the sand and gravel is covered by river deposits of silt and clay, it has been determined that about 6 inches of water per year percolates to the watertable. During the growing season evaporation and transpiration create a deficit in soil mo1sture. Normalsummer rains are usually not sufficient to overcomethe deficit, and very little water percolates below thesoil zone during
WATER RESOURCES OF THE LOUISVILLE AREA, KENTUCKY AND INDIANA By M. I. Rorabaugh, F. F. Schrader, and L. B. Laird SUMMARY The most imp9rtant sources of water in the area are the Ohio River and wells.