Transcription
(2021) 21:177Almaraz et al. BMC Med Inform Decis Makhttps://doi.org/10.1186/s12911-021-01536-4Open AccessSOFTWARESEPIA: simulation‑based evaluationof prioritization algorithmsKimberly Almaraz†, Tyler Jang†, McKenna Lewis†, Titan Ngo†, Miranda Song† and Niema Moshiri*AbstractBackground: The ability to prioritize people living with HIV (PLWH) by risk of future transmissions could aid publichealth officials in optimizing epidemiological intervention. While methods exist to perform such prioritization basedon molecular data, their effectiveness and accuracy are poorly understood, and it is unclear how one can directlycompare the accuracy of different methods. We introduce SEPIA (Simulation-based Evaluation of PrIoritizationAlgorithms), a novel simulation-based framework for determining the effectiveness of prioritization algorithms. SEPIAexpands upon prior related work by defining novel metrics of effectiveness with which to compare prioritization techniques, as well as by creating a simulation-based tool with which to perform such effectiveness comparisons. Underseveral metrics of effectiveness that we propose, we compare two existing prioritization approaches: one phylogenetic (ProACT) and one distance-based (growth of HIV-TRACE transmission clusters).Results: Using all proposed metrics, ProACT consistently slightly outperformed the transmission cluster growthapproach. However, both methods consistently performed just marginally better than random, suggesting that thereis significant room for improvement in prioritization tools.Conclusion: We hope that, by providing ways to quantify the effectiveness of prioritization methods in simulation,SEPIA will aid researchers in developing novel risk prioritization tools for PLWH.Keywords: SEPIA, HIV, Prioritization, Metrics, Simulation-based evaluation, FAVITES, PhylogeneticBackgroundMolecular data gathered on human immunodeficiencyvirus (HIV) is useful for understanding the systems ofepidemic spread of HIV. Such understanding can better allow us to intervene and treat high-risk groups ofindividuals. Methods of epidemic intervention includetreatments such as antiretroviral therapy (ART) andawareness programs [1]. Adherence to ART can causeviral suppression in people living with HIV (PLWH) andsignificantly reduces their risk of transmission, making ART distribution a potentially effective approach to*Correspondence: niema@ucsd.edu†Equal contributor: Kimberly Almaraz, Tyler Jang, McKenna Lewis, TitanNgo and Miranda SongDepartment of Computer Science and Engineering, Universityof California San Diego, 9500 Gilman Drive, La Jolla, CA 92093, USAcombating the spread of HIV. However, a major issuefor public health officials is how to allocate the limitedamount of available resources.In many parts of the world, when testing and treatingPLWH, it has become standard practice to record various metadata on the patients, including viral genomicsequences (often of the pol and gag regions). This information is often used to determine groups of individuals with high risk of future transmission, which can helppublic health officials better allocate limited resources[2]. The prioritization of PLWH can be explored througha computational framework: given a list of individuals along with metadata and viral sequences, order theindividuals in descending order of inferred risk of futuretransmission.Molecular epidemiology provides a natural framework for prioritizing individuals from viral sequence The Author(s) 2021. Open Access This article is licensed under a Creative Commons Attribution 4.0 International License, whichpermits use, sharing, adaptation, distribution and reproduction in any medium or format, as long as you give appropriate credit to theoriginal author(s) and the source, provide a link to the Creative Commons licence, and indicate if changes were made. The images orother third party material in this article are included in the article’s Creative Commons licence, unless indicated otherwise in a credit lineto the material. If material is not included in the article’s Creative Commons licence and your intended use is not permitted by statutoryregulation or exceeds the permitted use, you will need to obtain permission directly from the copyright holder. To view a copy of thislicence, visit http:// creat iveco mmons. org/ licen ses/ by/4. 0/. The Creative Commons Public Domain Dedication waiver (http:// creat iveco mmons. org/ publi cdoma in/ zero/1. 0/) applies to the data made available in this article, unless otherwise stated in a credit line to the data.
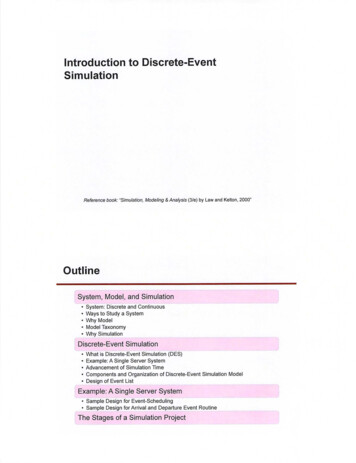
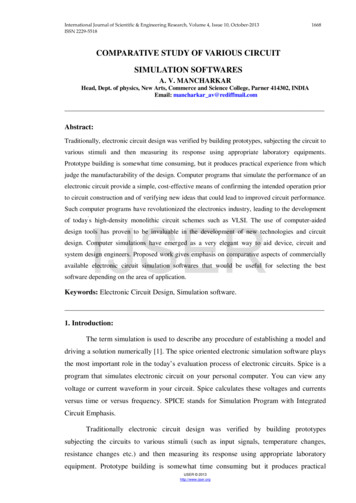
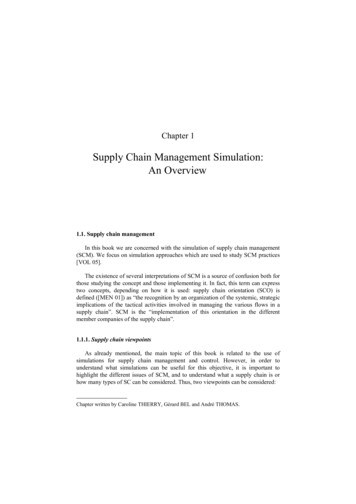
(2021) 21:177data. Currently, the standard approach is to use HIVTRACE [3] to infer transmission clusters based on pairwise distances between sequences, monitor the growthof the transmission clusters over time, and prioritizeindividuals in descending order of transmission clustergrowth. ProACT [4], on the other hand, is a prioritizationapproach that utilizes properties of a phylogeny inferredfrom the viral sequences.The following questions naturally arise: how well does agiven prioritization method perform, and which methodis superior in specific contexts? With real-world data, theground truth of who transmitted to whom is typicallyunavailable or error-prone. Further, even with a knowntransmission history, it is unclear how to quantify effectiveness: do we count the number of transmissions froma single individual, or the total number of transmissionsin a transmission chain seeded from a single individual,or perhaps we are interested in properties of the underlying contact network (e.g. individuals with large numbersof social contacts)? Thus, it is unclear how to quantitatively assess the performance of different prioritizationmethods.To address this open problem, we introduce SEPIA(Simulation-based Evaluation of PrIoritization Algorithms), a novel simulation-based framework for measuring the effectiveness of prioritization algorithms.Previously, in Moshiri et al. (2021) [4], ProACT and HIVTRACE were compared with respect to effectiveness, butthe comparisons were limited to a simulated epidemicdataset modeling the San Diego HIV epidemic between2005 and 2014. Like this prior work, SEPIA utilizes simulated epidemic data, such as those generated by FAVITES[5] or PANGEA.HIV.sim [6], to define a ground truthwith which prioritization methods can be directly compared. However, SEPIA expands upon this prior work bygeneralizing the task of prioritization effectiveness comparison and further exploring the mathematical meaningof “effectiveness” by defining 6 metrics of effectiveness,each inspired by properties of epidemics that are inherently of interest to public health officials for intervention.Specifically, the user runs a prioritization method on asimulated dataset; then, given the prioritization and thesimulated dataset, SEPIA will measure the effectivenessof the prioritization using the metrics defined below.ImplementationGiven a prioritization, SEPIA computes an effectivenessscore according to one of the following metrics: Metric 1: Direct Transmissions This metric aims toquantify the direct impact of each individual u on thespread of the virus within a population by countingPage 2 of 5 the total number of individuals to whom u directlytransmitted.Metric 2: Transmission Rate This metric aims toquantify the rate of transmission of each individual u,giving higher values to those who transmitted mostfrequently and most recently. We produce a stepfunction representing the number of transmissionsfrom individual u over time, and we measure theslope of a regression line inferred from the step graph(Fig. 1).Metric 3: Indirect Transmissions This metricexpands on Metric 1 to quantify an individual’sbroader impact on the community. For an individual u, we count the number of individuals who wereinfected by somebody who was infected by u.Metric 4: Direct and Indirect Transmissions This isthe sum of Metrics 1 and 3.Metric 5: Number of Contacts This metric measures each individual’s total number of contacts in theunderlying contact network.Metric 6: Number of Contacts and TransmissionsThis is the sum of Metrics 1 and 5.Given a prioritization of n individuals and the simulated data from which the prioritization was produced,for a given selected metric, SEPIA will compute a valuefor each individual in the prioritization. To compute ascore comparing the user’s prioritization to the theoretical optimum, SEPIA computes the Kendall Tau-b rankcorrelation coefficient [7] between the list of orderedmetric values and the descending list of integers fromn to 1 (Fig. 2). The resulting Tau-b score ranges from 1(perfectly correlated with optimal ordering) to 0 (no better than random ordering) to -1 (perfectly anticorrelatedwith optimal ordering).Number of TransmissionsAlmaraz et al. BMC Med Inform Decis Mak4Best Fity mx b3Metric 2 m210StartTimePresentFig. 1 Metric 2 is the slope of the best-fit line (red solid line) ofthe step function of the number of times a given individual hastransmitted (red dashed lines), regressed between the time ofthe individual’s first transmission event (“Start”) and present day(“Present”)
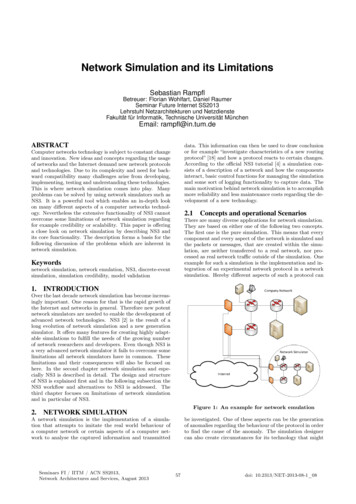
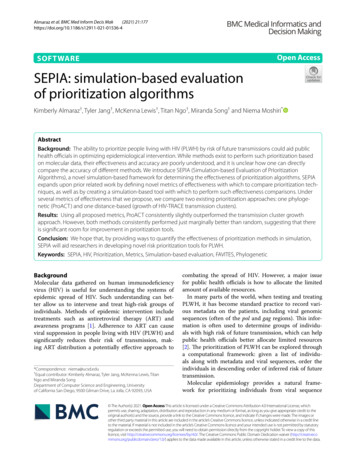
Almaraz et al. BMC Med Inform Decis Mak(2021) 21:177BACDPage 3 of 5Prioritizationof 4A23C02D01Score Kendall’s Tau-bFig. 2 Given simulated epidemic data and a prioritization of the individuals in the simulated epidemic, SEPIA computes the user-selectedeffectiveness metric for each person in the prioritization. Then, to construct an overall effectiveness score for this prioritization, SEPIA computes theKendall Tau-b correlation coefficient between the ordered list of effectiveness values and the theoretical optimumWe used SEPIA to compare the effectiveness oftwo molecular epidemiological prioritization methods. One approach is to use HIV-TRACE to infertransmission clusters from pairwise distances of viralsequences, monitor the growth of the transmissionclusters over time, and then to prioritize individualsin descending order of transmission cluster growth.The other approach is ProACT [4], a method that utilizes properties of a phylogeny inferred from the viralsequences. We used a simulated dataset produced byFAVITES to emulate the HIV pandemic in San Diegobetween 2005 and 2014 [5]. The simulated datasetsvary the expected degree in the contact network (Ed ),the rate at which individuals begin ART ( ), and therate at which individuals stop adhering to ART ( ).ResultsAs can be seen in Fig. 3, ProACT consistently outperformed HIV-TRACE transmission cluster growthusing all metrics on all simulation conditions. However, both tools consistently had Tau-b scores marginally higher than 0, implying that they are performingonly marginally better than a random ordering. As therate of starting ART ( ) increases, the rate of stopping ART ( ) increases, and the expected degree (Ed )increases (i.e., as the outbreak spreads more quickly),ProACT’s performance with respect to metrics 5 and6 seems to increase slightly. Otherwise, both ProACTand HIV-TRACE transmission cluster growth performconsistently across experimental conditions.DiscussionAcross all defined metrics and all considered simulationconditions, ProACT consistently outperformed prioritization by HIV-TRACE transmission cluster growth.However, both approaches consistently performed justmarginally better than a random ordering, implying thatthere is room for significant improvement in the realm ofHIV prioritization.ConclusionsIt must be noted that, while we aimed to provide generalized results by varying key simulation parameters, a keylimitation of this study is that the simulated epidemicsare specifically modeled after the HIV epidemic in SanDiego between 2005 and 2014. In practice, molecularepidemiologists will need to assess prioritization techniques using simulated datasets representative of thepathogens and communities in which they are specifically interested.Further, the 6 metrics we have implemented are byno means exhaustive, but rather, they are simply natural metrics of interest to public health officials. SEPIA isexpandable, and we leave the implementation of novelmetrics of effectiveness for future works.We hope that SEPIA will enable researchers to quantify and assess the effectiveness of different prioritizationapproaches in order to select the best existing prioritization method for their communities, develop new prioritization methods that improve upon existing ones, and,ultimately, maximize the impact of the limited resourcesavailable to public health officials.
Almaraz et al. BMC Med Inform Decis Mak(2021) 21:177Page 4 of 5Metric 1Metric 2Metric 3Metric 4Metric 5Metric 6Fig. 3 Effectiveness of prioritization using ProACT and HIV-TRACE transmission cluster growth across all metrics on datasets simulated by FAVITES.Each column represents a single experimental condition, and each violin plot depicts the Kendall Tau-b correlation coefficients computed by SEPIAacross 20 simulation replicates. The experimental conditions are varied by altering 3 parameters: expected number of contacts per individual (Ed ),rate of starting ART ( ), and rate of stopping ART ( )
Almaraz et al. BMC Med Inform Decis Mak(2021) 21:177Availability and requirements Project name: SEPIA Project home page: https:// github. com/ Niema- Lab/ SEPIA Operating system(s): Platform independent Programming language: Python Other requirements: SciPy License: GNU GPL v3.0 Any restrictions to use by non-academics: Contactauthors Manuscript data: https:// github. com/ Niema- Lab/ SEPIA- paper- finalAbbreviationsART : Antiretroviral therapy; Ed:: Expected degree; HIV: Human immunodeficiency virus; PLWH: People living with HIV; SEPIA: Simulation-based Evaluationof PrIoritization Algorithms; :: Rate of starting ART ; :: Rate of stoppingART .AcknowledgementsWe would like to thank Vignesh Gokul and Professor Christine Alvarado fortheir mentorship through the Early Research Scholars Program (ERSP).Author’s contributionNM conceived and directed this project. All members wrote the code for thisproject. KA, TJ, ML, TN, MS and NM composed this manuscript. All authors readand approved the final manuscript.FundingNo funding was received for this study. No funding bodies played any role inthe design of the study nor in the collection, analysis, and interpretation ofdata, nor in writing the manuscript.Page 5 of 5Ethics approval and consent to participateNot applicableCompeting interestsThe authors declare that they have no competing interests.Received: 1 March 2021 Accepted: 23 May 2021References1. CDC: Prevention. https:// www. cdc. gov/ hiv/ basics/ preve ntion. html(2019–12)2. Wertheim JO, Murrell B, Mehta SR, Forgione LA, Kosakovsky Pond SL,Smith DM, Torian LV. Growth of hiv-1 molecular transmission clusters inNew York City. J Infect Dis. 2018;218(12):1943–53. https:// doi. org/ 10. 1093/ infdis/ jiy431.3. Pond SLK, Weaver S, Brown AJL, Wertheim JO. HIV-trace (transmissioncluster engine): a tool for large scale molecular epidemiology of HIV-1and other rapidly evolving pathogens. Mol Biol Evol. 2018;35(7):1812–9.https:// doi. org/ 10. 1093/ molbev/ msy016.4. Moshiri N, Smith DM, Siavash M. HIV care prioritization using phylogenetic branch length. J AIDS. 2021;86(5):626–37. https:// doi. org/ 10. 1097/ QAI. 00000 00000 002612.5. Moshiri N, Ragonnet-Cronin M, Wertheim JO, Mirarab S. Favites: simultaneous simulation of transmission networks, phylogenetic trees andsequences. Bioinformatics. 2018;35(11):1852–61. https:// doi. org/ 10. 1093/ bioin forma tics/ bty921.6. Ratmann O, Hodcroft EB, Pickles M, Cori A, Hall M, Lycett S, Colijn C, Dearlove B, Didelot X, Frost S, et al. Phylogenetic tools for generalized HIV-1epidemics: findings from the Pangea-HIV methods comparison. Mol BiolEvol. 2016;34(1):185–203. https:// doi. org/ 10. 1093/ molbev/ msw217.7. Kendall MG. A new measure of rank correlation. Biometrika.1938;30(1/2):81–93.Publisher’s NoteSpringer Nature remains neutral with regard to jurisdictional claims in published maps and institutional affiliations.DeclarationConsent for publicationNot applicable.Ready to submit your research ? Choose BMC and benefit from: fast, convenient online submission thorough peer review by experienced researchers in your field rapid publication on acceptance support for research data, including large and complex data types gold Open Access which fosters wider collaboration and increased citations maximum visibility for your research: over 100M website views per yearAt BMC, research is always in progress.Learn more biomedcentral.com/submissions
on molecular data, their eectiveness and accuracy are poorly understood, and it is unclear how one can directly compare the accuracy of dierent methods. We introduce SEPIA (Simulation-based Evaluation of PrIoritization Algorithms), a novel simulation-based framework for determining the eectiveness of prioritization algorithms. SEPIA