Transcription
agronomyReviewVineyard Yield Estimation, Prediction, and Forecasting:A Systematic Literature ReviewAndré Barriguinha 1, * , Miguel de Castro Neto 1 and Artur Gil 2,3123* Citation: Barriguinha, A.; de CastroNeto, M.; Gil, A. Vineyard YieldEstimation, Prediction, andForecasting: A Systematic LiteratureReview. Agronomy 2021, 11, mic Editors: Miklós Neményiand Anikó NyékiReceived: 12 July 2021Accepted: 31 August 2021Published: 7 September 2021NOVA Information Management School (NOVA IMS), Campus de Campolide, Universidade Nova de Lisboa,1070-312 Lisboa, Portugal; mneto@novaims.unl.ptIVAR-Research Institute for Volcanology and Risks Assessment, University of the Azores,9500-321 Ponta Delgada, Portugal; artur.jf.gil@uac.ptcE3c—Centre for Ecology, Evolution, and Environmental Changes & ABG—Azorean Biodiversity Group,Faculty of Sciences and Technology, University of the Azores, 9500-321 Ponta Delgada, PortugalCorrespondence: abarriguinha@novaims.unl.ptAbstract: Purpose—knowing in advance vineyard yield is a critical success factor so growers andwinemakers can achieve the best balance between vegetative and reproductive growth. It is alsoessential for planning and regulatory purposes at the regional level. Estimation errors are mainlydue to the high inter-annual and spatial variability and inadequate or poor performance samplingmethods; therefore, improved applied methodologies are needed at different spatial scales. This paperaims to identify the alternatives to traditional estimation methods. Design/methodology/approach—this study consists of a systematic literature review of academic articles indexed on four databasescollected based on multiple query strings conducted on title, abstract, and keywords. The articles werereviewed based on the research topic, methodology, data requirements, practical application, andscale using PRISMA as a guideline. Findings—the methodological approaches for yield estimationbased on indirect methods are primarily applicable at a small scale and can provide better estimatesthan the traditional manual sampling. Nevertheless, most of these approaches are still in the researchdomain and lack practical applicability in real vineyards by the actual farmers. They mainly dependon computer vision and image processing algorithms, data-driven models based on vegetationindices and pollen data, and on relating climate, soil, vegetation, and crop management variables thatcan support dynamic crop simulation models. Research limitations—this work is based on academicarticles published before June 2021. Therefore, scientific outputs published after this date are notincluded. Originality/value—this study contributes to perceiving the approaches for estimatingvineyard yield and identifying research gaps for future developments, and supporting a futureresearch agenda on this topic. To the best of the authors’ knowledge, it is the first systematic literaturereview fully dedicated to vineyard yield estimation, prediction, and forecasting methods.Keywords: vineyard; yield; estimation; prediction; forecasting; systematic literature reviewPublisher’s Note: MDPI stays neutralwith regard to jurisdictional claims inpublished maps and institutional affiliations.Copyright: 2021 by the authors.Licensee MDPI, Basel, Switzerland.This article is an open access articledistributed under the terms andconditions of the Creative CommonsAttribution (CC BY) license (https://creativecommons.org/licenses/by/4.0/).1. IntroductionWith yield being considered a quality grape and wine indicator [1–5], it is crucial toobtain an early estimation of the quantity of grapes per area unit. Knowing in advancevineyard yield is a key issue so that growers and winemakers can achieve the best balance between vegetative and reproductive growth, make more informed decisions as tothinning, irrigation, and nutrient management, schedule harvest, optimize winemakingoperations, program crop insurance, and grape picking workforce demand, and help frauddetection [6–8].The traditional methods [9] are considered destructive, labor-demanding, and timeconsuming [4], with low accuracy [10] primarily due to operator errors [11] and sparse sampling (when compared to the inherent spatial variability in a production vineyard [5,12]).These are supported by manual sampling, where yield is estimated by sampling clustersAgronomy 2021, 11, 1789. w.mdpi.com/journal/agronomy
Agronomy 2021, 11, 17892 of 27weight and the number of clusters per vine, historical data, and extrapolation consideringthe number of vines in a plot. The main efforts towards improved yield models applied tothe vineyard, considered one of the most complex phenotypic traits in viticulture [13], arein most cases focused on image analysis for grape detection at field level, with a significantdrawback derived from cluster occlusion [14,15].The growing adoption of Precision Agriculture (PA) practices, closely related with theongoing advances in Geospatial Technologies (GT), Remote Sensing (RS), Proximal Sensing(PS), Internet of Things (IoT), Unmanned Aerial Vehicles (UAVs), Big Data Analytics (BDA)and Artificial Intelligence (AI) [16–19], are fueling the particular application in PrecisionViticulture (PV) [20] where the importance of the wine industry drives the development ofinnovative methods and technologies to cope with the heterogeneity within vineyards thatresults from high inter-annual and spatial variability derived from the effects of soil andclimate conditions, grapevine variety, biotic and abiotic stresses, vineyard managementpractices, among others [18,21]. However, despite being a hot topic in research over recentyears, it still lacks solutions that can transfer the acquired knowledge and methods to thefield and provide tools for wine-growers decision support.Models based on statistically significant relationships between predictors and grapevineparameters are increasingly being overtaken by crop models that can dynamically simulate and integrate into different time frames, plant traits, and other variables regardingmanagement, soil, and climate data [22]. This is particularly relevant, as grape productionfor wine is closely related to climate variables characterized in the past years by highinter-annual variability with direct adverse effects for wine producers that tend to beamplified by future climate changes’ perceived scenarios [23–26]. Nowadays, zoning thewine production areas, especially in denomination areas, is increasingly becoming morecritical for the identification and characterization of homogenous areas that are the basisof regulatory measures over wine [8], to allow marketing strategies regarding controlledorigins [27], and also regarding climate changes that require decisions at a regional levelconcerning adaptability of different varieties and mitigation management options in one ofthe most important crops in Europe [28]. PV must apply at the field level and at a largerscale, where the spatial variability may reveal general trends of variation not perceived atmore minor scales [29].The purpose of this present paper is three-fold: first, to perceive the research approaches for predicting yield in vineyards for wine production that can serve as an alternative to traditional estimation methods; second, to characterize the different new approachesidentifying and comparing their applicability under field conditions, scalability concerningthe objective, accuracy, advantages and shortcomings, and third, to identify research gapsfor future developments and support a future research agenda on this topic. To achievethis goal, a systematic literature review was conducted using the PRISMA statement as aguideline [30].2. MethodologyTo identify the relevant scientific work already published on vineyard yield estimation, prediction, and forecasting, the authors carried out a systematic literature reviewof academic articles indexed on the Scopus, Web of Science, ScienceDirect, IEEE, MDPI,and PubMed databases, using the Preferred Reporting Items for Systematic Reviews andMeta-analyses (PRISMA) statement as a guideline [30]. Other databases such as GoogleScholar and ResearchGate were not considered because a preliminary study undertaken bythe authors showed that they would only contribute to a significant increase in duplicatearticles.Depending on the approach, the terminology behind knowing as far in advance aspossible the quantity of grapes that will be harvested can be referred to as (1) estimation—when the goal is to find the most suitable parameter that best describes a multivariatedistribution of a historical dataset, (2) as prediction—when a dataset is used to computerandom values of the unseen data, and (3) as forecasting—when a temporal dimension in
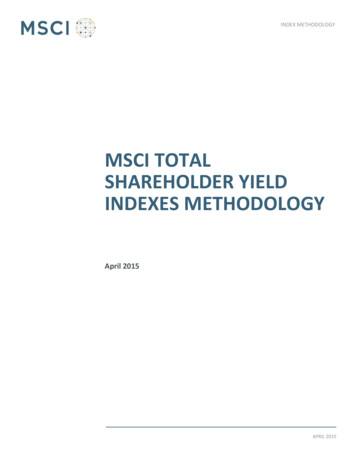
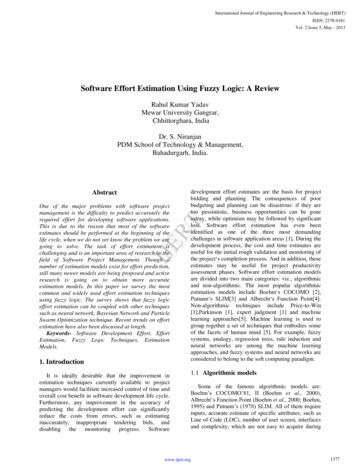
Agronomy 2021, 11, 17893 of 27a prediction problem is explicitly added. In the present review, the authors adopted thebroader term of yield estimation, although the other terms were considered keywords inthe search criteria.The authors adopted a search criteria query string conducted on the title, abstract, andkeywords, using all the combinations of the following keywords: “yield” OR “production”AND “estimation” OR “prediction” OR “forecasting” AND “vineyard” OR “grapevine”.Only peer-reviewed journals, conference articles, and book chapters were considered forscreening.As the goal is to perceive alternatives to the traditional manual sampling method ofdetermining in advance the vineyard yield, those were excluded from the final data set.A total of 455 articles published between 1981 and 2021 were found. These articleswere reviewed firstly based on title and abstract meeting the search criteria with theinclusion of the indicated keywords, resulting in 239 articles that were retrieved from therespective databases. Further reading resulted in the final 82 records included in the reviewthat verify the research criteria for including scientific studies for vineyard yield estimation,prediction, and forecasting. (Figure 1).Figure 1. Systematic review procedure for article selection.The final record data set was categorized based on ten different methodological approaches identified for yield estimation in the screening phase that fall into a broader groupof indirect estimation models derived mainly from dynamic or crop simulation modelsand data-driven models. Those were subdivided according to what can be consideredmore specific approaches: A—data-driven models based on computer vision and image
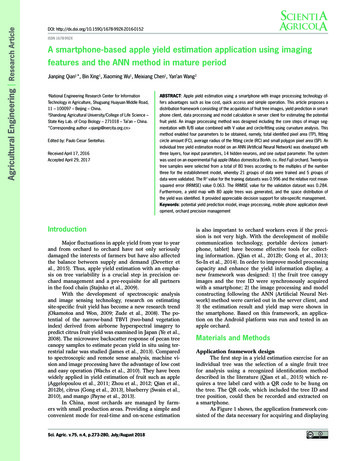
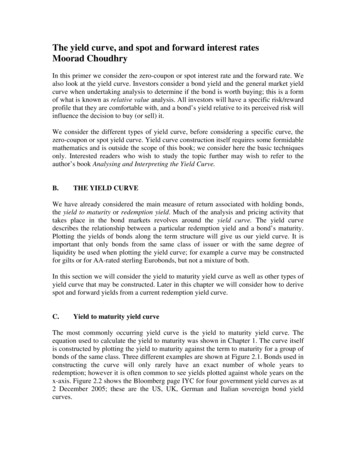
Agronomy 2021, 11, 17894 of 27processing; B—data-driven models based on vegetation indices; C—data-driven modelsbased on pollen; D—crop simulation models; E—data-driven models based on trellistension; F—data-driven models based on laser data processing; G—data-driven modelsbased on radar data processing; H—data-driven models based on RF data processing;I—data-driven models based on ultrasonic signal processing; J—other data-driven models.Data regarding the year, journal distribution, data sources, test environment, applicability scale, and related variables used in estimation and accuracy were evaluated for eachmethodological approach. The abbreviations and acronyms used are listed on Table 1.Table 1. List of abbreviations and VUGVUTVWIWRELMWRELM-TanhReArtificial IntelligenceBig Data AnalyticsBerry numberCation Exchange CapacityComité Interprofessionel du Vin de ChampagneDecision Support SystemFrequency-Modulated Continuous-WaveGrowing Degree DayGreen Normalized Difference Vegetation IndexGeo-spatial TechnologiesInternet of ThingsLeaf AreaLeaf Area IndexLight Detection And RangingMultiple Linear RegressionModified Triangular Vegetation IndexNormalized Difference Vegetation IndexPrecision AgriculturePartial Least Squares RegressionPreferred Reporting Items for Systematic Reviews and Meta-AnalysesProximal SensingPrecision ViticultureRectified Linear UnitRadio FrequencyRandom Forest RegressionRed Green BlueRed Green Blue-DepthRegional Pollen IndexRemote SensingSynthetic Aperture RadarSatellite Pour l’Observation de la TerreSimulateur mulTIdisciplinaire pour les Cultures StandardHyperbolic Tangent functionTrellis Tension MonitorUnmanned Aerial VehicleUnmanned Ground VehicleUtility Terrain VehicleWater IndexWeighted Regularized Extreme Learning MachineTanhRe-based Weighted Regularized Extreme Learning Machine3. Results and DiscussionLooking at the scientific peer-reviewed journal distributions (Figure 2) it is interestingto see the vast scope of this topic in the researcher’s community with publications in 38different journals, most of them with diverse subjects and scopes, ranging from agronomyto robotics, climate, and sensors. The top six cover 45% of the total papers published, withthe remaining 39 (55%) published in 32 different journals.
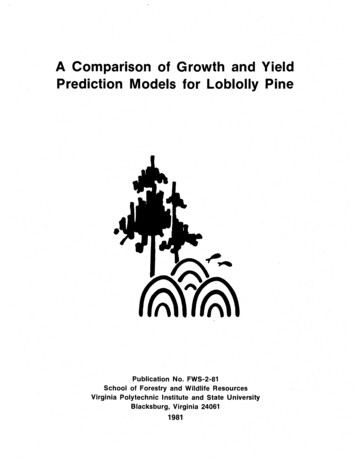
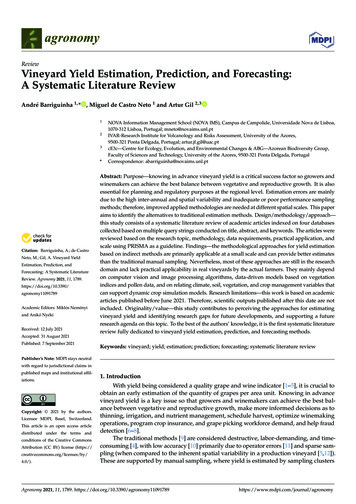
Agronomy 2021, 11, 17895 of 27Figure 2. Distribution according to scientific peer-reviewed journals (top 6 highlighted).For an overall perception of the ten different methodological approaches identifiedfor yield estimation, they are represented in Figure 3, created with Circos [31].Figure 3. Representation of the included records, by research methodology and year of publication.
Agronomy 2021, 11, 17896 of 27On the right side of the semicircle, we can see the methodologies (from A to J), and onthe left side, the years of the publications (from 1987 to 2021-not considering years in whichthere are no identified records). The included records are arranged circularly in segmentsand joined with scaled and colored thickness ribbons to relate the year of publication withthe different methodological approaches quantitatively. The relationship between bothappears in the inner circle. The thickness and the color represent the percentage of therelationship. Taking the year 2020 as an example, we can see that a universe of 18 recordswas included in the present review. From those, 11 (61% of the year 2020 records) arerelated to A (data-driven models based on image processing algorithms), representing 22%of the 50 records on data-driven models based on image processing algorithms. Visuallywe can see that since 2009, there has been a continuous production of articles on this topic,with an increasing interest in research since 2018 with a peak in 2020 (for 2021, the data onlycovers five months). Regarding methodological approaches, the focus of the researchersdealing with this complex topic is on data-driven models based on image processingalgorithms (A) (61%), followed by data-driven models based on vegetation indices (B) (9%)and data-driven models based on pollen (C) (9%).Crop yield estimation has a high degree of complexity. It involves, in most cases, thecharacterization of driving factors related to climate, plant, and crop management [32]that directly influence the number of clusters per vine, berries per cluster, and berryweight, as the three yield components [12], explaining 60%, 30% and 10% of the yieldrespectively [24,33].The different general methodological approaches used for vineyardyield estimation can be divided firstly regarding the scale (in-field level vs. regional level),and secondly, by direct (based on manual sampling) or indirect methods (statistical models,regression models, proximal/remote sensing, and dynamic or crop simulation models)that depend primarily on image identification and/or related climate, soil, vegetation,and crop management variables [32,34,35] that can also support crop simulation models,data-driven [23] and mechanistic growth models [36].The standard or traditional methods retrieve limited data and produce a static prediction in a multi-step process of determining average number of clusters per vine, number ofberries per cluster, and weight per cluster or berry with the growth overall 10% error greatlydependent on adequate staffing and extensive historical databases of cluster weights andyields [37]Computer vision and image processing are leading the alternative methods and areone of the most utilized techniques for attempting an early yield estimation. Still, different approaches such as Synthetic Aperture Radar (SAR), low frequency ultrasound [38],RF Signals [39], counting number of flowers [40–47], Boolean model application [48],shoot count [49], shoot biomass [50,51], frequency-modulated continuous-wave (FMCW)radar [52,53], detection of specular spherical reflection peaks [54], the combination ofRGB and multispectral imagery [55] along with derived occlusion ratios, are alternativemethods.Whatever the indirect method used, they all allow a fast and non-invasive alternativeto manual sampling. They allow identifying single berries in images, even taken froma simple device such as a smartphone [56–58] and then using different methods such asconvolutional neural networks [1,59], cellular automata [60], or even sensors capable ofcollecting phenotypic traits of grape bunches, that are known to be related with grapevineyield [14,61], to estimate yields.Approaches such as non-productive canopy detection using green pixel thresholdingin video frames, local thresholding and Self-Organizing-Maps on aerial imagery [62],light detection and ranging (LiDAR) for vineyard reconstruction [63], and map pruningwood [64] do not allow direct estimation of the yield but instead provide data layers torelate or use directly or as a correction coefficient in other methodologies, as they can showa relationship to yield.Indices have been experiencing exponential growth in research related to productive and vegetative parameters in vineyards [65,66]. Derived from satellite imagery,
Agronomy 2021, 11, 17897 of 27UAVs [65,67], Unmanned Ground Vehicles (UGVs), or those mounted on tractors andUtility Terrain Vehicles (UTVs)[68], Normalized Difference Vegetation Index (NDVI)[11],Leaf Area Index (LAI) [5,68] and Water Index (WI) (with added importance in rainfedvineyards where water deficits play a significant role) [69], are predictors of spatial yieldvariability using passive and/or active sensors.Other indirect methods include Bayesian growth models [70], weather-based models [71], models based on a combination of variables (meteorological, phenological andphytopathological) [6,72], dynamic crop models such as the “Simulateur mulTIdisciplinairepour les Cultures Standard” (STICS) [73,74], crop biometric maps [75], and the continuousmeasurement of the tension in the horizontal (cordon) support wire of the trellis [37,76,77],also used to determine the best moment of hand sampling for yield estimation [78].Predicting yield at a larger scale makes more sense now than ever as inter-annualvariations attributed to climate change are entering a complex equation where quality,sustainability, efficiency, commercial and marketing strategies, regulations, insurances,stock management, and quotas are all related to yield forecasting [24]. However, at aregional level, there are few examples of yield forecasting. Those can be divided mainlyinto climate-based models estimating grape and wine production [23,79–81], pollen-basedmodels [24,82–84], a combination of one or both with phenological and phytopathologicalvariables [6,8], STICS models [74], and models based on correlations with indices such asNDVI, LAI, and NDWI [85].Harvest estimation is a problem to which machine learning, computer vision, andimage processing can be applied using one or a combination of techniques [86–88]. Inproximal sensing methods, detection, segmentation, and counting of either individualgrapes or bunches are complex in most image-based methodologies [38,59,89], especially innon-disturbed canopies where occlusion [15,90], illumination, colors, and contrast [91,92]are challenging and in most cases are only demonstrated conceptually at a small scale [89].Along with Data Science, Artificial Intelligence, and Deep Learning, vineyard yieldestimation can be applied at larger scales, not only through image analysis algorithms butalso by identifying relevant predictive variables using data associated with climate, yield,phenology, fertilization, soil, maturation [23,40] and diseases [93], by making use of a growing number of remote sensing [85] and phenotyping platforms that allow quantitativelyassessing plant traits in which yield falls [94,95].3.1. A-Data-Driven Models Based on Computer Vision and Image Processing (n 50)Table 2 shows the summary of the records included in the systematic review regardingthe use of computer vision and image processing techniques for yield estimation based onimage, recorded mainly with still or mounted standard Red, Green, and Blue (RGB) andRGB-Depth Sensor (D) cameras, for the most under field conditions with a local applicationscale. The main goal is to extract variables from the images that can be related to the actualyield, such as the number of berries, bunch/cluster area, leaf area, number of flowers,stems, and branches. This can be accomplished with various computer vision, machinelearning, and deep learning approaches.Table 2. Summary of records included in the systematic review (data-driven Models based on computer vision and imageprocessing).ReferenceData Sources[10]Digital still RGBcamera[4]Digital still RGBcameraTest EnvironmentScaleRelated VariablesEstimationField/LaboratorylocalCluster Weight, BerryNumber per Cluster,Berry Size, BerryWeight0.76 R2 0.96 (for allvariables)Laboratory-basedlocalBerry number, Berryweight, Bunch Weight0.65 R2 0.97 (forcluster weight)
Agronomy 2021, 11, 17898 of 27Table 2. Cont.ReferenceData Sources[96]Bumblebee2 stereocamera[97]Test EnvironmentScaleRelated VariablesEstimationLaboratory-basedlocalCluster volume andcompactness, berrynumber, size, andweight0.71 R2 0.82 (for allvariables)All-terrain vehicle(ATV) RGB cameraIn-fieldlocalBerry number0.74 R2 0.78 RMSE(for yield)[40]All-terrain vehicle(ATV) RGB cameraIn-fieldlocalNumber of flowersR2 0.70 (for yield)[12]All-terrain vehicle(ATV) RGB cameralocalBerry detection,number of berries,cluster area, clusterweight0.41 R2 0.75 (foryield)[49]Video withCommercial Camera(Go Pro)In-fieldlocalNumber of grapevineshoots86.83% (for shootdetection) and 1.18% error 36.02% (foryield)[51]RGB-D camera(Microsoft Kinect V2sensor)In-fieldlocalBranch volumeR2 0.87 (for yield)[98]Digital still RGBcameraIn-fieldlocalLeaf areaR2 0.73 (for yield)[46]Handheld RGBcameraIn-fieldlocalNumber of flowers,berry weight0.49 R2 0.91 (foryield)[99]RGB cameraIn-fieldlocalLeaf occlusion, yield,bunch number andbunch weight0.42 R2 0.87 (foryield)[56]Smartphone cameraIn-fieldlocalBunch area0.51 R2 0.54 (foryield)[57]Smartphone RGBcameraIn-fieldlocalNumber of berries perbunch91% (for berries perbunch)[41]Digital still RGBcameraLaboratory-basedlocalNumber ofinflorescencesR2 0.80 (for numberof inflorescences)[100]All-terrain vehicle(ATV) StereocameraIn-fieldlocalBerry size, volume,and weight0.76 R2 0.96 (forberry weight)[89]Digital still RGBcameraIn-fieldlocalBunch area87 to 90% (for bunchdetection)precision: 89.7% (forfruits), 57.2% (forstems), 87.6% (forleaves), 5.4% (forbranches)In-field[55]RGB MultipectralcameraIn-fieldlocal% of leaves, stems,branches, fruits andbackground[54]RGB camera at nightunder artificiallightingIn-fieldlocalBerry numberAverage error 14%(for number of ieldlocalBerry number87% berryidentification 94%
Agronomy 2021, 11, 17899 of 27Table 2. Cont.ReferenceData SourcesTest EnvironmentScaleRelated VariablesEstimation[47]Single-lens reflex(SLR) cameraIn-fieldlocalNumber ofinflorescences andsingle flowersPrecision 70.7% (forflower extraction)[101]UAV RGB cameraIn-fieldlocalGrape cluster area0.75 R2 0.82 (forharvest weight)[90]Smartphone cameraIn-fieldlocalBerry numberaverage test error 5%(for berry number)[59]Digital still RGBcameraIn-fieldlocalGrape detectionF1-score 0,91 (forinstance segmentation)[42]Handheld RGBcameraIn-fieldlocalNumber of flowers0.86 R2 0.99 (fornumber of flowers)[102]RGB-D cameramounted on amobile roboticplatformIn-fieldlocalCluster Size2.8–3.5 cm averageerror (for cluster size)[94]Intel RealSenseRGB-D R200imaging systemIn-fieldlocalCanopy volume,bunch detection andcountingmaximum accuracy of91.52% (for detectedfruits)[103]2-D RGB and 3-DRGB-D (Kinectsensor)Field/LaboratorylocalBunch area andvolumeR2 0.89 (yield withRGB) R2 0.95 (yieldwith RGB-D)[104]Microsoft Kinect RGB-depthLaboratory-basedlocalBunch volume trough3D bunchreconstruction10% error 15% (forbunch volume)[105]High resolution RGBimages (20 MP)taken with a UAVIn-fieldlocalCluster number andsizeR2 0.82 (for yield)[106]robot with SICKS300 Expert laserscanner GoProHero 4Field/LaboratorylocalBerry number0.55 R2 0.62 (foryield)[7]RGB camera StereoCamera mounted onUTVIn-fieldlocalGrapes number3% error 4% (foryield)[107]Smartphone (BQAquaris E5) RGBcameraIn-fieldlocalBerry number percluster and clusterweight0.75 R2 0.83 (forberry numbers percluster)[62]Multispectral AerialImage RGB camera(GoPro)In-fieldlocalNon-Productive vinacanopy0.77 precision (row) 0.97 (fornon-productivecanopy)[48]Cluster images,manually acquiredvine images, andvine imagescaptured on-the-gousing a quad.In-fieldlocalNumber of berries incluster images0.50 R2 0.87 (foryield)
Agronomy 2021, 11, 178910 of 27Table 2. Cont.ReferenceData SourcesTest EnvironmentScaleRelated VariablesEstimation[91]RGB imagesField/LaboratorylocalGrape berriesrecognition and grapebunch detectionGrapes bunchesdetection 88.61%;Single berries 99%.[44]RGB cameraField/LaboratorylocalNumber of flowersaccuracy of 84.3% (forflower estimation)[108]Stereo cameraIn-fieldlocalDense 3D model of avineyard and countgrapesR2 0.99 (for grapecount) 0,4% averagepercentage error 41.1% (for overallRachis reconstructionperformance)[61]2D images fromgrape bunchesLaboratory-basedlocalThree-dimensionalgrape bunchreconstruction[13]Track-driven vehicleconsisting of acamera system, areal-time-kinematicGPS system(PHENObot)In-fieldlocalQuantity of grapebunches, berries, andthe berry diameterAverage precision:97.8% (berry yield)localPhysical andmorphologicalparameters from 3Dgrape modelsClose-rangephotogrammetry canbe applied to generate3D grape modelsparameters such asvolume of the grapecan be derived fromthese digital modelslocalGrape-cluster imageanalysis parameters(area and volume)Error 16% (for grapecluster area) 16.7%8for grape clustervolume 0,3%(average)R2 0.75 (for bunchweight)[109]Multi-view imagedatasets from grapesusing close-rangephotogrammetry[92]RGB high-resolutionimages obtainedwith artificialillumination at nightLaboratory-basedIn-field[110]RGB imagesIn-fieldlocal3d grapevine pointcloud, volume, massand number of berriesper bunch[111]RGB cameraField/LaboratorylocalBunch volume0.70 R2 0.91 (foryield)0.82 R2 0.95 (forberry number) 0.85 R2 0.92 (for bunchweight)[112]RGB images withsmartphone cameraIn-fieldlocal3D bunchreconstruction basedon a single image[58]RGB images withsmartphone cameraAPP (vitisBerry)Laboratory-basedlocalBerry counting oncluster imagesRecall 0.8762–0.9082Precision 0.9392–0.9508[43]RGB images withsmartphone cameraAPP (vitisFlower)localNumber of GrapevineFlowers perInflorescence84% of flowers in thecaptures were found,with a precisionexceeding 94%Laboratory-based
Agronomy 2021, 11, 178911 of 27Table 2. Cont.ReferenceData Sources[15]Robot with RGB-DKinect v2 cameraand RGB camera[113]Sideways-facingcamera and lightingon UTVTest EnvironmentField/LaboratoryIn-fieldScaleRelated VariablesEstimationlocalNumber of spurs,shoots, inflorescences,bunches, berries.Bunch volume, maxlength, and perimeter0.29 R2 0.99(between bunchweight and otherbunch attributes)localDetect and countgrape berriesPredict yield ofindividual vineyardrows to within 9.8% ofactual crop weight0.85 R2 0.99 (forfruit pixels/totalimage pixels vs fruitweight)High accuracy in yield[114]RGB imagesIn-fieldlocalAutomatically count‘fruit’ pixels and thetotal number of pixelsfor each image[67]High-resolution RGBimages, acquiredthrough anunmanned aerialvehicle (UAV)In-fieldlocalNumber of clustersand sizeFrom the retrieved results, we can say that computer vision and image processingare the most utilized techniques for attempting an early yield estimation alternatively totraditional sampling methods. The application of this type of methodology mimics forthe most the manual sampling, removing the time-consuming and labor demanding tasksof collecting destructive samples from designated smart points that are weighted andused in extrapolation models adjusted with historical data and empirical knowledge fromthe viticulturist. The process can be divided into the actual data collection—preferablyconducted under field conditions—and the interpretation of the data collected—analyzingthe features collected—resulting in a yield estimation.The images can be acquired using a still camera [4,10,96] in a laboratory or underfield conditions, and also by other optical or multispectral proximal sensors, on-the-gousing ATVs [12,40,97], other terrestrial autonomous vehicles [7,48] including autonomousrobot systems [15,102,106], UAVs [101,105] that cope with the limitations of ground vehicles regarding field conditions (slopes and soil) or in a more simple way on foot with asmartphone [57].Acquiring on-the-go without user intervention represents considerable expectableimprovements regarding traditional methods, as it allows the limit to monitor the entireplot autonomously, creating estimation maps at earlier stages that can be updated regularlyuntil harvest, permitting in some cases viticultural practices that can rectify key parametersand facilitate selective harvest [97]. Also, data collection can be made simultaneous
domain and lack practical applicability in real vineyards by the actual farmers. They mainly depend on computer vision and image processing algorithms, data-driven models based on vegetation indices and pollen data, and on relating climate, soil, vegetation, and crop management variables that can support dynamic crop simulation models.