Transcription
Iñaki AldasoroSebastian DoerrHaonan aonan@princeton.eduNon-bank lenders in the syndicated loan market1Non-bank lenders are an important source of syndicated credit to non-financial corporates inmost regions and industries. Their loan origination, however, is more concentrated by locationand sector than that of banks and it is also more volatile. Syndicated loans arranged by nonbanks carry a significantly higher spread relative to those by banks, consistent with the patternthat firms borrowing from non-banks are more leveraged and less profitable, ie riskier. Nonbanks generally grant a smaller share of their new loans to foreign borrowers than banks do.During domestic financial crises, they reduce this share further, exacerbating the globaltransmission of shocks.JEL classification: E51, F34, G21, G23.The increasing footprint of non-bank financial intermediaries has put them front andcentre of policymakers’ agendas. While they can contribute to a more diversified andefficient financial system, non-banks can also be a source of instability due to, forinstance, liquidity mismatches (Aramonte et al (2021)). With the March 2020 marketturmoil serving as a case study, substantial efforts have been made to understandhow such instability can unfold and what policy measures can mitigate it (Carstens(2021)).The reach of non-banks extends beyond financial market conditions. Non-banklenders represent an important source of funding for non-financial corporates (NFCs)in general (Aramonte and Avalos (2021)) and through syndicated loans in particular(Elliott et al (2019)). As non-banks extend syndicated loans in a highly procyclicalfashion (Fleckenstein et al (2021)) and access to syndicated credit affects firmperformance (Chodorow-Reich (2014)), their ubiquitous presence could drive realeconomy developments.This special feature provides the first systematic overview of global syndicatedlending by non-banks and contrasts it with that by banks.2 It further investigates therole of non-banks in cross-border spillovers during financial crises.1The authors thank Sirio Aramonte, Fernando Avalos, Frédéric Boissay, Claudio Borio, Stijn Claessens,Egemen Eren, Blaise Gadanecz, Ulf Lewrick, Hyun Song Shin, Philip Wooldridge, Youngsuk Yook andNikola Tarashev for valuable comments and suggestions, and Murphy Pan for excellent researchassistance. The views expressed in this article are those of the authors and do not necessarily reflectthose of the Bank for International Settlements.2Syndicated lending by banks has been studied extensively (see Güler et al (2021) for a summary).BIS Quarterly Review, March 202215
Key takeaways Non-banks’ origination of syndicated loans to non-financial firms grew twentyfold from 1990, to 410billion in 2019, and represents a sizeable share of the total in most regions and sectors. Non-banks’ syndicated lending is more concentrated across countries and industries than that ofbanks and it is more volatile. It also carries higher spreads, partly reflecting riskier borrowers. In the wake of a crisis at home, non-banks curtail lending to foreign borrowers by more than they doto domestic ones, thereby transmitting shocks across countries.The main findings are as follows.First, non-banks play an important role in the syndicated loan market, but theirlending patterns differ from those of banks. Non-banks have increased their yearlysyndicated lending twentyfold over the past three decades, serving borrowers in allmajor regions and sectors. Their share in total new syndicated lending fluctuatedbetween 7% and 18% over the same period. Non-bank lending is more concentratedby geographical location and sector than bank syndicated lending. While non-banks’credit provision tends to ebb and flow with that of banks, it is more volatile andcontracted more during the Great Financial Crisis (GFC).Second, loans arranged by non-bank lenders carry materially higher spreads thanthose arranged by banks. The difference in spreads largely reflects a riskier pool ofborrowers and associated risk premia, rather than differences in loan terms.Finally, when facing domestic financial crises, non-bank arrangers retrenchparticularly forcefully from abroad. In general, non-banks exhibit a stronger homebias than banks, as foreign borrowers account for a smaller share in their syndicatedlending. During a financial crisis in their home country, non-banks further reduce theircredit provision abroad, and do so more than banks. Such retrenchment, so farestablished for banks only (Giannetti and Laeven (2012)), suggests that non-bankstransmit financial shocks across countries.The rest of this article is organised as follows. The first section discusses the mainfeatures of syndicated lending and the classification of lenders into banks and nonbanks (Box A). The second section documents patterns in non-bank syndicatedlending across countries, industrial sectors and over time. The third discussesdifferences in loan terms and borrower characteristics between banks and non-banklenders, assessing to what extent they explain loan spreads. The fourth sectioninvestigates how non-banks adjust their lending in foreign and domestic marketsduring domestic financial crises, with details summarised in Box B. The final sectionconcludes with policy considerations.The syndicated loan market and non-bank lendersSyndicated loans are an important financing source for non-financial firms. Theyrepresent around three quarters of total cross-border lending to NFCs in high- andmiddle-income countries (Doerr and Schaz (2021)) and are particularly important for16BIS Quarterly Review, March 2022
larger firms (Cerutti et al (2015)). Consequently, changes in the supply of syndicatedcredit influence firm investment and employment (Acharya et al (2018)).3A syndicated loan is granted by a group of financial institutions (the “syndicate”)to a single borrower. The lending syndicate includes at least one lead institution (the“lead arranger(s)”, sometimes called “underwriter(s)”) as well as one or moreparticipants. Lead arrangers negotiate preliminary loan terms and conditions and,upon agreement with the borrower, put together the group of participants to fundparts of the total loan amount. In return, lead arrangers receive an arrangement fee(Gadanecz (2004)).In the loan’s life cycle, lead arrangers typically act as the agent bank and performdue diligence. They ensure screening and monitoring, govern the terms of the loansand enforce covenants. In line with their responsibility as monitors, lead arrangersretain a larger portion of the loan on their balance sheets, while participants often selltheir tranches on the secondary market (Sufi (2007)).This feature analyses loan originations using detailed deal-level data on globalsyndicated lending from Thomson Reuters’ DealScan. The sample period is from 1990to 2019. Information on loans at origination includes the loan amount, maturity,currency of denomination and interest rate, as well as the identity, type, location andindustry code of borrowers and lenders (banks as well as non-banks). All loanamounts are converted to US dollars. To attribute loan portions among members, weuse the allocation provided by DealScan or, if this is not available, allocate pro rata.Henceforth, we will refer to the syndicated loan amounts attributed at origination tobanks or non-banks as “bank loans” or “non-bank loans”, respectively. There is nopublic information to track loan sales on the secondary market.4We identify non-bank lenders based on information provided by DealScan, incombination with Standard Industrial Classification codes, string search and manualchecks. In our sample, non-bank lenders include investment banks (or brokerdealers), finance companies and mutual funds – in line with the categorisation usedby the Financial Stability Board (2021).5 Investment banks and finance companiesaccount for over four fifths of aggregate non-bank syndicated lending.Non-bank lenders have gained a large footprint in the syndicated loan marketand their participation is now comparable with that of banks along importantdimensions. The share of all loan facilities with non-bank involvement exceeds onethird. Around two fifths of all non-bank lenders active in the syndicated loan marketact as lead arrangers, a share similar to that of banks. Likewise, individual membersof both types contribute comparable shares to the total syndicated amount onaverage and extend loans for similar purposes (eg working capital, debt repayment3For the real effects of bank syndicated lending, see also Doerr et al (2018), Hale et al (2020) andChodorow-Reich and Falato (2022). These papers build on work showing that lender-borrowerrelationships are sticky and that the costs of switching between lenders are high, especially duringdownturns (Sette and Gobbi (2015), Bolton et al (2016)).4While such information is important to accurately assess lenders’ risk exposures, it is less relevant forunderstanding patterns in the origination of new credit, which is key from the borrower’s perspectiveand is the focus of this special feature. That said, non-banks purchase a significant amount of loansin the secondary market (Aramonte et al (2019)). Accordingly, loan volumes at origination probablyrepresent a lower bound of the ultimate financing provided by non-banks to NFCs.5Broadly speaking, non-bank lenders differ from banks in their funding structure and their lack ofaccess to public backstops. For example, their funding tends to be largely wholesale (Jiang et al(2020), Xiao (2020)) and they are not eligible for deposit insurance. There is, however, no harmonisedor universally accepted definition of non-bank lenders.BIS Quarterly Review, March 202217
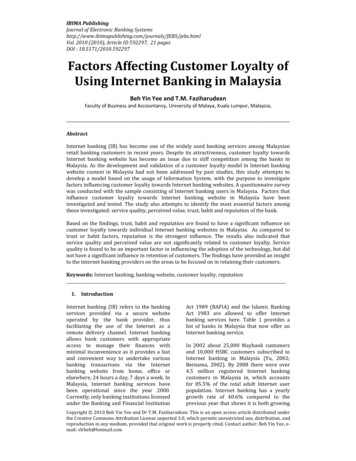
or capital expenditure). That said, credit lines are more common among banks atorigination and term loans are more common among non-banks.Box A presents further details on the data construction, classification of banksand non-bank lenders, and their role in syndicates.Box AIdentifying non-bank lenders in the syndicated loan marketIñaki Aldasoro, Sebastian Doerr and Haonan ZhouFor the analysis of the syndicated loan market, we categorise lenders into banks and non-banks. This box outlines thetwo underlying steps. First, we build on lender type information provided by DealScan. Consistent with the notion of banks representingdeposit-taking institutions, we define bank lenders as commercial banks, classified by DealScan as “African bank”,“Asia-Pacific bank”, “Eastern European/Russian bank”, “foreign bank”, “Middle Eastern bank”, “mortgage bank”,“thrift/S&L”, “US bank” or “Western European bank”. Non-banks comprise the remaining lenders. Around 20% oflenders, however, are initially unclassified.In a second step, we improve on this classification by using lenders’ Standard Industrial Classification (SIC) sectorcodes as well as a string search procedure. In particular, we look for matches with names of major commercial banks,descriptions of activities (such as “bank“, “life insurance”, “trust” and “securities”), or variants of spelling in differentlanguages (eg “banca”, “banco”, “banque”). These procedures allow us to categorise around three quarters of theoriginally unclassified lenders, splitting them roughly equally between the bank and non-bank groups. We allocatethe still unclassified lenders, mostly middle-market debt management companies, to the non-bank category.Ultimately, we classify almost 7,500 lenders as non-banks, out of a total of 19,000 lenders.Different types of non-bank lender in the syndicated loan marketInvestment banks dominate nonbank lending volumes USD bn serving more borrowers than othernon-banks, and with larger amountsOther key loan terms do not differmuch across non-bank lenders2USD mnBasis 013518060240409012040120204560200000Investment Financebankscompanies1995 2000 2005 2010 2015Investment banksFinance companiesGraph AOtherAmount (lhs)OtherBorrowers (rhs)10Investment FinancebankscompaniesSpread (lhs)OtherMaturity (rhs)The centre and right-hand panels show average results for the full sample (1990–2019).Number of distinct borrowers in a given year. 2 Spread and maturity are winsorised at the 1st and 99th percentiles. The spread refers tothe all-in drawn spread, weighted by loan volume.1Sources: Thomson Reuters DealScan; authors’ calculations.18BIS Quarterly Review, March 2022
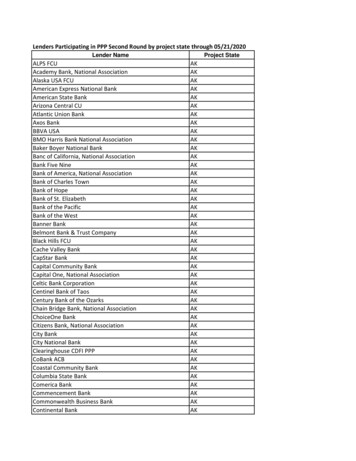
Finance companies and investment banks account for the bulk of non-bank syndicated lending. While only 3%of non-bank lenders are investment banks, these account for around half of the total amount of non-bank lending toNFCs from 1990 to 2019 (Graph A, left-hand panel). This group of non-bank lenders can include, among others,brokerage and securities underwriting firms or an international bank‘s broker-dealer subsidiary. Finance companies,in turn, comprise 44% of the non-bank lenders and account for 34% of total non-bank lending. This group can includefinancial institutions that specialise in industrial loans or the financial arms of large companies. Other lenders, such asinsurance companies, pension funds and mutual funds, have a small presence in the primary market for syndicatedloans in the data. Over the sample period (1990–2019), investment banks served more clients and extended largerloans than did finance companies and other non-bank lenders (centre panel). Loan spreads and maturities were ofcomparable magnitude across non-bank lender types (right-hand panel).Non-banks participate in a significant number of syndicated loans, contributing – at the level of individual lenders– similar amounts to syndications as banks, and often acting as lead arrangers. Overall, the share of loan facilities withnon-bank involvement is 37%, vs 88% with bank involvement. Individual non-bank syndicate members account, onaverage, for 19% of the total syndication amount in a given syndicate, vs 17% for banks. On average, 36% of all nonbanks active in the syndicated loan market have acted as lead arrangers at least once, compared with 42% for banks.While 72% of all syndicates have only bank lead arrangers, just 7% of all loans are arranged by non-banks exclusively.These patterns are similar across deals involving borrowers in advanced vs emerging market economies (EMEs).When it comes to the type of loan and loan purpose, patterns are broadly comparable between non-banks andbanks. Credit lines comprise 41% and term loans 48% of all non-bank loans, compared with 50% and 40% for banks. For both lender types, term loans are more common among EME borrowers. As regards loan purposes, there are nosignificant differences, with “corporate purposes” and “debt repayment” dominating for both banks and non-banks. Prior to the classification, we drop incomplete deals and those involving government-linked lenders. In particular, we drop deals with thestatus “cancelled”, “suspended” or “rumour”, and deals with missing information on amounts and loan packages that amend previous deals.We further drop deals involving supranational organisations, governments and development banks based on string matches and SIC codes.In cases where only the aggregate size of the loan is known or for loan facilities with lending shares totalling more than 110%, we impute thelending share of each participant using pro rata splits. For instance, we assign lenders with SIC code 6211 (“Security brokers, dealers,and flotation companies”), classified as commercial banks by DealScan, to the non-bank group. This is in line with policy practice (FinancialStability Board (2021)) and academic literature (Elliott et al (2021)). Other types include bridge loans or leases.Patterns in non-bank syndicated lendingNon-bank syndicated lending has grown with the overall market, both domesticallyand internationally. Total new syndicated lending to NFCs increased substantially,from under 300 billion originated in 1990 to around 4,750 billion in 2019. Nonbank lending increased from 20 billion to 410 billion per year over the same period(Graph 1, left-hand panel). Its share of total loan originations steadily increased toaround 14% in 2007 but contracted sharply during the GFC. This share trended upagain from 2010 to 2019. Foreign loans, ie loans to borrowers located in a jurisdictionother than the lender’s home country, follow a similar pattern, albeit at a lower level.Growth in non-bank syndicated lending is more volatile than that of banks. Onaverage across borrower countries, the standard deviation of the growth in loanorigination is almost 60% higher for non-bank than bank loans (Graph 1, centrepanel). While the volatility is in general higher for emerging market economy (EME)borrowers than for those from advanced economies (AEs), non-bank lending is morevolatile than bank lending in both regions. Higher volatility meant greaterprocyclicality during the GFC, when non-banks cut their syndicated loan originationby twice as much as banks, in a pattern typical for crisis times (Fleckenstein et al(2021), Aldasoro et al (2022b)).BIS Quarterly Review, March 202219
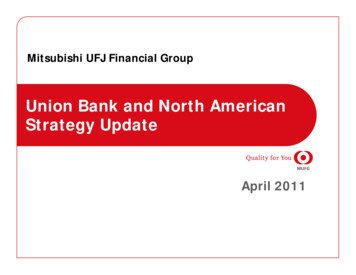
Non-bank syndicated lending to non-financial corporatesPer centLending by non-banks is morevolatile than that of banks 2, 3 but growth in non-bank and banklending is strongly correlated2, 4USD bnStandard deviation in growth .200.001990 1995 2000 2005 2010 2015Share (lhs)Total1ForeignAEsNon-bank lending 0.2AEs–1Growth in bank lending (%)Volumes and shares of totalsyndicated lendingGraph 1–0.4012Growth in non-bank lending (%)AEs advanced economies; EMEs emerging market economies.1A loan is classified as foreign if the location of the lender’s headquarters differs from that of the borrower. 2 Data are aggregated to theborrower-country-year level and split by the region of the borrower. The underlying sample covers 1,863 borrower-country-year observationsfrom 119 countries from 1990 to 2019. Loan growth is computed as the difference in the logs of loan origination volumes and is winsorisedat the 1st and 99th percentiles. 3 Standard deviation of loan growth from 1990 to 2019, averages across borrower countries within a group,for a given lender type. 4 Binned scatter plot, which enhances readability by grouping observations into equally spaced bins and reportingthe average value within each bin; region-specific fitted lines.Sources: Thomson Reuters DealScan; authors’ calculations.Differences in volatilities notwithstanding, bank and non-bank lending move intandem, especially for loans granted to borrowers from AEs. The overall correlationbetween bank and non-bank loan growth stands at 0.50 on average across borrowercountries. For loans granted to NFCs in EMEs, the correlation is 0.36, whereas it is 0.54in AEs (Graph 1, right-hand panel). Together with the greater volatility in loanoriginations, this positive correlation casts doubt on the notion that non-banksprovide a “spare tyre” for borrowers when banks retrench.Non-banks serve firms in all regions and sectors. In terms of geographical reachover the full sample period, the share of non-bank loans in total loans is largest inSouth Asia and that in foreign loans is largest in East Asia and the Pacific (Graph 2,left-hand panel). Among the major economies, the share of syndicated borrowingfrom non-banks averages 14% for the United States and 3% for China. In terms ofsectoral presence, the average share of non-bank loans in total new syndicatedlending ranges from 6.4% in the construction sector to 14.2% in services (centrepanel).Despite their global presence, non-banks’ origination of loans is moreconcentrated than that of banks. The average non-bank serves fewer distinctborrowers than the average bank (around 330 vs 740 per year) and does so in anarrower set of regions and sectors. Accordingly, loan origination by non-banks ismore concentrated across borrower countries and industries (Graph 2, right-handpanel).20BIS Quarterly Review, March 2022
Non-bank lending is pervasive but less diversified than bank lendingOn aggregate, non-banks serve nonfinancial corporates in all regions and all major sectors Graph 2 but individual lenders’ loanorigination is more concentratedPer centPer centMiddle East &North AfricaAgriculture,forestry and fishingEurope &Central untriesAcrossindustriesAcrossborrowers 0.80.6ManufacturingLatin America &CaribbeanTransportation &public utilitiesEast Asia &Pacific0.4Wholesale tradeNorth America0.2Retail tradeSouth AsiaServices05101551015Share of non–bank lending1Share of non–bank lendingTotal lending0.001nknkBa n-baNoForeign lending2nknkBa n-baNonknkBa n-baNoHerfindahl-Hirschman index3Average results for the full sample (1990–2019).1Total amount of syndicated loans originated by non-bank lenders over the total origination amount of syndicated loans in the borrowerregion/industry. 2 A loan is classified as foreign if the locations of the lender parent and the borrower differ. 3 Averaged HerfindahlHirschman index (HHI) calculated for each lender across all borrower countries, two-digit borrower industries, and individual borrowers,respectively.Sources: Thomson Reuters DealScan; World Bank; authors’ calculations.Loan terms and borrower characteristicsWe first provide a comparison of banks’ and non-banks’ borrower characteristics andsyndicated loan terms. Then, motivated by the patterns thus revealed, we zoom in onpotential drivers of the notable difference in loan spreads.Loans with non-bank participation carry materially higher spreads than thosewith bank participation only. The average all-in spread, defined as the annual spreadover Libor, including fees and interests and weighted by loan size, equals 253 basispoints on syndicated loans with non-bank involvement, vastly exceeding that onbank-only loans (170 basis points). While average spreads trended upwards until2010 and receded somewhat since then for both lender types, the difference in loanspreads has remained relatively constant (Graph 3, left-hand panel). These patternsare robust to zooming in on lead arrangers only.Banks and non-banks originate loans of similar amounts and maturity. Theaverage loan amount granted by banks stands at 44 million, roughly the same asthe 42 million granted by non-bank lenders (Graph 3, right-hand panel). Thecorresponding maturities are also similar, at 60 and 55 months respectively. Again,the patterns persist when considering lead arrangers only.BIS Quarterly Review, March 202221
Non-bank loans carry higher spreads, but are of similar amount and maturityNon-bank loans carry higher spreads 1 but banks and non-banks extend loans of similaramount and maturityBasis points19901995Banks200020052010Graph 3USD 50002015BanksNon–banksAmount (lhs)Non-banks2Maturity (rhs)Average results for the full sample (1990–2019) are shown in the right-hand panel.1“All-in drawn spread”, defined as the spread over Libor, including fees and interests.2Averages weighted by loan size.Sources: Thomson Reuters DealScan; authors’ calculations.By contrast, firms borrowing from syndicates with non-bank lenders appear tobe riskier.6 The average firm receiving syndicated credit from non-banks has a lowerreturn on assets, higher leverage and a lower interest coverage ratio than firmsobtaining syndicated loans from banks only (Table 1). Unreported tests show thatthese differences remain material even among firms of similar size and operating inthe same location and industry. They are also present when we classify firms by theirconnection to bank or non-bank lead arrangers.Firms borrowing from non-banks have lower returns and higher leverageAssets(USD mn)Employees(’000)Interestcoverage ratioTable 1Leverage(ratio)Return onassets (%)Borrows from banks only5,18013.6522.811.926.42Borrows from non-banks10,70324.9912.482.616.01The table compares non-financial corporates (NFCs) that borrow only from banks with NFCs that borrow from at least one non-bank lenderon the syndicated loan market. Assets are in USD millions. Employees are in thousands. The interest rate coverage ratio is computed asearnings over interest expenses. Leverage is defined as the sum of long-term debt and current liabilities over total equity. Return on assetsis defined as operating income net of depreciation over total assets, in per cent. The sample covers 14,443 unique NFCs with 56,295 borroweryear observations in total. The sample period is from 1990 to 2019.Sources: Chava and Roberts (2008); S&P Compustat; Thomson Reuters DealScan; authors’ calculations.622We link the DealScan data set to balance sheet data on listed firms from Compustat Global and NorthAmerica following the updated matching table of Chava and Roberts (2008). Around 40% of allobservations are matched, as not all borrowing firms are covered in Compustat. Firms borrowingfrom at least one non-bank in a given year account for 19,500 firm-year observations. The smallsample of firms borrowing exclusively from non-banks (ca 2,500 observations) exhibits similarpatterns in the measures of risk. Among firms with credit ratings, the share rated high-yield issignificantly higher for NFCs borrowing from non-banks.BIS Quarterly Review, March 2022
We now examine to what extent loan and borrower characteristics drive thespread differential in a regression analysis. The analysis focuses on lead arrangers asthey negotiate loan terms and usually contribute material shares to the syndicationamount.Loan characteristics explain only a small part of the spread differential. We startby recording that the average loan spread on loans with non-bank arrangers is 84basis points higher than on those without (Table 2, column 1). Accounting for loanamounts, maturity and loan currency narrows the gap only marginally, to 77 basispoints (column 2). This is consistent with the earlier finding that loan terms arebroadly comparable across lender types.Borrower characteristics, on the other hand, explain a significant fraction of thehigher spread on loans arranged by non-banks. Accounting for borrowers’ countryand industry as well as the year of origination reduces the difference by one third, to50 basis points (Table 2, column 3). Further considering differences in borrowercharacteristics such as size, profitability and leverage halves the remaining differenceBorrower characteristics largely account for higher spreads on non-bank loansTable 2(1)(2)(3)(4)Dependent .599)Loan maturityLoan �7.674***(1.456)–23.015***(1.068)Return on Interest coverage ratio–0.108***(0.028)Currency fixed effects (FEs)NoYesYesYesCountry-industry-year 00.4830.608Number of observationsR-squaredObservations are at the lender-borrower-year level and the sample is restricted to lead arrangers. The dependent variable is the all-in spread,defined as the spread over Libor, including fees and interests. It is winsorised at the 1st and 99th percentiles. Column (1) includes the dummynon-bank, which takes on a value of one if the lender is a non-bank. Column (2) adds the logarithm of loan maturity in months (loan maturity)and the logarithm of loan amount in million US dollars (loan amount), as well as currency fixed effects. Column (3) adds borrower countryindustry-year fixed effects. Finally, column (4) adds borrower-specific balance sheet controls obtained from Compustat (see the notes of Table1 for variable definitions). The reduction in sample size in this last column is due to the unavailability of balance sheet data for some of thefirms borrowing in the syndicated loan market. Standard errors are clustered at the lender level. ***/**/* indicates statistical significance atthe 1/5/10% level. The sample period is from 1990 to 2019.Sources: S&P Compustat; Thomson Reuters DealScan; authors’ calculations.BIS Quarterly Review, March 202223
to 27 basis points (column 4). Thus, borrower riskiness is a key driver of the spreaddifferential.7The remaining difference in loan spreads between bank and non-bank arrangerscould be explained by lender-specific factors. For example, a closer lender-borrowerrelationship has been shown to lead to higher spreads to compensate for betteraccess to credit during shocks (Bolton et al (2016)). Lower geographical diversificationhas also been associated with higher spreads (Keil and Müller (2020)). Further, ahigher market share in a sector could allow lenders to charge relatively higher interestrates (De Jonghe et al (2020)). Exploring these dimensions in the context of non-bankswould be an interesting avenue for future work.Non-banks and the global transmission of shocksNon-banks’ large global footprint could have implications for shock transmissionacross borders. As the volume of non-banks’ syndicated lending expanded, so did theattendant share of credit to foreign borrowers, from 3% for the average lender in theearly 1990s to 11% in 2019 (Graph 4, left-hand panel). This share is even higher forlarger lenders. A retrenchment of such international presence could have materialimplications in the borrower countries.To investigate how non-banks’ global lending responds to negative shocks, weanalyse whether non-bank lenders exhibit a “flight home” effect. So far establishedfor banks only, this effect refers to banks cutting their lending in foreign markets bymore than they do in their domestic market following a financial crisis in their homecountry (Giannetti and Laeven (2012)). The relative retrenchment has been shown tobe stronger for banks with higher exposure
Non-bank lenders in the syndicated loan market1 Non-bank lenders are an important source of syndicated credit to non-financial corporates in most regions and industries. Their loan origination, however, is more concentrated by location and sector than that of banks and it is also more volatile. Syndicated loans arranged by non-