Transcription
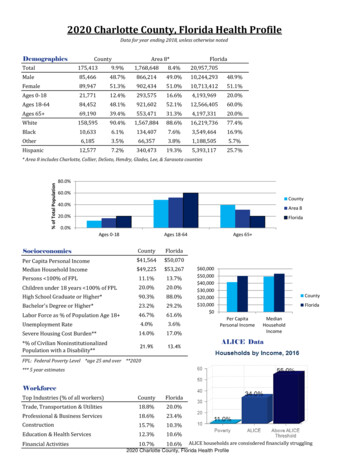
2020 Charlotte County, Florida Health ProfileData for year ending 2018, unless otherwise notedDemographicsCountyArea 4751.3%902,43451.0%10,713,41251.1%Ages 0-1821,77112.4%293,57516.6%4,193,96920.0%Ages 18-6484,45248.1%921,60252.1%12,566,40560.0%Ages 65 5.7%% of Total Population* Area 8 includes Charlotte, Collier, DeSoto, Hendry, Glades, Lee, & Sarasota counties80.0%60.0%County40.0%Area 820.0%Florida0.0%Ages 0-18Ages 18-64SocioeconomicsCountyFloridaPer Capita Personal IncomeMedian Household Income 41,564 50,070 49,225 53,267Persons 100% of FPL11.1%13.7%Children under 18 years 100% of FPL20.0%20.0%High School Graduate or Higher*90.3%88.0%Bachelor's Degree or Higher*23.2%29.2%Labor Force as % of Population Age 18 46.7%61.6%Unemployment Rate4.0%3.6%Severe Housing Cost Burden**14.0%17.0%*% of Civilian NoninstitutionalizedPopulation with a Disability**21.9%13.4%Ages 65 60,000 50,000 40,000 30,000 20,000 10,000 0CountyFloridaPer CapitaPersonal IncomeMedianHouseholdIncomeALICE DataFPL: Federal Poverty Level *age 25 and over **2020*** 5 year estimatesWorkforceTop Industries (% of all workers)CountyFloridaTrade, Transportation & Utilities18.8%20.0%Professional & Business Services18.6%23.4%Construction15.7%10.3%Education & Health Services12.3%10.6%Financial Activities10.7%10.6% ALICE households are consisdered financially struggling2020 Charlotte County, Florida Health Profile
Crime3-year rate per 100,000, tal Domestic Violence Offenses326.6Positive514.31Aggravated Assault183.1Negative280.41Forcible Sex Offenses27.7Inconsistent54.41Age-Adjusted Suicide Death Rate17.2Positive14.53Alcohol-suspected Motor Vehicle Traffic Crash 1*2015-2017 dataHealthcare Utilization & ResourcesLicensed Health Professionals*Rate per 100,000CountyFloridaTotal Hospital Beds398.5308.2Acute Care Beds353.5Specialty BedsRate per /GYNs6.09.345.059.2Pediatricians9.322.0Nursing Home Beds706.9399.8Dentists38.956.7County Health Dept FTE*32.342.9 24.20 33.60County Health Dept Expenditures***Number of licensed providers does notnecessarily equal the number of practicingproviders. †fiscal year ending 2019*fiscal year ending 2019, FTE: full-time employees**Dollars ( ) expended per person, fiscal year ending 2019Healthcare Access*With Health Insurance CoverageNo Health Insurance CoverageCharlotte CountyPercentage of CivilianNoninstitutionalizedPopulation88.7%Florida Percentage TrendPositive13.5%*5 year estimatesHealth Insurance Coverage% of Total Populationcivilian noninstitutionalized population 19 to 64 0.0%insureduninsuredEmployedUnemployedSchool-Aged ChildrenNot in labor forcePopulation with a DisabilityPercentagesCountyFloridaImmunization at Kindergarten94.4%93.8%Third Grade Language Arts Proficiency*69.0%58.0%High School Graduation Rate**86.4%86.9%Middle School Students Eligible for Free/Reduced Lunch**2019 data **2018-2019 School Year47.6%55.4%2020 Charlotte County, Florida Health Profile
CountyFloridaAge-AdjustedRate / 100,000TrendAge-AdjustedRate / 100,000CountyQuartileAll nt146.22Heart Disease115.3Inconsistent147.71Chronic Lower Respiratory Disease42.1Negative38.42Alzheimer's Disease21.6Inconsistent20.03StrokeUnintentional abetes18.2InconsistentInfulenza and Pneumonia15.7Inconsistent20.49.824Chronic Liver Disease and Cirrhosis21.7Negative12.04Mortality & Leading Causes of DeathAge-Adjusted Rate per 100,000, 2018County Health Rankings2020County4.5FloridaAdult Smoking16%16%Adult Obesity28%27%Physical Inactivity26%26%Access to Exercise Opportunities81%89%Food InsecurityDrug Overdose Deaths (rate per 100,000)13%813%23.0Disconnected Youth7%7%Poor Mental Health Days4.0County Health Rankings by the Robert WoodJohnson Foundation ranks all counties in a statebased on health data. Charlotte County wasranked 28th out of the 67 counties inFlorida for Health Outcomes and 11th out of67 for Health Factors. The data to the left aresome of the factors tracked by County HealthRankings. Most of the data included in the 2020rankings is from 2018.Maternal and Infant al Births (3 yr annual avg)1,045Teen (15-19) Birth Rate*20.1Positive18.22Neonatal Death Rate (0-27 Days)*5.7Negative4.14Infant Death Rate (0-364 Days)*7.7Inconsistent6.13Low Birthweight 2500 Grams (% of Live Births)9.0%Negative8.7%2% of Live Births with Late or No Prenatal Care8.5%Negative6.7%3% of Births with 1st Trimester Prenatal rtileInfectious Syphilis Cases1.3Steady12.41Gonorrhea ent485.52AIDS Cases2.7Inconsistent9.81Tuberculosis Cases1.7Inconsistent2.92*per 1,000 birthsCommunicable Diseases3-year rate per 100,000, 2016-20182020 Charlotte County, Florida Health Profile
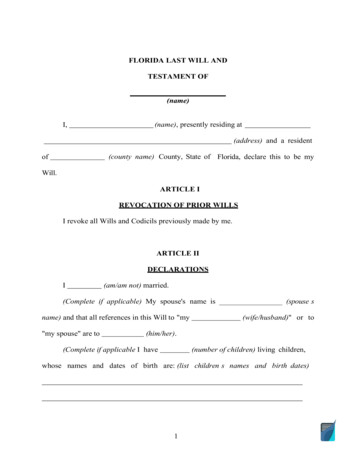
Charlotte County, FloridaAccording to the 2010 Census, Charlotte County had the second highest median age of anyU.S. county with a population of more than 100,000 people at 55.9. Its county seat is PuntaGorda, Florida, and also includes the unincorporated towns of Port Charlotte and Englewood.Port Charlotte was named to Forbes' list of 25 Best Places to Retire in both 2015 and 2017.Charlotte County's cost of living is 6% lower than the national average. Charlotte County hasa primary care health shortage for their low income population, a dental health care shortagefor their low income population, and a mental health shortage for their low incomepopulation (Port Charlotte). The climate is warm year-round, with a high of 75 in January(low of 50) and a high of 92 in July (low of 74). In Charlotte County, 83% of the populationhas adequate access to locations for physical activity. In 2018, Charlotte County wasrecognized as a Healthy Weight Community Champion.Health Planning Council of Southwest FloridaThe Health Planning Council of Southwest Florida, Inc. is one of eleven local health planningcouncils in the state of Florida, serving the counties in Area 8: Charlotte, Collier, DeSoto,Glades, Hendry, Lee, and Sarasota. HPCSWF works to increase the availability andaccessibility of data regarding health needs and services within the region. Of particularinterest to the HPCSWF is to improve access to health care for persons with limited financialresources and to reduce disparities in health status. We offer data subscriptions for hospitaland nursing home utilization reports, planning and implementation support for agencies,counties, and health departments across southwest Florida, and are available to conductcommunity assessments as requested.Health Planning Council of Southwest Florida, Inc.serving Charlotte, Collier, DeSoto, Glades, Hendry, Lee & Sarasota Counties8961 Daniels Center Drive, Ste. 401, Fort Myers, FL 33912239.433.6700 www.HPCSWF.com2020 Charlotte County, Florida Health Profile
2020 Collier County, Florida Health ProfileData for year ending 2018, unless otherwise notedDemographicsCountyArea 6,65650.8%902,43451.0%10,713,41251.1%Ages 0-1863,53217.3%293,57516.6%4,193,96920.0%Ages 18-64188,25951.2%921,60252.1%12,566,40560.0%Ages 65 11725.7%% of Total Population* Area 8 includes Charlotte, Collier, DeSoto, Hendry, Glades, Lee, & Sarasota counties80.0%60.0%County40.0%Area 820.0%Florida0.0%Ages 0-18Ages 18-64Ages 65 SocioeconomicsCountyFloridaPer Capita IncomeMedian Household Income 92,686 50,070 65,675 53,267Persons 100% of FPL10.6%13.7% 100,000Children under 18 years 100% of FPL18.5%20.0% 80,000High School Graduate or Higher*86.4%88.0%Bachelor's Degree or Higher*36.2%29.2%Labor Force as % of Population Age 18 59.5%61.6%Unemployment Rate3.4%3.6%Severe Housing Cost Burden**16.0%17.0%% of Civilian NoninstitutionalizedPopulation with a Disability***11.4%13.4%Top Industries (% of all workers)CountyFloridaProfessional & Business Services23.7%23.4%Trade, Transportation & Utilities16.2%20.0%ConstructionFinancial ActivitiesOther ServicesEducation & Health Services14.7%13.4%9.0%8.8%10.3%10.6%8.0%10.6% 60,000 40,000County 20,000Florida 0Per CapitaIncomeMedianHouseholdIncomeALICE DataFPL: Federal Poverty Level *age 25 and over **2020*** 5 year estimatesWorkforceALICE households are consisdered financially struggling2020 Collier County, Florida Health Profile
02207.1Positive422.21Total Domestic Violence Offenses441.1Inconsistent514.32Aggravated Assault196.6Inconsistent280.41Forcible Sex Offenses39.7Negative54.42Age-Adjusted Suicide Death Rate12.0Inconsistent15.31Alcohol-suspected Motor Vehicle Traffic Crash Deaths*2.5Positive4.11Murder2.4Negative5.313-year rate per 100,000, 2016-2018CountyLarcenyBurglary* 2015-2017 dataHealthcare Utilization & ResourcesRate per 100,000Total Hospital BedsAcute Care BedsSpecialty BedsNursing Home BedsCounty Health Dept FTE*County Health Dept Expenditures**Licensed Health 01.9399.8Dentists75.756.744.742.9 31.40 33.60*fiscal year ending 2019, FTE: full-time employees**Dollars ( ) expended per person, fiscal year ending 2019Healthcare Access*With Health Insurance CoverageRate per 100,000†County286.0Collier CountyPercentage of CivilianNoninstitutionalizedPopulation83.5%No Health Insurance CoverageCounty Florida*Number of licensed providers does notnecessarily equal the number of practicingproviders. †fiscal year ending 2019Florida Percentage TrendPositive13.5%*5 year estimatesHealth Insurance Coveragecivilian noninstitutionalized population 19 to 64 years% of Total nsured20.0%10.0%0.0%EmployedUnemployedNot in labor forceSchool-Aged ChildrenPopulation with a DisabilityPercentagesCountyFloridaImmunization at Kindergarten92.8%93.8%Third Grade Language Arts Proficiency*61.0%58.0%High School Graduation Rate**91.9%86.9%Middle School Students Eligible for Free/Reduced Lunch**2019 data **2018-2019 School Year62.3%55.4%2020 Collier County, Florida Health Profile
CountyFloridaAge-AdjustedRate / 100,000TrendAge-AdjustedRate / 100,000CountyQuartileAll nt146.21Heart intentional Injury46.5Inconsistent53.81Chronic Lower Respiratory Disease15.3Positive38.41Alzheimer's hronic Liver Disease and nsistent15.31Mortality & Leading Causes of DeathAge-Adjusted Rate per 100,000, 2018County Health Rankings2020County3.9FloridaAdult Smoking14%16%Adult Obesity21%27%Physical Inactivity23%26%Access to Exercise Opportunities91%89%Food InsecurityDrug Overdose Deaths (rate per 100,000)10%1613%23.0Disconnected Youth7%7%Poor Mental Health Days4.0County Health Rankings by the Robert WoodJohnson Foundation ranks all counties in a statebased on health data. Collier County was rank2nd out of the 67 counties in Florida forHealth Outcomes and 6th out of 67 forHealth Factors. The data to the left are some ofthe factors tracked by County Health Rankings.Most of the data included in the 2020 rankingsis from 2018.Maternal and Infant al Births (3 yr annual avg)3,234Teen (15-19) Birth Rate*17.9Positive18.21Neonatal Death Rate (0-27 Days)*4.1Inconsistent4.12Infant Death Rate (0-364 Days)*5.2Inconsistent6.11Low Birthweight 2500 Grams (% of Live Births)7.2%Negative8.7%1% of Live Births with Late or No Prenatal Care7.3%Inconsistent6.7%3% of Births with 1st Trimester Prenatal rtile*per 1,000 birthsCommunicable Diseases3-year rate per 100,000, 2016-2018Infectious Syphilis Cases4.5Steady12.41Gonorrhea 1AIDS Cases6.6Negative9.83Tuberculosis Cases3.4Inconsistent2.932020 Collier County, Florida Health Profile
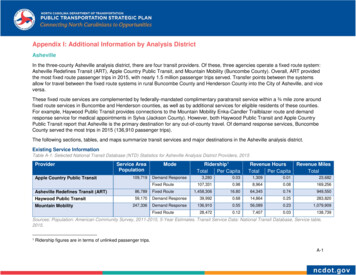
Collier County, FloridaCollier County includes Naples, Marco Island, and Everglades City. It also includes theunincorporated area of Immokalee. Its county seat is Naples. Collier County is the largestcounty by land area in the state of Florida, with a total area of 2,305 square miles. In 2018and 2019, Collier County (Everglades City) was recognized as a Healthy Weight CommunityChampion. According to the County Health Rankings, Collier County is ranked number one inFlorida for Length of Life. In addition, Naples/Collier County has been listed as Smithsonian'sHappiest Place to Live for three years, from 2015 - 2019. County's cost of living is slightlyhigher than the state average. Collier County has a primary care health shortage for theImmokalee/Everglades service area and for the low income population in Golden Gate andEast Naples. There is also a dental health care shortage for their Low Income/MigrantFarmworker Population (Immokalee/Everglades). There is a mental health shortage for thelow income population. The climate is warm year-round, with a high of 77 in January (low of53) and a high of 93 in July (low of 75).Health Planning Council of Southwest FloridaThe Health Planning Council of Southwest Florida, Inc. is one of eleven local health planningcouncils in the state of Florida, serving the counties in Area 8: Charlotte, Collier, DeSoto,Glades, Hendry, Lee, and Sarasota. HPCSWF works to increase the availability andaccessibility of data regarding health needs and services within the region. Of particularinterest to the HPCSWF is to improve access to health care for persons with limited financialresources and to reduce disparities in health status. We offer data subscriptions for hospitaland nursing home utilization reports, planning and implementation support for agencies,counties, and health departments across southwest Florida, and are available to conductcommunity assessments as requested.Health Planning Council of Southwest Florida, Inc.serving Charlotte, Collier, DeSoto, Glades, Hendry, Lee & Sarasota Counties8961 Daniels Center Drive, Ste. 401, Fort Myers, FL 33912239.433.6700 www.HPCSWF.com2020 Collier County, Florida Health Profile
2020 DeSoto County, Florida Health ProfileData for year ending 2018, unless otherwise notedDemographicsCountyArea 343.5%902,43451.0%10,713,41251.1%Ages 0-186,89519.2%293,57516.6%4,193,96920.0%Ages 18-6421,22259.0%921,60252.1%12,566,40560.0%Ages 65 .7%% of Total Population* Area 8 includes Charlotte, Collier, DeSoto, Hendry, Glades, Lee, & Sarasota counties80.0%60.0%County40.0%Area 820.0%Florida0.0%Ages 0-18Ages 18-64SocioeconomicsCountyFloridaPer Capita IncomeMedian Household Income 23,610 50,070 35,057 53,267Persons 100% of FPL26.1%13.7%Children under 18 years 100% of FPL34.5%20.0%High School Graduate or Higher*72.7%88.0%Bachelor's Degree or Higher*11.4%29.2%Labor Force as % of Population Age 18 49.5%61.6%Unemployment Rate3.8%3.6%Severe Housing Cost Burden**13.0%17.0%% of Civilian NoninstitutionalizedPopulation with a Disability***14.1%13.4%Ages 65 60,000 50,000 40,000 30,000 20,000 10,000 0CountyFloridaPer CapitaIncomeMedianHouseholdIncomeALICE DataFPL: Federal Poverty Level * age 25 and over **2020*** 5 year estimatesWorkforceTop Industries* (% of all workers)CountyFloridaTrade, Transportation & Utilities20.6%20.0%Construction15.9%10.3%Natural Resources & Mining14.5%0.8%Professional & Business Services11.9%23.4%Leisure & Hospitality9.2%8.2%ALICE households are consisdered financially struggling2020 DeSoto County, Florida Health Profile
CrimeTrendFloridaCounty 2.24Total Domestic Violence Offenses770.1Inconsistent514.33Aggravated Assault350.8Inconsistent280.423-year rate per 100,000, 2016-2018CountyLarcenyBurglary45PositiveForcible Sex Offenses54.42Alcohol-suspected Motor Vehicle Traffic Crash Deaths*10.4Negative4.13Age-Adjusted Suicide Death *2015-2017 dataHealthcare Utilization & ResourcesLicensed Health Professionals*Rate per 100,000CountyFloridaTotal Hospital Beds136.3308.2Acute Care Beds136.3Specialty BedsRate per GYNs2.89.30.059.2Pediatricians5.622.0Nursing Home Beds328.3399.8Dentists11.256.7County Health Dept FTE*150.442.9 165.60 33.60County Health Dept Expenditures*Number of licensed providers may not equalthe number of practicing providers. †fiscal yearending 2019*fiscal year ending 2019, FTE: full-time employees**Dollars ( ) expended per person, fiscal year ending 2019Healthcare Access*With Health Insurance CoverageDeSoto CountyPercentage of CivilianNoninstitutionalizedPopulation81.6%No Health Insurance CoverageFlorida Percentage TrendPositive13.5%*5 year estimatesHealth Insurance Coverage*civilian noninstitutionalized population 19 to 64 years% of Total nsured20.0%10.0%0.0%EmployedUnemployedNot in labor forceSchool-Age ChildrenPopulation with a DisabilityPerceantagesCountyFloridaImmunization at Kindergarten94.7%93.8%Third Grade Language Arts Proficiency*34.0%58.0%High School Graduation Rate**71.3%86.9%Middle School Students Eligible for Free/Reduced Lunch**2019 data **2018-2019 School Year61.5%55.4%2020 DeSoto County, Florida Health Profile
CountyFloridaAge-AdjustedRate / 100,000TrendAge-AdjustedRate / 100,000CountyQuartileAll 6.24Heart Disease121.4Inconsistent147.71Chronic Lower Respiratory Disease56.8Inconsistent38.43Unintentional t20.44Alzheimer's s, Nephrotic Syndrome & 4.7Inconsistent8.04Mortality & Leading Causes of DeathAge-Adjusted Rate per 100,000, 2018County Health Rankings2020County4.8FloridaAdult Smoking21%16%Adult Obesity32%27%Physical Inactivity36%26%Access to Exercise Opportunities56%89%Food InsecurityDrug Overdose Deaths (rate per 100,000)16%1013%23.0Disconnected Youth13%7%Poor Mental Health Days4.0County Health Rankings by the Robert WoodJohnson Foundation ranks all counties in a statebased on health data. DeSoto County wasranked 38th out of the 67 counties in Floridafor Health Outcomes and 55th out of 67 forHealth Factors. The data to the left are some ofthe factors tracked by County Health Rankings.Most of the data included in the 2020 rankingsis from 2018.Maternal and Infant al Births (3 yr annual avg)383Teen (15-19) Birth Rate*42.3Inconsistent18.24Neonatal Death Rate (0-27 Days)*2.6Positive4.11Infant Death Rate (0-364 Days)*5.2Inconsistent6.12Low Birthweight 2500 Grams (% of Live Births)7.8%Positive8.7%1% of Live Births with Late or No Prenatal Care7.6%Inconsistent6.7%3% of Births with 1st Trimester Prenatal yQuartileInfectious Syphilis Cases1.9Inconsistent12.41Gonorrhea 85.51AIDS Cases5.6Positive9.82Tuberculosis Cases3.8Negative2.93*per 1,000 births; Note: Numbers are smallCommunicable Diseases3-year rate per 100,000, 2016-2018Please note that in counties with smaller populations, a small number of incidents can have a large impact on the rates for the county.2020 DeSoto County, Florida Health Profile
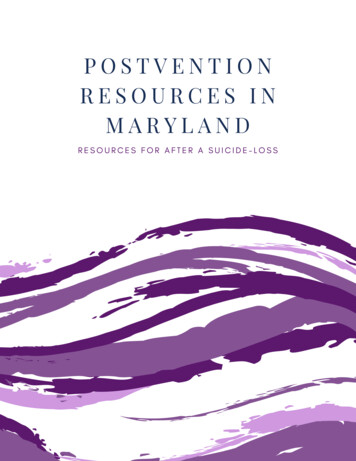
DeSoto County, FloridaDeSoto County includes Arcadia, which is its county seat. A rural county, DeSoto has apopulation density of 56.6 people per square mile, as compared to Florida's average of 399.7people per square mile. DeSoto County is ranked number one in Florida for PhysicalEnvironment according to the County Health Rankings. In 2017, DeSoto County wasrecognized as a Healthy Weight Community Champion. The cost of living in DeSoto County islower than the state average. DeSoto County has a primary care health shortage for thewhole county, a dental health care shortage for their Low Income/Migrant FarmworkerPopulation (DeSoto), and a mental health care shortage for the entire county. The climateremains warm throughout the year, with a high of 74 in January (low of 48) and a high of 92in July (low of 71).Health Planning Council of Southwest FloridaThe Health Planning Council of Southwest Florida, Inc. is one of eleven local health planning councilsin the state of Florida, serving the counties in Area 8: Charlotte, Collier, DeSoto, Glades, Hendry, Lee,and Sarasota. HPCSWF works to increase the availability and accessibility of data regarding healthneeds and services within the region. Of particular interest to the HPCSWF is to improve access tohealth care for persons with limited financial resources and to reduce disparities in health status. Weoffer data subscriptions for hospital and nursing home utilization reports, planning andimplementation support for agencies, counties, and health departments across Southwest Florida,and are available to conduct community assessments as requested.Health Planning Council of Southwest Florida, Inc.serving Charlotte, Collier, DeSoto, Glades, Hendry, Lee & Sarasota Counties8961 Daniels Center Drive, Ste. 401, Fort Myers, FL 33912239.433.6700 www.HPCSWF.com2020 DeSoto County, Florida Health Profile
2020 Glades County, Florida Health ProfileData for year ending 2018, unless otherwise notedDemographicsCountyArea 4.3%902,43451.0%10,713,41251.1%Ages 0-182,05215.6%293,57516.6%4,193,96920.0%Ages 18-647,57057.4%921,60252.1%12,566,40560.0%Ages 65 % of Total Population* Area 8 includes Charlotte, Collier, DeSoto, Hendry, Glades, Lee, & Sarasota counties80.0%60.0%County40.0%Area 820.0%Florida0.0%Ages 0-18Ages 18-64SocioeconomicsCountyFloridaPer Capita IncomeMedian Household Income 24,467 50,070 39,879 53,267Persons 100% of FPL20.1%13.7%Children under 18 years 100% of FPL27.6%20.0%High School Graduate or Higher*75.6%88.0%Bachelor's Degree or Higher*9.9%29.2%Labor Force as % of Population Age 18 48.1%61.6%Unemployment Rate4.0%3.6%Severe Housing Cost Burden**13.0%18.0%% of Civilian NoninstitutionalizedPopulation with a Disability***19.4%13.4%Ages 65 60,000 50,000 40,000 30,000 20,000 10,000 0CountyFloridaPer CapitaIncomeMedianHouseholdIncomeALICE DataFPL: Federal Poverty Level *age 25 and over **2020*** 5 year estimatesWorkforceTop Industries* (% of all workers)CountyFloridaTrade, Transportation, & Utilities18.5%20.0%Natural Resources & fessional & Business Services11.8%0.9%10.1%23.4%ALICE households are consisdered financially struggling2020 Glades County, Florida Health Profile
Crime3-year rate per 100,000, 2016-2018Florida County 1Burglary280.6Inconsistent422.21Total Domestic Violence Offenses553.6Positive514.32Aggravated Assault197.2Positive280.41Forcible Sex Offenses25.3Inconsistent54.41Alcohol-suspected Motor Vehicle Crash Deaths*12.7Positive4.13Age-Adjusted Suicide Death 2017 dataHealthcare Utilization & ResourcesRate per 100,000Total Hospital BedsLicensed Health Professionals*Rate per 100,000†County0.0Florida308.2Acute Care Beds0.0248.9OB/GYNs7.69.3Specialty Beds0.059.2Pediatricians0.022.0Nursing Home Beds0.0407.6Dentists0.056.7County Health Dept FTE*58.242.9 85.20 33.60County Health Dept ExpendituresPhysiciansCounty Florida7.6310.0*Number of licensed providers may not equalthe number of practicing providers. †fiscalyear ending 2019*fiscal year ending 2019, FTE: full-time employees**Dollars ( ) expended per person, fiscal year ending 2019Healthcare Access*With Health Insurance CoverageGlades CountyPercentage of CivilianNoninstitutionalizedPopulation80.1%No Health Insurance CoverageFlorida Percentage TrendPositive13.5%*5 year estimatesHealth Insurance Coverage*civilian noninstitutionalized population 19 to 64 years% of Total nsured20.0%10.0%0.0%EmployedUnemployedNot in labor forceSchool-Aged ChildrenPopulation with a DisabilityPercentagesCountyFloridaImmunization at Kindergarten94.8%93.8%Third Grade Language Arts Proficiency*62.0%58.0%High School Graduation Rate**91.4%86.9%Middle School Students Eligible for Free/Reduced Lunch**2019 data **2018-2019 School Year41.2%55.4%2020 Glades County, Florida Health Profile
CountyFloridaAge-AdjustedRate / 100,000TrendAge-AdjustedRate / 100,000CountyQuartileAll nt146.22Heart Disease128.9Inconsistent147.71Unitentional Injury116.8Negative53.84Chronic Lower Respiratory troke18.2Positive41.01Influenza and Pneumonia13.715.0Inconsistent9.88.734Mortality & Leading Causes of DeathAge-Adjusted Rate per 100,000, 2018HypertensionInconsistentCounty Health Rankings2020County4.3FloridaAdult Smoking20%16%Adult Obesity36%27%Physical Inactivity34%26%Access to Exercise Opportunities10%89%Food Insecurity14%13%Poor Mental Health DaysDrug Overdose Deaths (rate per 100,000)Disconnected Youth4.023.07%County Health Rankings by the Robert WoodJohnson Foundation ranks all counties in a statebased on health data. Glades County wasranked 41st out of the 67 counties in Floridafor Health Outcomes and 54th out of 67 forHealth Factors. The data to the left are some ofthe factors tracked by County Health Rankings.Most of the data included in the 2020 rankingsis from 2018.Maternal and Infant Health2016-2018CountyTotal Births (3 yr annual avg)TrendFloridaCountyQuartile64Teen (15-19) Birth Rate*11.2Positive18.21Neonatal Death Rate (0-27 Days)*5.2Inconsistent4.14Infant Death Rate (0-364 Days)*15.6Inconsistent6.14Low Birthweight 2500 Grams (% of Live Births)10.9%Negative8.7%4% of Live Births with Late or No Prenatal Care2.6%Positive6.7%1% of Births with 1st Trimester Prenatal 12.4Gonorrhea 85.52AIDS Cases2.5Inconsistent9.81Tuberculosis Cases0.0Steady2.91*per 1,000 births; Note: Numbers are smallCommunicable Diseases3-year rate per 100,000, 2016-2018Infectious Syphilis CasesCountyQuartile1Please note that in counties with smaller populations, a small number of incidents can have a large impact on the rates for the county.2020 Glades County, Florida Health Profile
Glades County, FloridaGlades County includes Moore Haven, which is its county seat. A rural county, Glades has apopulation density of 16.3 people per square mile, as compared to the Florida average of 399.7people per square mile. It has the lowest population density in Area 8. Approximately eighteenpercent of its area consists of water, including Lake Okeechobee, the largest fresh water lake inFlorida. The climate is warm year-round, with a high of 73 in January (low of 50), and a high of94 in July (low of 73). In 2018, Glades County was recognized as a Healthy Weight CommunityChampion. The cost of living in Glades County is the lowest of Area 8. Major private-sectoremployers include Moore Haven Correctional Facility, Lykes Bros., and Brighton SeminoleBingo. Glades County has a primary medical care shortage for the entire county, a dentalhealth care shortage for the whole county and a mental health care shortage for theGlades/Hendry Catchment service area.Health Planning Council of Southwest FloridaThe Health Planning Council of Southwest Florida, Inc. is one of eleven local health planning councils inthe state of Florida, serving the counties in Area 8: Charlotte, Collier, DeSoto, Glades, Hendry, Lee, andSarasota. HPCSWF works to increase the availability and accessibility of data regarding health needsand services within the region. Of particular interest to the HPCSWF is to improve access to healthcare for persons with limited financial resources and to reduce disparities in health status. We offerdata subscriptions for hospital and nursing home utilization reports, planning and implementationsupport for agencies, counties, and health departments across southwest Florida, and are available toconduct community assessments as requested.Health Planning Council of Southwest Florida, Inc.serving Charlotte, Collier, DeSoto, Glades, Hendry, Lee & Sarasota Counties8961 Daniels Center Drive, Ste. 401, Fort Myers, FL 33912239.433.6700 www.HPCSWF.com2020 Glades County, Florida Health Profile
2020 Hendry County, Florida Health ProfileData for year ending 2018, unless otherwise notedDemographicsC
According to the 2010 Census, Charlotte County had the second highest median age of any Gorda, Florida, and also includes the unincorporated towns of Port Charlotte and Englewood. Port Charlotte was named to Forbes' list of 25 Best Places to Retire in both 2015 and 2017. Charlotte County's cost of living is 6% lower than the national average.