Transcription
Gesellschaft für Informatik e.V. (GI) (Hrsg.): INFORMATIK 2021,Lecture Notes in Informatics (LNI), Gesellschaft für Informatik, Bonn 2021 1tRackIT OS: Open-source Software for Reliable VHFWildlife TrackingJonas Höchst1 , Jannis Gottwald2 , Patrick Lampe1 , Julian Zobel3 , ThomasNauss2 , Ralf Steinmetz3 , Bernd Freisleben1 Abstract: We present tRackIT OS, open-source software for reliable VHF radio tracking of (small)animals in their wildlife habitat. tRackIT OS is an operating system distribution for tRackIT stations that receive signals emitted by VHF tags mounted on animals and are built from low-costcommodity-off-the-shelf hardware. tRackIT OS provides software components for VHF signal processing, system monitoring, configuration management, and user access. In particular, it records,stores, analyzes, and transmits detected VHF signals and their descriptive features, e.g., to calculate bearings of signals emitted by VHF radio tags mounted on animals or to perform animalactivity classification. Furthermore, we provide results of an experimental evaluation carried outin the Marburg Open Forest, the research and teaching forest of the University of Marburg, Germany. All components of tRackIT OS are available under a GNU GPL 3.0 open source license athttps://github.com/nature40/tRackIT-OS.Keywords: Radio Tracking; Marburg Open Forest; Open Source; Movement Ecology1IntroductionIn an increasingly densely populated and anthropogenically dominated environment, a scientific analysis of the consequences of human-wildlife interaction is essential for developing evidence-based guidelines for conservation [KA20]. Understanding the impact ofaltered habitats on the spatial distribution of species [Sa09], the effects of human infrastructures such as roads [Ho15, As19], and reasons for increased mortality of endangeredspecies [Le19] is crucial for preserving biodiversity in a crowded world. Movement dataof animals generated by recent technological advances support more detailed forms ofanalysis and insights into the behavior and ecology of threatened species than ever before [Wy18, Ca10, Wa18].Wildlife observations can be realized with a variety of technologies. For example, GPStechnology can be used to equip animals and record their movements independently of1Department of Mathematics & Computer Science, University of Marburg, arburg.de2 Department of Geography, University of Marburg, Germany,{gottwal5,nauss}@staff.uni-marburg.de3 Multimedia Communication Lab (KOM), Technical University of Darmstadt, adt.decbe
2 Höchst and Gottwald et al.other communication infrastructures. However, size, weight, and battery life constraintsprevent the use of GPS for most European songbirds and bats.Manual radio telemetry is another option for observing small animals. However, it is extremely labor-intensive, limited to a small number of individuals that can be tracked simultaneously [Co99], and results in spatial and temporal data with poor resolution, whichmight not be sufficient for meaningful scientific analyses [Mo10].Automated radio telemetry systems can minimize many of these disadvantages [Ka11,We16]. In previous work, some of us presented a system based on commodity-off-the-shelf(COTS) hardware for automatic radio tracking of small animals based on Very High Frequency (VHF) tags [Go19] as part of the open source project radio-tracking.eu4 . However,three seasons of long-term stationary operating time of the system in the Marburg OpenForest (i.e., the teaching and research forest of the University of Marburg, Germany) revealed several deficits, such as the lack of failure handling, inadequate interfaces for datatransmission and health-state monitoring, and problems with time synchronization of received signals between receivers of the same station and among different stations.In this paper, we present tRackIT OS, an open-source operating system distribution forreliable VHF radio tracking of small animals. tRackIT OS runs on a tRackIT station; itsbasic hardware design is due to Gottwald et al. [Go19]. We developed tRackIT OS to providenew software functionality according to our experiences in studying the movement ecologyof both diurnal and nocturnal wildlife with a network of 15 tRackIT stations in denselyforested terrain. In particular, we present: a novel approach for automated signal detection of VHF radio tracking tags, means to provide reliable operation of tRackIT stations under harsh conditions, efficient live data transmission for monitoring data and detected signals, a novel web-based user interface for intuitive configuration of tRackIT stations, a comparative evaluation of tRackIT OS compared to the state-of-the-art.The rest of the paper is organized as follows. Section 2 discusses related work. Section 3discusses requirements, design decisions and implementation details, followed by experimental results in Section 4. Section 5 concludes the paper and outlines areas of futurework.2Related WorkRipperger et al. present a comprehensive overview of existing systems for localizing smallanimals using different technologies [Ri20]. The most recent projects on automated VHF4https://radio-tracking.eu
tRackIT OS 3transmitter tracking are ARTS [Ka11], Atlas [We16], and Motus (also called SensorGnome)[Ta17].ARTS consisted of towers with a height of 40 meters and top-mounted antenna arrays[Ka11], but the system was taken down in 2010 and replaced by camera traps and GPStransmitters. ARTS was able to determine the position of a tagged individual by triangulation with an spatial accuracy of 50 meters, but rotating through channels with differentfrequencies reduces the time span in which each individual can be observed. tRackIT supports more detailed observations of movements using a higher number of stations at lowercost and less effort in construction.The Atlas project achieves great spatial accuracy by using the time difference of arrival(TOA) method for direction estimates as seen from the receiver, while costs for the developed tags are low [We16]. However, implementation of the receiving stations is quiteexpensive, a fact that probably explains why the system is only deployed in three areas inthe Netherlands, England, and Northern Israel. tRackIT achieves comparable results withstations built from commodity off the shelf hardware at a lower price point.Motus5 is a globally operating network of VHF receiver stations hosted by different collaborators and supporting researchers [Ta17]. Despite its open source character, an implementation of Motus at US 3000 for a single SensorGnome6 receiver with three 9-element Yagiantennas, and US 7500 for a Lotek SRX800 receiver station with four 9-element Yagi antennas is costly [LN18], leading to a trade-off between spatial resolution and coverage. Bydefault, the implemented radio receiver listens at a single center frequency and can detectpulses from tags in a narrow band of 24 kHz around its center frequency. This limits thenumber of distinguishable frequencies, i.e., the number of detectable individuals, substantially. Motus has delivered great insights into the ecology of different species in more than120 research projects [Ta17], but investigating fine-grained spatial movements by triangulation is not supported by the system. The wide frequency band that can be used by tRackITsupports both fine-grained temporal resolutions and observations of many individuals.3tRackIT OSA tRackIT system consists of (a) VHF radio tags mounted on animals, (b) tRackIT stationsfor receiving signals emitted by VHF tags, (c) tRackIT OS running on tRackIT stationsfor detecting and matching signals received on multiple antennas, (d) tRackIT servers forcollecting and presenting data transmitted from tRackIT stations, and (e) tRackIT analyticsmodules for deriving ecological knowledge from the collected data.In this section, we present design and implementation issues of tRackIT OS, the operatingsystem distribution for tRackIT stations.56Motus Wildlife Tracking System: https://motus.orgSensorGnome Project: https://sensorgnome.org
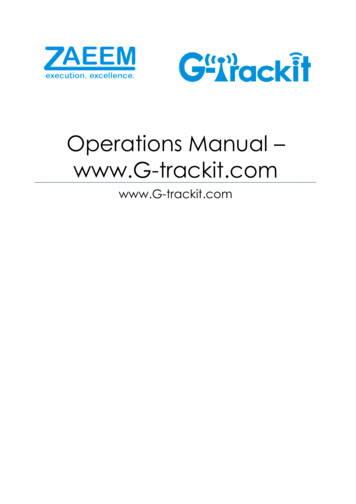
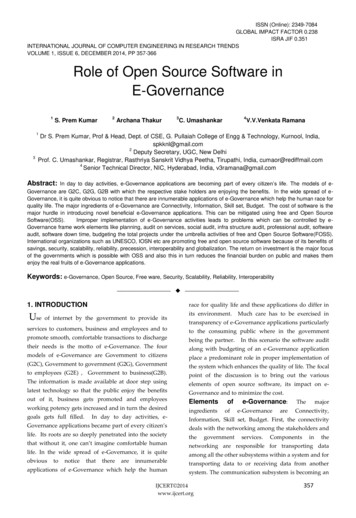
4 Höchst and Gottwald et al.3.1RequirementsOur experiences from three seasons of field work have indicated that automatic telemetrycan only be a useful substitute of its manual counterpart if certain requirements are met:1.Low entry barrier. To make automatic radio telemetry accessible to the widest possible user community, both hardware and software as well as data processing andanalysis must be conveniently accessible, easy to use, and inexpensive.2.Reliability. The used equipment must reliably record signals originating from VHFtransmitters and minimize the amount of interference. Any component failurescaused by adverse conditions, such as unstable power supplies, fluctuating temperatures, and hardware-based failures should be detected and handled automatically.3.Data availability. In many application areas, like mortality studies [He20], fast dataavailability is highly important. Thus, direct data transmission from the field withthe shortest possible delay between recording and transmission is desirable.3.2tRackIT StationTo deploy an operational installation in the field, a tRackIT station is equipped with directional antennas in the four cardinal directions, a solar panel, and a battery box. The basichardware design is due to Gottwald et al. [Go19]. We have slightly adapted the hardwareby including an active USB hub, a better LTE modem, and a LoRa (Long Range WirelessRadio Frequency Technology7 ) expansion board (LoRa HAT), as shown in Figure 1.The ’brain’ of a tRackIT station is a Raspberry Pi 3 Model B that consists of a quad-core1.2 GHz ARM-Cortex-A53 and 1 GB of RAM. It offers various input/output options, including Wi-Fi and 4 USB ports. The system is powered through a 5V USB port and iscapable of powering connected USB devices. The four directional antennas are connectedto four software-defined radios (SDR) (Nooelec NESDR SMArt v4) for signal analysis.Since these SDRs require more power than provided by the Raspberry Pi, an active 4-portUSB hub (Anker 4-port Ultra Slim USB 3.0 Data Hub, A7518) is used to connect the devices. An LTE modem (Huawei E3372H) and a local prepaid data plan is used to establisha mobile Internet connection. The battery box provides a 12 V source that is converted using a step down converter rated for 2 2.4 A at 5 V. For tRackIT stations relying on LoRafor data publishing, a Dragino SX127X GPS HAT8 is used. For receiving and forwardingtRackIT stations, the Dragino PG1301 LoRa Concentrator is used9 . The basic hardware ofa tRackIT station costs a total of about 200 , consisting of 35 for the Raspberry Pi 3B ,789Semtech: https://www.semtech.com/lora/Dragino SX127X: a-gps-hat.htmlDragino PG1301: a-gps-hat.html
tRackIT OS 5Battery BoxSolarChargertRackIT StationSolarPanel12V / 5VConverterRTL-SDRRTL-SDRRTL-SDRUSBHubRaspberry Pi 3bRTL-SDRLTE ModemLoRa HATFig. 1: The hardware components of a tRackIT station.4 35 for the Nooelec SDRs, 15 for the active USB hub, and 10 for the power supplyunit. The optional communication modules cost 50 in the case of the Huawei LTE modem and/or 35 (LoRa HAT) / 110 (LoRa Concentrator) for the LoRa publish / receiveupgrade.3.3tRackIT OS ComponentsThe operating system (OS) plays a crucial role in the reliable autonomous operation of thepresented hardware. We developed a custom distribution of the Raspberry Pi OS, calledtRackIT OS. The primary task of tRackIT OS is to execute a signal detection module, calledpyradiotracking, in a reliable manner. The secondary task is to interface with users (a) interactively while setting up the station, and (b) continuously during autonomous operationfor extended monitoring. tRackIT OS is built using PIMOD [Hö20b], which allows configuration of single-board computer system images in a reproducible manner. The resourcesrequired to build tRackIT OS as well as the OS image itself are released under a GPL 3.0license10 .In Figure 2, the main software components of tRackIT OS are presented. Station-initiatedcommunication is handled using the Message Queuing Telemetry Transport (MQTT) protocol, with mosquitto as an MQTT client and server implementation [Li17] for messagedistribution. It is configured such that incoming messages are forwarded to remote MQTTbrokers for further processing. These brokers are also responsible for detecting and resolving connection failures.10tRackIT OS, available online https://github.com/Nature40/tRackIT-OS
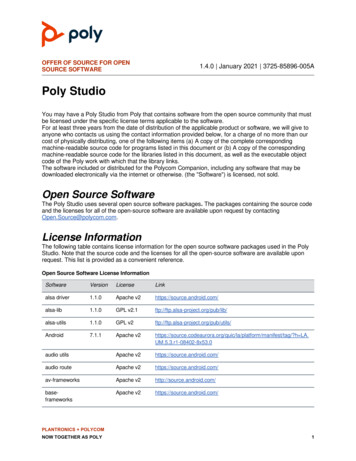
6 Höchst and Gottwald et al.tRackIT StationpymqttutilpyradiotrackingtRackIT OSsystemdsysdwebmosquittoWeb ServerOpenSSHpyr-loraWi-Fi / WireguardCellularServerUsersremotemosquittoRTL SDRNorthRTL SDREastRTL SDRSouthRTL SDRWestStorageLoRaLoRa Stationpyr-loramosquittoVisualizationData FlowInteractionFig. 2: Overview of the main software components of a tRackIT OS distribution.The core software component for signal detection is called pyradiotracking. The componentreads samples from all four SDRs, as well as detects, filters, and matches signals of VHFtags. Detected signals are saved to local storage, displayed via a custom web user interface,and published to a local message bus that is responsible for data distribution. Section 3.4discusses the implementation details of pyradiotracking.For system monitoring, we implemented a custom tool called pymqttutil in the Python programming language. It is released under a GPL 3.0 license11 . The tool executes configurable Python statements in a fixed schedule and publishes the corresponding results viaMQTT. It is configured such that relevant system metrics are published in a 5 minute interval, i.e., temperature, system uptime, system load, memory usage, CPU frequency, networkaddresses, storage utilization, and cellular data usage.All services are managed by systemd. The WebUI sysdweb12 for systemd is configured toallow easy log access and service control for (mobile) users. The Caddy web server is usedto provide convenient access to the local storage, pyradiotracking and sysdweb. Finally,OpenSSH provides direct system access for local and remote users. To allow secure remoteaccess, wireguard is used as a virtual private network (VPN).1112pymqttutil, available online: https://github.com/Nature40/pymqttutilsysdweb, available online: https://github.com/Nature40/sysdweb
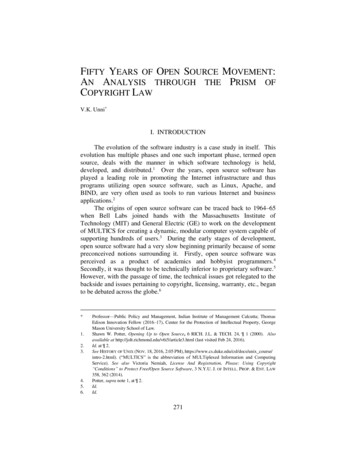
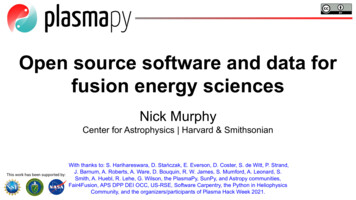
tRackIT OS 73.4Signal DetectionThe signal detection algorithm is implemented in the pyradiotracking Python package,which is released under a GPL 3.0 license13 . In Figure 3, the stages of signal processing arepresented in a block diagram. First, spectrograms of the incoming IQ samples are created,which are used to detect signals. The detected signals are then filtered for shadow signalsof lower power in neighboring frequencies and sent to a central signal queue. The detectedsignals of multiple antennas are matched and written to a local file, published to the MQTTmessage bus, and visualized in the local dashboard.Antenna Signalrtl-sdrIQ atchprocess samplesfilter alextract MQTTConsumer (matched) signalsSignalAnalyzerDashboardSignal VisualizationConfiguration PaneFig. 3: Signal analysis stages implemented in pyradiotracking.To illustrate how the different stages work, data of the length of one second is used as anexample. An SDR is configured such that a center frequency of 150.150 MHz, a samplerate of 300 kHz, and a fixed gain of 49.6 dB are used. A test tag with the frequency of150.172 MHz and a signal duration of 40 ms was placed near to the receiving antenna. InFigures 4, 5, and 6, three stages of signal processing are visualized.Figure 4 shows the raw IQ samples received by the SDR. Following the example configuration described above, there are 300,000 samples, hence 600 kilobyte of data collected inone second. In the time interval of 𝑡 0 0.45 𝑠 to 𝑡1 0.49 𝑠, the IQ samples contain highvalues, which appear as a rectangle in the visualization. This rather sharp rectangle indicates that the gain value is set too high and the signal is clipping. When setting up stationsfor regular operation, the gain value must be chosen such that a good compromise of gainand clipping is achieved.13pyradiotracking, available online: https://github.com/Nature40/pyradiotracking
Quadrature Component8 Höchst and Gottwald et al.1.00.50.00.51.0ntnepo0.00.5Com0.21.00.4Time 0.6 0.8(s)Phase0.00.5In-1.0 1.0Fig. 4: IQ samples of one second, as received by RTL-SDR.Frequency e (s)0.60.8Fig. 5: Power spectral density (PSD) of samples computed via Short-time FourierTransform (STFT).To detect single signals from the received data, a spectrogram is computed and processedfurther. This is achieved by applying consecutive Short-time Fourier Transforms (STFT)[Al77] to the data. Figure 5 shows the spectrogram computed from the previously presentedexample data. The STFTs are computed with 256 samples per Fast Fourier Transform (FFT)and no overlapping samples. The Hamming window function is applied to smoothen discontinuities at the start and the end of the processed FFT. In this configuration, the bandwidthof 300 kHz is divided into 256 bands and a frequency resolution of 1,171 kHz, to achievea time resolution of 1.0 𝑠/1, 171 0.853 𝑚𝑠.In Figure 6, signal detection on individual frequencies is visualized. The signal power(dBW) in the logarithmic scale is plotted for four example frequencies near the test sender’sfrequency, and the signal emitted by the test sender can be observed in three of those. The
tRackIT OS 90150.169 MHz150.170 MHz150.171 MHz150.172 MHzSignal Power (dBW)204060801000.430.440.450.460.47 0.48Time (s)0.490.500.51Fig. 6: Power spectral densities (PSDs) of selected frequencies, minimal signal powerthreshold, and signal power sampling points.gray dashed horizontal line indicates the configured signal power threshold of -60 dBW.The gray dotted vertical lines show scan points used for initial signal detection. The bluearrow marks the total detected signal length. Signal detection is achieved by (a) iteratingthrough all frequencies and (b) iterating through time using scan points placed accordingto the minimal detectable signal duration of 8 ms in our example. The signal-to-noise ratio(SNR) is calculated using the ratio of the current power and the average signal power of thisfrequency. If signal power and SNR at the scan points are above the configured thresholds,a potential signal is detected. The scan is then continued by evaluating the thresholds forall neighboring values until the thresholds are undershot, indicated by the blue arrows. Ifthe duration of the detected signal is within the set limits, further complementary featuresare computed and added to a list for further processing.After all signals of a spectrogram are extracted, shadow filtering is performed. We definea shadow signal as a signal that matches another signal in duration and time, but has alower detected power. In the example of Figure 6, the signals detected at 150.170 MHz and150.172 MHz would be shadow signals of the 150.171 MHz signal. The shadow signalsare removed and the detected primary signals are added and written to disk, published viaMQTT and sent to pyradiotracking’s main process for signal matching and data presentation.To improve reliability, a direct control component is introduced. The librtlsdr libraryused to retrieve data from an SDR works in such a way that as soon as requested datais available, a callback method is called. If the system load is too high and the callbackmethod takes longer than the acquisition of the next samples, individual samples are omit-
10 Höchst and Gottwald et al.ted. Hardware and library-specific errors may lead to no callbacks at all. The first problem ismonitored by comparing the actual received samples with the expected number of samplesusing the system clock. In this way, dropped samples can be detected, even accumulatedover longer periods of time. The second problem is solved by (re-)setting a periodic alarm,comparable to a dead man’s switch. If the callback method is not called in time, an alarm istriggered. This terminates the analysis process, which is then restarted by pyradiotracking’smain process.3.5Signal MatchingThe detected and filtered signals of multiple antennas are consumed by the signal matcher,which works as follows. In a list, all currently active signal groups are held. When a newsignal is detected, it is compared to each of the active signal groups in time, duration, andfrequency. The SDR devices used in the project do not work synchronously and use individual quartz crystals as their clock sources, hence time and frequency mismatches are likelyto happen. If all parameters of an active signal group are within the configured thresholds,the signal is added to the corresponding group. If no corresponding group is found, a newactive signal group with this signal is created and added to the list. After a certain timeout,the active signal groups are removed from the list and the key features are written to diskand published.3.6Data PublishingDetected signals are published directly to disk in CSV format and via MQTT in the CBORformat, which is a binary format and introduces smaller overheads compared to text-basedformats. The MQTT broker running on a tRackIT station can be configured to forwardpublished signals to other brokers, such as a central server via a cellular network or otherIP-based networks.FieldTimeFrequencyDurationSignal AvailabilitySignalsAccuracyms of current minoffset to 150 MHz in kHzmsflags3-decimalsSize (bit)16964[1 4] 1752 103Tab. 1: tRackIT station’s LoRa matched signal payload: fields, accuracy, and sizes.In addition to this IP-based data publishing, LoRa can be used to publish signals. LoRais a physical layer protocol based on chirp spread spectrum (CSS) modulation, that is robust against channel noise, multi-path fading, and the Doppler effect. This allows transmission ranges of a few kilometers in urban environments and up to 15 kilometers in rural
tRackIT OS 11areas, with minimal power requirements but also only low data rates between 300 bps and50 kbps [Md17, Pe17, Hö20a].The LoRa publishing service of tRackIT OS receives signals through the local MQTT broker, converts the data in a custom data-saving binary format, and sends it via LoRa. Table 1shows the fields used for a matched signal’s payload, including accuracy and required sizein bits. A matched signal contains a minimum of one and a maximum of four signals, depending on the number of antennas that received the signal, hence the final payload sizeis 52 up to 103 bits. Zeros are appended to the payload to reach the required byte boundaries, resulting in messages of 7, 9, 11, and 13 bytes, depending on the number of thecontained matched signals. Compared to the already compact representation in CBOR ofa 4-component matched signal (56 bytes overhead), a reduction of up to 77% is achieved(13 bytes). In the most robust LoRa settings (SF:12, BW:250 kHz, CR:4/8), such a shortened message would require 594 ms Time-on-Air (ToA) (using Implicit Header mode witha 1-byte sender ID, the total length of the packet is 14 bytes). Following the duty cycleregulation of a maximum utilization of 1% (10%) per band, a message could be sent every59 (5.9) seconds. While these settings do not allow continuous monitoring of individuals,sparse reporting of single observations are still of value, when trying to detect tags fallen offor with empty batteries. For stations in closer physical proximity to the receiving gateway,less robust settings may be chosen. Using a less robust LoRa setting (SF:8, BW:250 kHz,CR:4/8), the ToA drops down to 45.5 ms, allowing messages to be sent in an interval of 4.6(0.46) seconds. From previous measurements in the Marburg Open Forest, signals couldbe reliably transmitted over 600 meters using this setting.4Experimental EvaluationIn this section, we evaluate tRackIT OS in benchmarking scenarios and in field experiments.The data of all experiments is publicly available at l.4.1Experimental ScenarioTo evaluate tRackIT OS in a realistic manner, we use a system setup in the Marburg OpenForest, consisting of 15 tRackIT stations; 5 of them are used in our evaluation describedbelow. The experiments are carried out twice: (a) with the most recent tRackIT OS 0.7.0and (b) using the most recent stable operating system version of the radio-tracking.eu14project [Go19], called paur 4.2. We activated a test tag and carried it around in the area ofthe selected tRackIT stations together with a GPS receiver to receive ground truth data. Theexperiment took place over the course of 0:51:10 h with a VHF sender of 600µW power, 2014https://radio-tracking.eu
12 Höchst and Gottwald et al.ms duration and an interval of one signal per second, which results in 3,193 sent signals. InFigure 7, the GPS trace of the conducted experiment is presented; stations are marked bythe white circles, and the trace is colored to indicate the time component of the experiment.51:10 min Mapbox OpenStreetMap00:00 minFig. 7: GPS trace of the experimental evaluation track and the correspondingtRackIT stations.Our observations using paur in two seasons of 2019 and 2020 indicated high numbersof falsely detected signals. We were not able to distinguish between true and false positives through the information available after signal detection. Thus, we used a power signalthreshold. The paur experiments conducted in this paper showed the same low precision,hence all detected signals with a power lower than -78 dBW were removed for further processing. Using tRackIT OS, this threshold is not required, since we observed very low numbers of falsely detected signals.4.2Signal DelayA second observation from our previous field seasons in 2019 and 2020 is a delay in signaldetection using paur in the order of seconds to minutes. In Figure 8, an example of observedsignal delay is visualized. The dots show the received signal strength measured on multipleantennas of the same tRackIT station. Every antenna received a series of signals with lowvariance in signal strength that appear to be a straight line, indicating that the tag is notmoving. However, these straight lines on the individual receivers are offset in time fromeach other, which makes further processing of the data difficult and and leads to worseto unusable bearing calculation. In the experiments of this paper, we measured a delay insignal detection of 8 seconds in paur and no recognizable delay in tRackIT OS.
tRackIT OS 13Antenna85WestSouthNorth80Signal Power (dBW 100)East75706560555002:24:4502:25:00Jul 24, g. 8: Example of signal delay among different receivers observed in the 2020 fieldseason using paur.4.3Signal r of Detected SignalsIn the tRackIT OS experiments, the selected five tRackIT stations detected 30,507 signals,each on potentially four antennas, resulting in an average of 1,525 signals (47.8%) detectedper antenna. Signal detection depends on various factors, such as geographical and topographical conditions, the orientation of the antenna, the height of the transmitter above theground, air humidity, and forest cover. Figure 9 shows the numbers of detected signals bystation and antenna. Due to the positioning of the stations, the orientation of the antennas,and the selected test area, some of the antennas receive only a very small amount, others alarge amount of the test signals. On the north antenna of station 11, only 95 (3.0%) signalscould be detected, while 2,611 (81.8%) signals where detected on south antenna of ionFig. 9: Detected signals on tRackIT stations in the experimental scenario.
14 Höchst and Gottwald et al.In addition to this quantitative analysis of signal detection, we evaluated the distances between the test tag and the tRackIT stations. Figure 10 shows the distance of the tag andstations measured via GPS and the power of the detected signal. While most stations candetect signals at distances of up to 400 meters, stations 4 and 11 detect signals up to 800meters away. While the correlation of signal strength and measured distance is straightforward, a high variance can be observed from the data and signal strength alone, hence thisis not a suitable estimator for distance in the presented experiment. Initially, the overallperformance of the two systems appears comparable, especially for signals with high signal strength. While paur received 2,728 signals usable for bearing calculations, tRackITOS received 4,438 such signals, an increase of 62.7%, when applying the same -78 dBWthreshold. In addition, tRackIT OS received 1,108 signals of lower signal strength, whichcorresponds to an effective increase of 103.3% compared to paur.70 30mof-rts-00011mof-rts-00004mof-rts-00009Signal Power (dBW) 50mof-rts-00011 60 70 80mof-rts-00015Signal Power (dBW 100)mof-rts-00003mof-rts-0000960mof-rts-00015 40mof-rts-000035040302010 90 1000StationStation200400600800Distance (m)(a) tRackIT OS00200400600800Distance (m)(b) paurFig. 10: Signal power and distance to a receiving station.4.4Bearing CalculationTo reach the goal of signal triangulation, signals detected on multiple antennas of a stationare used to calculate bearings. We use the method proposed by Gottwald et al. [Go19]to produce comparable res
Jonas Höchst1 , Jannis Gottwald2 , Patrick Lampe1 , Julian Zobel3 , Thomas Nauss2 , Ralf Steinmetz3 , Bernd Freisleben1 Abstract: We present tRackIT OS, open-source software for reliable VHF radio tracking of (small) animals in their wildlife habitat. tRackIT OS is an operating system distribution for tRackIT sta-