Transcription
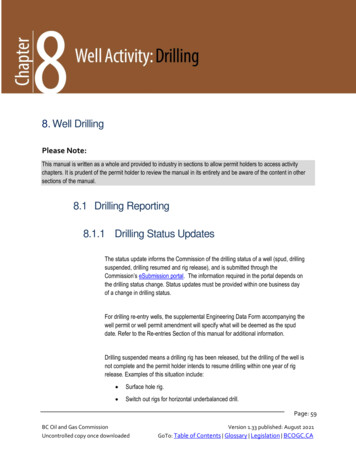
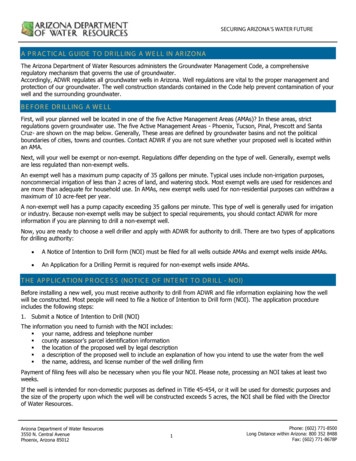
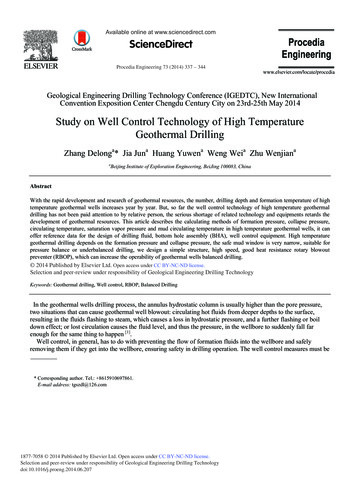
PROCEEDINGS, 43rd Workshop on Geothermal Reservoir EngineeringStanford University, Stanford, California, February 12-14, 2018SGP-TR-213Drilling and Well Completion Cost Analysis of Geothermal Wells in TurkeySercan Gul1, Volkan Aslanoglu11Middle East Technical University, Petroleum&Natural Gas Engineering Department, Ankara, Turkeysercan.gul@gmail.com, aslanoglu.volkan@metu.edu.trKeywords: geothermal energy, drilling, well completion, cost estimationABSTRACTMore than one thousand wells have been drilled in Turkey for geothermal energy development which ranked the country up to fourth intotal geothermal energy production worldwide. Despite of the high number of the wells, there are very limited resources on the costs ofthese wells and whether it is more affordable to invest in geothermal energy in Turkey in comparison with other geothermal producingcountries. The objective of this paper is to provide a numerical method and code to calculate the drilling, completion and testing costs ofnew wells which can be used as an estimation by operators who are interested in investing in this market and as a result provide acomparison of these costs with the well costs in other thermally active countries. Well drilling and completion data from more thantwenty wells have been analyzed and merged together to form a software to calculate the estimated costs of drilling, completion andtesting a well with a diesel rig in Turkey. This software uses the rig capacity, rig type, the drilling type (kelly or top drive), casingsetting depths for each casing, existing drilling third party services (mud, directional drilling, performance drilling etc.) and estimatedrate of penetration values from offset wells as the input. The code runs with already calculated casing running times, tripping speeds andconnection times for each different size of casing and drill pipe together with the time estimation formulas and provides the servicecosts and time graphs with the option of changing each input easily. As a result of the study, it was observed that the associated costs inTurkey are the cheapest amongst the costs of wells in Australia, France, Germany, Iceland, Kenya, Netherlands and the United States.The major reasons of these low costs are mainly because of the following three main parameters. Firstly, daily operating costs of rigsand third-party services and labor costs in Turkey are more affordable compared to other countries. Secondly, the major equipment ofthe well which are the casings are chosen from the lowest cost option since wells are not overbalanced and there is no need for a highcost or high-grade casing to drill these wells. Thirdly, the drilling experience in Turkey resulted in a competitive market which resultedin more optimized wells with minimum drilling times. In literature, there is no published study for the estimation of drilling, wellcompletion and well testing costs of geothermal wells in Turkey. This study and the associated code are very important for a geothermaloperator to estimate the project times and related costs associated with their investment.1. INTRODUCTIONIncreasing demand for energy with lower CO2 emissions in today’s world has resulted in the necessity of alternative energy sources. Inthe last decade, there is more and more interest in renewable energy sources due to their low CO2 emissions and sustainability. One ofthe most influenced energy source in Turkey today is geothermal energy. Turkey is ranked number 4 in the total capacity of geothermalenergy in the world with its 1,053-MW installed capacity (Gul, 2017). Figure 2 illustrates the top 10 countries in installed capacityworldwide while Figure 3 illustrates the increase in the installed geothermal capacity of Turkey in last decade and under-development &planned capacity for the following years. With the completion of the planned capacity addition, Turkey is estimated to be the thirdlargest geothermal operating country in the world with 1827 MW total capacity. Rig counts in Turkey for geothermal well drilling as ofJanuary 2017 was 26, being ranked first with the total amount of 60 geothermal rigs worldwide. In total 32 of 98 drilling activities inEurope is in Turkey (Hughes, 2017).Turkey is situated on the Alps-Himalayas belt and, although, the geothermal energy potential of Turkey was historically estimated as31500 MW, that value has recently been increased to 60000 MW (Mertoglu, Sismek, & Basarir, 2015). According to GeothermalCountry Update Report of Turkey, there are five major grabens which are Buyuk Menderes, Gediz, Dikili-Bergama, Kucuk Menderesand Edremit grabens along the Northern Anatolian Fault zone and in the Central and Eastern Anatolia volcanic regions (Mertoglu,Sismek, & Basarir, 2015). The geothermal gradient in Turkey ranges between 8.33 C/100m to 11.10 C/100m in thermally activeregions (Njolnbi, 2015).On the other hand, the drilling costs are mostly affected by the daily rig rates from drilling contractors and with the developedexperience in the field by contractors and service companies, the daily drilling rig rates have been decreased dramatically in the last 3years (Kaya, 2017). As illustrated in Figure 1, in the mentioned period Turkey has an average of 45% of the geothermal drilling rigsthroughout the world. Moreover, this ratio is approximately 30% compare with all the drilling rigs in Europe. Therefore, it can beconcluded that Turkey is currently a market leader in geothermal drilling activities in Europe and that is the main aspect of the reductionin daily drilling costs.1
Gul & AslanogluNumber of WellsMonthly Well Count5050%4040%3030%2020%1010%00%DateTurkey(Total Drilling)Worldwide Geothermal Perc.Turkey (Geothermal Wells)Turkey's Percentage (Europe)Figure 1. Monthly well count (June 2012-October 2017) (Hughes, 2017)Top 10 Geothermal CountriesInstalled Capacity - Total 13968 MW -November 20170500United StatesPhilippinesIndonesiaTurkeyNew 42893Figure 2.Geothermal power operation capacity by country (Gul, 2017)Total Installed Capacity (MW)Installed Geothermal Capacity in MW of Turkey by Year1827200016001053 1072120062480040015152323307794114 162775311 4050Figure 3.Installed geothermal capacity of Turkey by year (Richter, 2017)21272
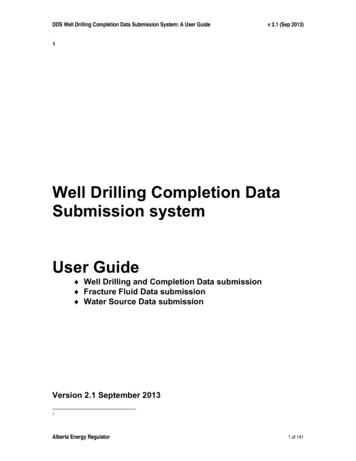
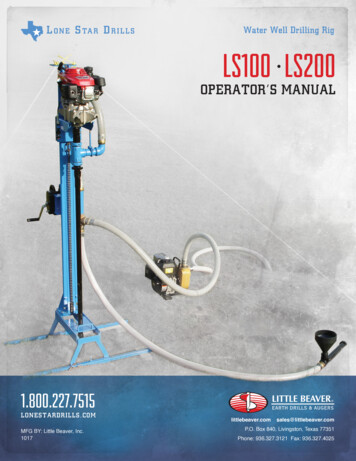
Gul & Aslanoglu2. THE COST OF DRILLING A GEOTHERMAL WELLGeothermal drilling is very similar to oil and gas drilling with minor differences, which are explained in chapter 4 of this paper. Thedrilling phase includes all the activities starting from the well spud until the target depth is reached. The cost of drilling a geothermalwell is estimated to be approximately 40% of the total investment cost for a new high temperature geothermal plant. This makes thegeothermal plant more expensive to build than conventional fuel fired power plants and as a result the cost of the well becomes a keyconsideration when determining the economic viability of a geothermal field. Obtaining accurate costs for the geothermal well istherefore very important as it quantifies a substantial percentage of the cost of the geothermal project (Carolyn, 2013). Drilling ageothermal well is a complex process that uses expensive drill rigs, a wide range of drilling experts and a lot of financial muscle. It isalso a labor-intensive operation with most of the jobs being performed 24 hours a day, seven days a week, in all weather conditions.Only extreme weather, mechanical failure or lack of supplies will warrant the shutting down of these operations (Carolyn, 2013).Several factors affect the cost of geothermal wells. These factors include well design, the total depth of the well, the type of drill rig andthe methods used. Other parameters may include the efficiency of the drilling operation and the optimization of the drilling variables.The total well time constitutes both the drilling and the non-drilling time (Carolyn, 2013).The general design of a vertical geothermalwell in Turkey is provided as in Figure 4. As can be seen in Figure 4, 26” hole are drilled to 200m and 20” casings are run at that depthto prevent the chemical mixing in ground water zones. The next section follows as 17 ½” section drilling and 13 3/8” casing running atan average depth of 700m and 12 ½” section drilling with 9 5/8” casing running at around 2000 meters depending on the formationchanging depths. The last section is always drilled with bit diameter of 8 ½” and 7” slotted casings are used to allow producing throughthe casings and eliminate the perforation costsHole DiameterCasing OuterDiameter26 ''20 ''20017 1/2 ''13 3/8 ''70012 1/4 ''9 5/8 ''20008 1/2 ''7 ''3250-4500(depends fromfield to field)Depth (m)Well Profile.Figure 4:General design of a vertical geothermal well in TurkeyThe estimated total cost of a geothermal well is studied in 11 different parts such as drilling location preparation, tubular equipment,liner hangers, wellhead, drilling contract, mud service, drilling bits,directional drilling or performance drilling services, cementing,logging, company labor and supervision. Out of these 11 steps of the drilling cost, only the costs of 4 of them (drilling contract,mudservice, drilling bits and directional drilling service) are a function of the total drilling time while the other 7 are not related to the rate ofpenetrations in the drilling. Therefore, even though the main aim in drilling is to reduce the total active drilling times and obtain lowercosts, there will also be a constant amount of cost due to location preparation, tubular equipment, liner hangers, wellhead, cementing,logging and company labor which will not be reducing as the total drilling times are decreased. This situation is illustrated in thesensitivity analysis (appendix B) of the software.As an example, for the case with 7” casing setting depth of 3000 meters and effective average rate of penetration in 8.5” section of 5.2m/hr (other inputs as provided in Figure 5), the maximum share of the cost (approximately 42%) belongs to the drilling contract whichincludes daily drilling rate, top drive rate, mobilization and demobilization rate, diesel costs and water costs. Tubular equipment isranked two with approximately 18% of share from the total cost of well which includes the 30” conductor casing, 20” surface casing, 133/8” and 9 5/8” intermediate casings and 7” production casing. Mud service, which is mud material, chemicals, personnel and mudlaboratory equipment, follow as ranked 3 with approximately 12% and drilling location preparation, which is site survey, location androad construction and location rehabilitation follows up with 11.5%. All other associated costs, suchs as liner hangers, wellheads,drilling bits, directional services, cementing, logging and company labor have a sum of 17% share in the total costs.3
Gul & AslanogluThe costs associated with drilling a geothermal well can be outlined as follows:Drilling location preparationa. Site surveyb. Location and road constructionc. Location rehabilitation2. Tubular equipmenta. 30" conductor casingb. 20" casingc. 13 3/8" casingd. 9 5/8" casinge. 7" casing3. Liner hangersa. 7" liner hanger4. Wellheada. 21 1/4" x 2m casing head housingb. 13 5/8" x 3m casing head housingc. 11" master valve5. Drilling contracta. Daily drilling rateb. Top drive ratec. Mobilization rated. Demobilization ratee. Diesel costf. Water cost6. Mud servicea. Mud material and chemicalsb. Personnelc. Mud laboratory equipment7. Drilling bitsa. 26"tricone bitb. 17 1/2" tricone bitc. 12 1/4" tricone bitd. 8 1/2"tricone bite. Nozzles8. Directional servicesa. Personnelb. Equipment rentalc. Surveys9. Cementinga. 20" casing cementing operationb. 13 3/8" casing cementing operationc. 9 5/8" casing cementing operation10. Logginga. Pt logb. Pts logc. Compressor service11. Company labor and supervisiona. Drilling managerb. Drilling engineerc. Geologist1.As mentioned before, the costs associated with a geothermal well drilling and completion has been studied in 11 main items with a totalof 38 subitems.4
Gul & Aslanoglu3. SOFTWARE MODEL AND ESTIMATIONSAn excel spreadsheet has been developed to estimate the total required time and costs associated with each item in the outline providedabove. As the inputs, rig capacity (tons), rig type (single, double or triple stands), the rotary system (kelly or top drive), casing settingdepths for each section and the existence of directional drilling services should be provided. In the geothermal fields of Turkey, theaverage rate of penetration (ROP) values are estimated as 4 m/hr. in 26” section, 8 m/hr. for 17.5” section, 5 m/hr. for 12 ¼” section and4 m/hr. for 8.5” section. These values are input as default and can also be changed in the input page. Similarly, casing running times,tripping speeds for drill pipes and drill collars and connection times for drill pipe, drill collar and directional surveys are also default butcan also be altered depending on the performance of rig crews. The visual of the “Input and constants” page is provided in figure 5.The excel spreadsheet with open source code is accessible by contacting the researchers of this paper.Rig Capacity (tons)200Rig TypeKelly or Top Drive?20" Casing Setting Depth (m)13 3/8" Casing Setting Depth (m)9 5/8" Casing Setting Depth (m)7" Casing Setting Depth (m)Directional Drilling Services (Yes/No)DoubleKelly20070020003000YesEstimated Effective ROP for 26.0" Section Drilling (m/hr)Estimated Effective ROP for 17.5" Section Drilling (m/hr)Estimated Effective ROP for 12.25" Section Drilling (m/hr)Estimated Average ROP for 8.5" Section Drilling (m/hr)Hanged4855.220" BTC Casing Running Time3.0013 3/8" BTC Casing Running Time1.009 5/8" BTC Casing Running Time0.607" BTC Casing Running Time0.60Tripping Speed - Drillpipe3.00Tripping Speed - Drillcollar6.50Connection Time - Drillpipe (for Drilling)10.00Connection Time - Drillcollar (for Drilling)15.00Connection Time Addition for Directional Surveys10.00Figure 2:Input and constants page of the g running times, tripping speeds and connection times for drill pipes, drill collars as well as the additional time for directionalsurveys (the additional time for directional survey includes an if/else condition in the code in which if the directional drilling service isselected as no in the input page, there will be no additional time reflected in the connection times) have been calculated from averageworker performances. These numbers are below the average compared to wells in Europe and the US but in the overall scenario for thecosts, these times do not reflect too much on the overall costs of the wells. Therefore, in the example simulated well, 20”, 13 3/8” and 95/8” BTC casing running times are approximated as 3, 1 and 0.6 min/meter respectively. Tripping speed for drillpipes and drillcollarsare accepted as 3 and 6.5 min/stand and connection times for drillpipes and drill collars are accepted as 10 and 15 minutes/singlerespectively. The use of top drive increases connection and tripping times, but in the same time increases the daily rig costs as well asnon-productive times due to maintenance problems, therefore not all operators prefer rigs with top drives for geothermal drilling inTurkey. The effect of directional drilling services mostly increases the rate of penetration since the reason of having a directionaldrilling service is rather drilling a vertical well and staying in the limits of the lease and making sure that the well is not deviating.Therefore, the use of mud motor increases the rate of penetration gradually especially in really high strength formations which in theend compensates the additional cost due to service and decreases the total well costs.The second page of the code calculates the estimated times for each operation depending on the provided inputs and provides“Operation Time vs Depth” graph for the estimated well conditions as visualized in Table 1. The total time in hours or in days iscalculated by summing up all the time values and multiplying them by 1.1 to compensate for non-productive or unestimated times dueto well or field conditions.5
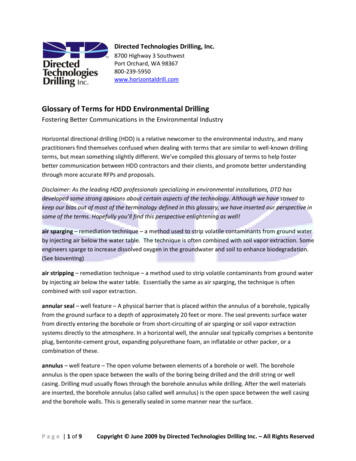
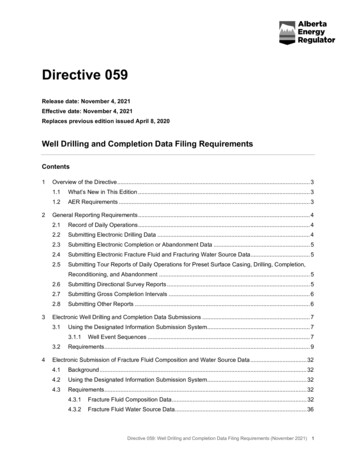
Gul & AslanogluIn the simulated well and drilling conditions as provided in Table 1, drilling times were observed to be the lead participant in the totalwell operations times with 57%. On the other hand, it was observed that a lot of time is spent in connection times (9%) in the simulatedexample well since this well is drilled with kelly and therefore connection times taking longer than the top-drive case. Moreover, casingrunning is observed to be 7% and trips as 6%, while all other operations such as casing cementing, wait on cement, wellhead operationsand well testing operations stand for the remaining 21% of the time spent in operations. This also matched with the generalunderstanding of well costs as the time spent on drilling the well is the most important part of deep geothermal drilling process since therate of penetration values are lower compared to oil and gas wells. More research should be performed on increasing the drilling speedson geothermal wells with either different types of muds or new technology drilling bits.Table 1: Time estimation table with estimated input parameters in Figure 5Time (hours)Time (days)Cumulative time with%10 allowance (days)Depth (m)Start of Operations0.00.00.0026" Section Drilling50.02.12.320026" Connection Time5.00.22.520026" Drillstring Trips1.10.02.620020" Casing Running10.00.43.020020" Casing Cementing4.00.23.2200Wait on Cement12.00.53.820021 1/4" Wellhead24.01.04.9200Run in Hole to Bottom1.10.04.920017 1/2" Section Drilling62.52.67.870017 1/2" Connection Time8.30.38.270017 1/2" Drillstrings Trips7.00.38.570013 3/8" Casing Running11.70.59.070013 3/8" Casing Cementing6.00.39.3700Wait on Cement12.00.59.870013 5/8" Wellhead24.01.010.9700Run in Hole to Bottom2.30.111.070012 1/4" Section Drilling260.010.823.0200012 1/4" Connection Time43.31.824.9200012 1/4" Drillstring Trips15.00.625.620009 5/8" Casing Running20.00.826.620009 5/8" Casing Cementing8.00.326.92000Wait on Cement12.00.527.520009 5/8" Wellhead12.00.528.02000Run in Hole to Bottom5.60.228.320008 1/2" Section Drilling192.38.037.130008 1/2" Connection Time33.31.438.630008 1/2" Drillstring Trips22.50.939.630007" Casing Running30.01.341.03000Well 45.42ItemTOTAL6
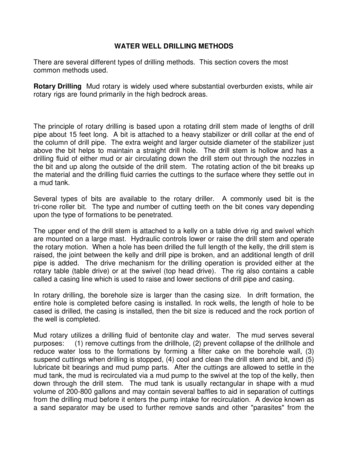
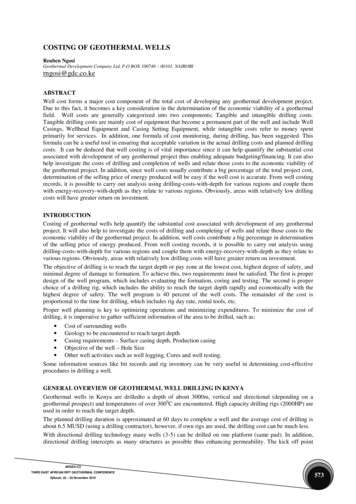
Gul & AslanogluOperation Time vs Depth051015Operation Time (days)202530354045500500Depth (m)100015002000250030003500Figure 3: Operation time vs. depth graph for the simulated example wellThe last part of the spreadsheet is provides the related costs with all the 11 items as outlined in the previous parts of this paper. Thescreenshot of the “cost” section is as in below figures.It has been estimated in the code and calculations that no main equipment such as cementing units, drilling rigs or directional drillingequipment are owned by the operator and these are all obtained as third-party services. Bottom hole assembly (BHA) length in thecalculations and time estimations are estimated as 200 meters for each section.The effect of directional drilling (extra time due to survey times) is reflected only on 12.25” and 8.5” drilling sections. After eachcementing operation, due to high temperatures, the common procedure is to wait on cement for 12 hours in Turkey.Therefore, the same value is considered after each cementing job in each diameter of casings. Moreover, since all drilling operations areconducted with mobile or semi-mobile rigs, the space below the structure is generally very limited and almost no contractor useswellhead installation mechanisms with their rigs. For the same reason, the wellhead operation time is considered as 24 hours for 21 1/4“and 13 5/8” wellheads and 12 hours for 9 5/8” wellheads since the work conducted for 9 5/8” wellhead is mostly only the make-up ofthe master valve and some adapters to get ready for production from the well. For each tricone bit, the life of the bit is estimated as 100hours, which is the general assumption of the operators and service companies. For the company labor and supervision, total costs areincluded in a way to include the travel costs of the personnel. In the time estimations, 10% allowance is added to total times tocompensate for the unexpected time losses and non-productive times in the operations. The associated costs of all spare equipment suchas casings, drilling bits, wellhead, etc. are illustrated in provided figures. As the daily rig rates, it has been estimated to be 9000 forrigs with capacity lower than 200 tons (small rigs) and 11000 for rigs with capacity higher than 200 tons (big rigs). Similarly,mobilization and demobilization costs are 50000 and 75000 for small and big rigs respectively. The model is not compensating forthe increases in ROP due to performance drilling, therefore this value should be changed in the software if there is an expected increasein ROP. Lastly, the casing running times are calculated to include the casing running equipment preparations in the field. There is a 1.3safety factor for casing lengths (to compensate for the damaged casing threads during casing running) and a 1.5 safety factor for drillingbits (suggested to be stored in the field in case of extra bit needs).It should also be noted that the costs associated with every item in Figure 4 are mostly estimations and are subject to change by differentoperators/contractors and/or suppliers of equipment and therefore should not be taken as final costs of each operation or equipment butas an estimation on pricing of the whole project.7
Gul & AslanogluDrilling Location PreparationSite SurveyLocation and Road ConstructionLocation RehabilitationTubular Equipment30" Conductor Casing20" Casing13 3/8" Casing9 5/8" Casing7" CasingLiner Hangers7" Liner HangerWellhead21 1/4" x 2M Casing Head Housing13 5/8" x 3M Casing Head Housing11" Master ValveDrilling ContractDaily Drilling RateTop Drive RateMobilization RateDemobilization RateDiesel CostWater CostMud ServiceMud Material and ChemicalsPersonnelMud Laboratory EquipmentDrilling Bits26" Tricone Bit17 1/2" Tricone Bit12 1/4" Tricone Bit8 1/2" Tricone BitNozzlesDirectional ServicesPersonnel (2DD 1MWD)Equipment RentalCementing20" Casing Cementing Operation13 3/8" Casing Cementing Operation9 5/8" Casing Cementing OperationLoggingPT LogPTS LogCompressor ServiceCompany Labor and SupervisionDrilling ManagerDrilling EngineerGeologistUnit Cost ( )UnitQuantityTotal Cost ( )1000050000200000Unit Cost ( )2501501007560Unit Cost ( )20000Unit Cost ( )10000600020000Unit Cost ( )110000500005000050002000Unit Cost ( antity45.4245.421145.4245.42Quantity1000200Unit Cost ( )200001250090005000100Unit Cost ( )15003000Unit Cost ( )150003000020000Unit Cost ( )750075007500Unit Cost ( 5310,000.0050,000.00200,000.00Total Cost ( l Cost ( )20,000.00Total Cost ( )10,000.006,000.0020,000.00Total Cost ( 39Total Cost ( )200,000.0045,423.489,084.70Total Cost ( )20,000.0012,500.0040,500.0015,000.00950.00Total Cost ( )68,135.22136,270.43Total Cost ( )15,000.0030,000.0020,000.00Total Cost ( )7,500.007,500.007,500.00Total Cost ( )10,000.0020,000.0012,000.00Grand Total2,359,867.55Figure 4: Cost estimations page of the spreadsheet for the simulated example well8
Gul & Aslanoglu4. COMPARISON OF GEOTHERMAL AND OIL & GAS WELLSIn geothermal drilling, some specific problems are encountered more compared to oil and gas drilling [6]. These problems can be listedas below:1. High-temperature instrumentation and seals.Geothermal wells expose drilling fluid and downhole equipment to higher temperatures than in common oil and gas drilling. Hightemperature problems are most frequently associated with the instruments used to measure and control drilling direction and loggingequipment. Most of the tools have limitations of 150 C active bottom hole temperature during drilling.2. LoggingGeothermal logging units require wirelines that can withstand much higher temperatures than those encountered in everyday oil and gasapplications.3. Thermal expansion of casingThermal expansion can cause buckling of casing and casing collapse, which can be costly. Cement operations take more precedence forgeothermal drilling rather than oil & gas. For the same reason, there is no hanger slips used in the wellhead in geothermal drilling to letthe casings expand and prevent possible collapses due to thermal expansion effect.4. Drilling fluids and mud coolersMud coolers are mostly used when flow line temperature exceeds 75 C. High mud temperature causes danger for rig personnel andresults in longer trip times as well as damages the mud pump components. Other than this, the increase in mud temperatures decreasesthe mud viscosity and yield point, which results in more usage of viscosifier to obtain the required rheological properties.5. Drill bitsFormations bearing geothermal reservoirs tend to be harder and more fractured crystalline compared to sedimentary formations in oiland gas operations. Most of the resources are in formations that are igneous, influenced by volcanic activity or altered by hightemperatures. These formations are generally more difficult to drill due to geophysical activities and confined stresses.6. Lost circulationGeothermal reservoirs are quite often under-pressured and prone to lost circulation due to faults associated in the zones, which results invery difficult casing and cementing operations. In total loss circulations, lower cuttings carrying capacity of the mud results in highertorque and drag, which may result in stuck pipe problems. Similarly, in casing operations, an empty well means higher pipe weights andin some situations, it is not possible to cement these casings even while mixing them with lost circulation materials.5. DISCUSSIONS AND CONCLUSIONSGeothermal drilling costs follow the general oil and gas industry trend, which exemplifies a total dependence to crude oil prices. Thissituation is likely to persist as long as the geothermal drilling sector does not build-up a strong market share of its own (Dumas, Antics,& Ungemach, 2013). As shown in figure 8, a graph with the current trend of oil prices vs yearly average daily drilling rates has beenprepared. As can be seen in the figure, the trend of daily rig rates in Turkey are also following the trend of crude oil prices. That can bestbe explained by the decreasing interest in demand which results in a more competitive market. On the other hand, another graphcomparing the total drilling costs from Australia, France, Germany, Iceland, Kenya, Nevada (US), Netherlands and US Oil & Gas withthe simulation results from the developed code is shown as in figure 9. In this calculation, the same inputs shown in figure 5 have beenused only with changes in production casing setting depth and ROP (decreasing average ROP 20% percent in each 500 metersincrement). The estimated average ROP for 8.5” section vs depth has been provided in table 2.Table 2: Depth vs ROP values for the comparison studyDepth (m)8.5 section ROP(m/hr)Total EstimatedCost ( 1459
Gul & Aslanoglu25000 /day160 /bbl120 /bbl15000 /day80 /bbl10000 /day40 /bbl5000 /day0 /day2006Crude Oil PriceDaily Drilling Rate20000 /day20082010750-900 HP, 100-120 ton (1000-1500 m)2012201420161350-2000 HP, 200-320 ton (1500-3500 m)0 /bbl2018Crude Oil PriceFigure 5: Crude oil prices vs daily rig rates in TurkeyAs can be seen from figure 8, total well costs (drilling, well completion and well testing) have been compared with other geothermalproducing countries, with blue dots showing the results from the model provided. As illustrated here, well costs in Turkey are graduallycheaper compared to other countries. The reasons of cheaper well construction can be explained in three manners. Firstly, dailyoperating costs of rigs, third-party services and labor costs in Turkey are more affordable compared to other countries. Secondly, themajor equipment of the well, which are the casings, are chosen from the lowest cost option since wells are not overbalanced and there isno need for a high cost or high-grade casing to drill these wells. Thirdly, the drilling experience in Turkey resulted in a competitivemarket which resulted in more optimized wells with the minimum drilling times. There is also the need to note that the costs associatedwith value added taxes are not included in model estimation calculations.03,000,000Cost (Million )6,000,0009,000,00012,000,0001,5002,000Depth rmanyIcelandKenyaNevada (U.S)NetherlandsUS Oil WellsSimulation results in TurkeyFigure 6: Comparison of published well costs of different countries vs model results in different depths in Turkey10
Gul & AslanogluREFERENCESAugustine, C., Tester, J. W., Anderson, B., & Petty, S. (2006). A Comparison Of Geothermal With Oil And Gas Well Drilling Costs.Proceedings, Thirty-First Workshop on Geothermal Reservoir Engineering (pp. 1-15). Stanford: Stanford University.Carolyn, K. (2013). Cost Model for Geothermal Wells. Geothermal Training Programme, 23.Dumas, P., Antics, M., & Ungemach, P. (2013). Report on Geothermal Drilling. Geoelec.Gul, S. (2017, December 01). Medya Enerji. Retrieved December 15, 2017, from Medya Enerji: www.medyaenerji.comHuddle
The total well time constitutes both the drilling and the non-drilling time (Carolyn, 2013).The general design of a vertical geothermal well in Turkey is provided as in Figure 4. As can be seen in Figure 4, 26" hole are drilled to 200m and 20" casings are run at that depth