Transcription
ORIGINAL ARTICLECotter et al.Improved Graft Survival After LiverTransplantation for Recipients WithHepatitis C Virus in the Direct-ActingAntiviral EraThomas G. Cotter ,1* Sonali Paul,1* Burhaneddin Sandıkçı,4 Thomas Couri,2 Adam S. Bodzin,3Ester C. Little,5 Vinay Sundaram,6 and Michael Charlton 11 Centerfor Liver Diseases; 2 Department of Medicine; 3 Section of Abdominal Organ Transplantation, Department ofSurgery, University of Chicago Medicine, Chicago, IL; 4 Booth School of Business, University of Chicago, Chicago, IL;5 Banner University Medical Center, Phoenix, AZ; and 6 Division of Gastroenterology and Comprehensive Transplant Center,Cedars-Sinai Medical Center, Los Angeles, CAHighly effective direct-acting antiviral (DAA) therapy has transformed outcomes of liver transplantation in hepatitis C virus(HCV) patients. We examined longer-term outcomes in HCV-positive recipients in the DAA era and analyzed the ScientificRegistry of Transplant Recipients for primary adult, single-organ, nonfulminant liver transplant recipients in the UnitedStates from January 1, 2008 to June 30, 2018. Graft loss was compared among HCV-positive liver transplant recipients whoreceived either an HCV-negative or HCV-positive donor (donor [D]–/recipient [R] ; D /R ) and HCV-negative liver transplant recipients who received a HCV-negative donor (D–/R–). The groups were further divided between the pre-DAA andDAA eras. There were 52,526 patients included: 31,193 were D–/R– patients; 18,746 were D–/R patients; and 2587 wereD /R patients. The number of D–/R transplants decreased from 2010 in 2008 to 1334 in 2017, with this decline particularlynoticeable since 2015. D–/R patients in the DAA era (n 7107) were older, had higher rates of hepatocellular carcinoma,and lower Model for End-Stage Liver Disease scores than those in the pre-DAA era. Graft survival improved for all recipientsin the DAA era but improved most dramatically in HCV-positive recipients: D–/R 1-year survival was 92.4% versus 88.7%and 3-year survival was 83.7% versus 77.7% (DAA versus pre-DAA era, respectively) compared with D–/R– 1-year survival of92.7% versus 91.0% and 3-year survival of 85.7% versus 84.0% (DAA versus pre-DAA era, respectively). The magnitude ofimprovement in 3-year graft survival was almost 4-fold greater for D–/R patients. The 3-year survival for D /R patientswas similar to HCV-negative patients. In conclusion, the number of liver transplants for HCV has decreased by more thanone-third over the past decade. Graft survival among HCV-positive recipients has increased disproportionately in the DAAera with HCV-positive recipients now achieving similar outcomes to non-HCV recipients.Liver Transplantation 25 598‒609 2019 AASLD.Received November 19, 2018; accepted January 27, 2019.Direct-acting antiviral (DAA) therapy has transformed the landscape of hepatitis C virus (HCV)management. Combination use of DAAs has resultedAbbreviations: BMI, body mass index; CI, confidence interval;D, donor; DAA, direct-acting antiviral; DCD, donation aftercirculatory death; ELTR, European Liver Transplant Registry;HCC, hepatocellular carcinoma; HCV, hepatitis C virus; HR, hazardratio; ICU, intensive care unit; INR, international normalized ratio;LOS, length of stay; MELD, Model for End-Stage Liver Disease;NAT, nucleic acid amplification test; OPTN, Organ Procurementand Transplantation Network; pps, percentage points; PTDM,posttransplant diabetes mellitus; PVT, portal vein thrombosis; R,recipient; SRTR, Scientific Registry of Transplant Recipients; SVR,598 Original Articlein highly effective interferon-free regimens with a current sustained virological response (SVR) above 90%,regardless of genotype, severity of the liver disease,renal function, and whether or not the patient waspreviously treated.(1-4)The DAA era has also impacted HCV-related livertransplantation. Although 3.5 million Americans areestimated to have chronic HCV infection,(5) HCVis no longer the most common listing indication forliver transplantation in the United States, having beensuperseded by nonalcoholic steatohepatitis and alcoholic liver disease.(6) There has been a notable decreasein HCV-positive wait-listed patients and HCVpositive liver transplant recipients between 2006 and
Liver Transplantation, Vol. 25, No. 4, 2019 Cotter et al.2016 from 30.9% to 22.7% and from 25.2% to 17.6%,respectively.(6)HCV-positive patients who undergo liver transplantexperience universal recurrence. The poor efficacy andtolerability of peginterferon ribavirin-based regimens(7-9) in the pre-DAA era decreased patient andgraft survival for HCV-positive patients with an overall10% difference at 10 years when compared with thosetransplanted for other indications.(10-14) However,more recent studies have indicated that patients treatedin the DAA era may have improved short-term graftsurvival compared with those treated in the pre-DAAera.(15,16) In addition, a recent cohort study of theEuropean Liver Transplant Registry (ELTR) demonstrated improved 3-year survival of LT recipients withHCV-related liver disease in the DAA era.(17) Thisstudy from the ELTR, which ran through June 2017,provided important information on trends and outcomes in the DAA era, but it lacked information indifferent HCV recipient and donor combinations, aswell as important granular posttransplant outcomessuch as renal function, posttransplant diabetes mellitus(PTDM), and acute rejection.Little is known about longer-term patient andgraft survival in HCV-positive liver transplant recipients in the DAA era in the United States. We soughtto examine the relative frequency and outcomes ofHCV-positive liver transplant recipients in the DAAera when compared with patients from the pre-DAAera and when compared with recipients without HCVinfection. Considering the proven efficacy and tolerability of DAA therapy, we hypothesized that therehas been a decrease in liver transplants for HCV andthat posttransplant outcomes would be improved andmaybe would even equal that of non–HCV-infectedliver transplant recipients.sustained virological response; T2DM, type 2 diabetes mellitus;TIPS, transjugular intrahepatic portosystemic shunt.Data were collected from the Scientific Registryof Transplant Recipients (SRTR) on adult patients(18 years of age or older) who underwent a primary,single-organ, nonfulminant deceased donor livertransplant from January 1, 2008 to June 30, 2018. Datain the SRTR database are prospectively collected directly by the Organ Procurement and TransplantationNetwork (OPTN) from transplant programs, organprocurement organizations, and histocompatibilitylaboratories. These data are supplemented by data fromthe Centers for Medicare and Medicaid Services andthe National Technical Information Service’s DeathMaster File.(18) Clinical data obtained at the time oftransplant included recipient age, sex, ethnicity, primary liver disease, body mass index (BMI), creatinine, sodium, bilirubin, international normalized ratio(INR), albumin, height, Model for End-Stage LiverDisease (MELD) score, the presence of hepatocellular carcinoma (HCC), encephalopathy, ascites, lengthof stay (LOS), acuity of medical condition, functionalstatus, comorbidities, and wait-list time. Donor age,ethnicity, sex, height, donation after circulatory death(DCD), macrovesicular fat, microvesicular fat, thepresence of diabetes, cold and warm ischemia time,and cause of death were also recorded. The posttransplant follow-up data collected included graft failure,retransplantation, and death. In addition, the prospectively collected data by SRTR/OPTN from the adultliver transplant recipient follow-up worksheet enabledAddress reprint requests to Michael Charlton, M.D., Center for LiverDiseases, University of Chicago Medicine, 5841 South MarylandAvenue, Chicago, IL 60637. Telephone: 773-795-7624; E-mail:mcharlton@medicine.bsd.uchicago.edu*These authors contributed equally to this work.Thomas G. Cotter participated in the study concept and design,acquisition of data, interpretation of data, and drafting of themanuscript. Sonali Paul participated in the study concept and design,acquisition of data, interpretation of data, drafting of the manuscript,and critical revision of the manuscript for important intellectual content.Burhaneddin Sandıkçı participated in the analysis and interpretationof data and the drafting of the manuscript. Thomas Couri participatedin the drafting of the manuscript. Adam S. Bodzin, Ester C. Little, andVinay Sundaram participated in the critical revision of the manuscriptfor important intellectual content. Michael Charlton participated in thestudy concept and design, interpretation of data, and critical revision ofthe manuscript for important intellectual content. All authors approvedthe final version to be published.Vinay Sundaram is on the speaker’s bureau for Gilead, Abbvie, Salix,and Intercept. Ester C. Little receives grants and contracts for researchfrom Intercept and Target Pharma Solutions. Michael Charltonconsults, has advisory arrangements, and receives grants and contractsfor Gilead.Additional supporting information may be found in the online versionof this article.Copyright 2019 by the American Association for the Study of LiverDiseases.View this article online at wileyonlinelibrary.com.DOI 10.1002/lt.25424Patients and MethodsSTUDY POPULATIONOriginal Article 599
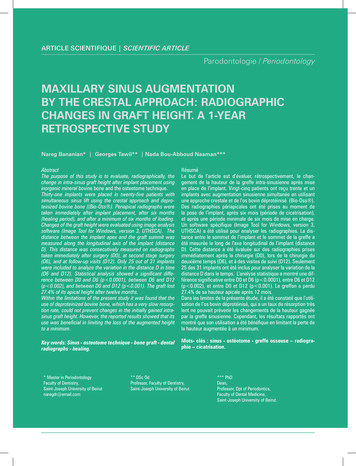
Cotter et al. renal function, new diabetes, acute rejection, and rehospitalizations to be ascertained.Liver transplant recipients with HCV as a primaryor secondary transplant indication were identified.Diagnoses were assigned by transplant centers withoutprerequisite diagnostic or confirmatory criteria (HCVantibody and/or RNA testing was not a prerequisite fora recipient being entered into SRTR with a diagnosisof HCV). Recipients are thus classified according totransplant center designation in SRTR as having HCVinfection (recipient [R] ) or not having HCV infection(R–). HCV-negative donors (donor [D]–) and HCVpositive donors (D ) were then identified, as definedby HCV serology and/or HCV nucleic acid testing(only available since 2014). Graft survival (defined asfree from graft failure, retransplantation, or death) wasthen compared among 3 primary groups:1. HCV-positive liver transplant recipients whoreceived a HCV-negative donor (D–/R ).2. HCV-negative liver transplant recipients whoreceived a HCV-negative donor (D–/R–).3. HCV-positive liver transplant recipients whoreceived a HCV antibody positive or RNA-positivedonor (D /R ).The groups were further divided between the preDAA era (January 1, 2008 to November 24, 2013) andthe DAA era (November 25, 2013 to June 30, 2018).The start of the DAA era was defined as November2013, coinciding with regulatory approval of simeprevir and sofosbuvir.STATISTICAL ANALYSISContinuous variables were summarized with meansand standard deviations, and frequencies and percentages were used for categorical variables. Comparativeanalysis of continuous variables was based on 2sample Wilcoxon rank sum test for samples that failedthe Shapiro-Wilk normality test; otherwise, it wasbased on 2-sample t test. Comparative analysis of categorical variables was based on 2-sided chi-square test.Missing data in any particular variable were ignored.Graft loss was analyzed by the Kaplan-Meier methodwith log-rank testing. The analysis was adjusted fortechnical deaths both at 30 and 90 days after transplant. A multivariate Cox regression analysis was alsoperformed to evaluate for predictors of graft failure inthe DAA era. These results are provided in hazard ratios (HRs) with confidence intervals (CIs). A P valueof 0.05 was considered significant for all statistical600 Original ArticleLiver Transplantation, April 2019methods used. The statistical analyses were completedusing R, version 3.4.4 (R Foundation for StatisticalComputing, Vienna, Austria).ResultsHCV-POSITIVE LIVERTRANSPLANT RECIPIENTS OFHCV-NEGATIVE LIVERS (D–/R ):FREQUENCY AND COMPARATIVEDEMOGRAPHICSThe total study cohort consisted of 52,526 patients, ofwhich 31,193 were D–/R– and 18,746 were D–/R .The number of D–/R transplants decreased from2010 in 2008 to 1334 in 2017, with this decline particularly noticeable since 2015, whereas the numberof D–/R– transplants increased from 2397 to 4167during the same period (Fig. 1).Recipients of the D–/R group in the DAA era(n 7107) compared with those in the pre-DAA era(n 11,639) were significantly older (59.1 years versus 56.1 years; P 0.001), had a higher rate of HCC(59.6% versus 46.4%; P 0.001) and type 2 diabetesmellitus (T2DM; 23.0% versus 19.6%; P 0.001), hadlower MELD scores (18.7 versus 20.3; P 0.001), andhad increased wait-list times (361.0 versus 298.7 days;P 0.001; Table 1; Supporting Table 1). In addition,there were more patients in the intensive care unit(ICU; 9.1% versus 8.3%; P 0.001) and on life support(5.2% versus 4.4%; P 0.009) at time of transplant inthe DAA era than those in the pre-DAA era. Donorsof the D–/R group in the DAA era were older (42.1versus 40.5 years; P 0.001), had higher BMIs (28.4versus 27.6 kg/m2; P 0.001), and had increased ratesof DCDs (8.0% versus 6.1%; P 0.001) comparedwith those in the pre-DAA era.Recipients of the D–/R– group in the DAA era(n 16,471) were older (55.0 versus 54.8 years;P 0.003), had lower rates of HCC (22.9% versus24.9%; P 0.001), and had increased rates of T2DM(29.2% versus 26.6%; P 0.001). They had higherMELD scores (24.3 versus 22.2; P 0.001) anddecreased wait-list times (235.7 versus 256.8 days;P 0.026), whereas more patients were in the ICU(14.5% versus 10.1%; P 0.001), on life support(8.2% versus 5.7%; P 0.001), and on dialysis (12.5%versus 8.9%; P 0.001) than those in the pre-DAAera (n 14,722; Table 1). In the D–/R– cohort in
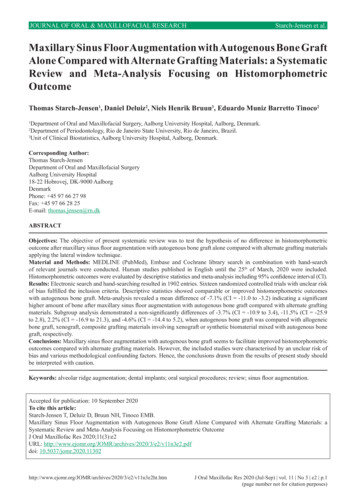
Liver Transplantation, Vol. 25, No. 4, 2019 Cotter et al.FIG. 1. Annual number of liver transplants in the United States in D–/R–, D–/R , and D /R groups from January 1, 2008 toJune 30, 2018. The value for 2018 represents 6 months of data (January 1, 2018 to June 30, 2018).the DAA era, there were fewer black patients (6.3%versus 7.0%; P 0.001) and more Hispanic patients(13.5% versus 12.5%; P 0.001) transplanted(Supporting Table 1). Donors of the D–/R– group inthe DAA era were younger (42.4 versus 43.5 years;P 0.001), had higher BMIs (28.3 versus 27.6 kg/m2; P 0.001), and had increased rates of DCDs(7.2% versus 5.1%; P 0.001) compared with thosein the pre-DAA era (Table 1). In the DAA era, D–/R patients were older and had lower BMIs andMELD scores than the D–/R– patients (all P values 0.001).Graft SurvivalGraft survival improved for all recipients in theDAA era, but it improved most dramatically forHCV-positive recipients: D–/R 1-year survivalwas 92.4% versus 88.7% (P 0.001) and 3-yearsurvival was 83.7% versus 77.7% (DAA versus preDAA era, respectively; P 0.001) compared withD–/R– 1-year survival of 92.7% versus 91.0% and3-year survival of 85.7% versus 84.0% (DAA versuspre-DAA era, respectively; P 0.002). The magnitude of improvement in survival was almost 4-foldgreater for D–/R patients compared with D–/R–patients (6 percentage points [pps] versus 1.7 pps at3 years; P 0.001). Although the 3-year survival forD–/R patients is much improved, there remainsa difference when outcomes are compared withthat for HCV-negative patients (P 0.041; Fig. 2).Similar graft survival rates were observed when patients who died up to 90 days after transplant (ie,technical deaths) were excluded. In D–/R patientsof the DAA era, there was no statistically significantdifference between the graft survival of DCD andnon-DCD grafts (P 0.067).Additional Posttransplant OutcomesAt 1 year after transplant (mean follow-up of 231 versus 232 days; P 0.112), D–/R patients in the DAAera had a similar average creatinine (1.285 versus 1.317mg/dL; P 0.680), lower rates of PTDM (2.7% versus 7.5%; P 0.001), lower rates of acute rejection(5.9 versus 9.3%; P 0.001), and a lower number ofOriginal Article 601
602 Original Article17.8 8.214.4 17316.6 549.820.3 10.514.5 19.3298.7 535.12909 (25.0)5406 (46.4)MELD†LOS after transplant, daysDays on the waiting listSex, femaleHCC31 (3.2)252 (26.4)1309 (8.9)4369 (29.7)1372 (9.3)1699 (11.5)573 (3.9)840 (5.7)1494 (10.1)2917 (19.8)10,311 (70.0)3667 (24.9)5378 (36.5)256.8 505.415.5 21.422.2 10.228.7 6.054.8 11.0750 (5.1)27.6 6.343.5 17.7D–/R–(n 14,722)541 (7.6)1636 (23.0)587 (8.3)1023 (14.4)190 (2.7)372 (5.2)647 (9.1)1032 (14.5)5413 (76.2)4239 (59.6)1719 (24.2)361.0 566.713.8 18.018.7 11.028.7 5.359.1 6.7567 (8.0)28.4 6.742.1 15.9D–/R (n 7107)43 (2.6)379 (23.2)102 (6.3)224 (13.7)10 (0.6)26 (1.6)50 (3.1)166 (10.2)1412 (86.7)927 (56.8)378 (23.2)284.4 470.812.2 15.417.3 8.228.5 5.358.8 6.754 (3.3)27.0 5.738.8 12.4D /R (n 1631)2058 (12.5)5644 (34.3)1954 (11.9)2372 (14.4)662 (4.0)1349 (8.2)2381 (14.5)3539 (21.5)10,481 (63.6)3767 (22.9)6055 (36.8)235.7 455.615.3 20.124.3 10.829.1 6.155.0 11.41194 (7.2)28.3 6.942.4 16.7D–/R–(n 16,471)Post-DAA Era (November 25, 2013 toJune 30, 2018)NOTE: Missing data accounted for 1% of data. Data are given as mean standard deviation and n (%).*P value for the pre-DAA era versus the post-DAA era.†At time of transplant.843 (7.2)3285 (28.2)Dialysis†Moderate ascites†71 (7.4)90 (9.4)1131 (9.7)1080 (9.3)PVTGrade 3-4 encephalopathy19 (2.0)339 (2.9)23 (2.4)43 (4.5)On ventilator†962 (8.3)ICU113 (11.8)800 (83.7)512 (4.4)2072 (17.8)Inpatient (non-ICU)454 (47.5)Life support†8605 (73.9)OutpatientCare setting†28.2 5.2BMI, kg/m2234 (24.5)56.2 6.556.1 6.728.6 5.3Age, yearsRecipients14 (1.5)27.8 6.4708 (6.1)27.6 6.2DCDBMI,42.1 12.340.5 15.7D /R (n 956)kg/m2D–/R (n 11,639)Age, yearsDonorsVariablePre-DAA Era (January 1, 2008 toNovember 24, 2013)0.001 0.0010.446 0.0010.002 0.0010.363 0.0010.0030.1920.0630.3610.009 0.0010.482 0.0010.2210.5410.0020.1190.222 0.001 0.001 0.001 0.001 0.0010.198 0.0010.0010.001 0.001 0.001D /R * 0.001 0.001D–/R * 0.001 0.001 0.001 0.0010.585 0.001 0.001 0.0010.6810.0260.901 0.001 0.0010.003 0.001 0.001 0.001D–/R–* 0.0010.0020.646 0.001 0.001 0.001 0.001 0.001 0.001 0.0010.946 0.001 0.001 0.001 0.001 0.001 0.001 0.001 0.001 0.001 0.001 0.001 0.0010.7830.1130.400 0.0010.002 0.0010.3020.806 0.0010.557 0.001Pre-DAA D–/ Post-DAA D–/R versusD–/R– R versusD–/R–P ValueTABLE 1. Baseline Characteristics of HCV-Positive Liver Transplant Recipients in the Pre-DAA and Post-DAA Therapy Eras With HCV-Negative RecipientsIncluded as a Comparative GroupCotter et al. Liver Transplantation, April 2019
Liver Transplantation, Vol. 25, No. 4, 2019 Cotter et al.Adjusted P valuesD—/R—, Pre-DAA EraD—/R—, Post-DAA Era D—/R—, Pre-DAA Era D—/R , Post-DAA Era D—/R , Pre-DAA Era D /R , Post-DAA Era0.002D—/R , Post-DAA Era0.0410.995D—/R , Pre-DAA EraD /R , Post-DAA Era 0.0010.980 0.0010.116 0.0010.338 0.001D /R , Pre-DAA Era 0.001 0.0010.0030.7190.002FIG. 2. Kaplan-Meier analysis showing improved 3-year graft survival among HCV-positive liver recipients in the DAA era comparedwith the pre-DAA era and similar graft survival compared with HCV-negative recipients of a HCV-negative liver in the DAA era.rehospitalizations (1.131 versus 1.179 [P 0.001];0.460 versus 0.581 [P 0.001] when missing valueswere treated as 0 compared with pre-DAA D–/R patients (Supporting Table 2). At 3 years after transplant (mean follow-up of 437 versus 500 days;P 0.001), these improvements were maintained inD–/R patients in the DAA era, and the difference increatinine levels became statistically significant. Therewas a similar trend when D–/R– patients in the DAAera were compared with pre-DAA D–/R– patients,except there was no difference in average creatinine,even at 3 years after transplant (Supporting Table 2).Notably, at 1 year after transplant, D–/R patientsin the DAA era had a lower creatinine (1.285 versus1.346 mg/dL; P 0.001) than the D–/R– patients inthe DAA era. Furthermore, in multivariate regression analysis, adjusting for potential confounders theDAA era D–/R– group had a higher average creatinine and lower rates of rehospitalization comparedwith the DAA era D–/R group (Table 2). In addition, the D–/R group in the DAA era maintainedits lower average creatinine compared with the preDAA D–/R group when adjusted for confounders(Table 2).Original Article 603
Cotter et al. Liver Transplantation, April 2019TABLE 2. Multivariate Regression Analysis of Posttransplant Outcomes of HCV-Positive Liver Transplant RecipientsCreatinineNumber ofRehospitalizationsPTDMAcute RejectionCoefficientP ValueCoefficientP ValueCoefficientP ValueCoefficientP Value–1.143 0.0011.020 0.001–1.1070.390–2.069 Age0.006 0.001–0.002 0.0010.0090.008–0.022 0.001BMI0.0000.9700.0010.4100.025 0.001–0.0070.005Wait-list MELD0.006 0.004 26 0.0010.0060.243–0.0530.293–0.0170.3720.186 09 200.001–0.0100.121–0.0080.860–0.0100.642LOS after transplant0.004 0.0010.002 0.0010.0030.0340.0010.248Male (reference female)0.134 0.001–0.046 0.0010.1800.046–0.250 0.0010.191 0.0010.069 0.0010.402 0.0010.260 0.001–0.065 0.0010.0210.1460.2820.002–0.0170.707–0.040 ateInterceptDonorRecipientCreatinineRace (reference white)BlackHispanicHCCDiabetesType 10.227 8 0.0010.051 0.0480.021–0.0850.580–0.0480.473ICU–0.087 0.0010.0610.022–0.2110.2670.0520.532Life 41History of de 0.1230.036Moderate 8 0.001Severely .024D–/R 0.040 0.0010.059 0.0010.0310.682–0.0130.739D /R 0.0730.0210.1060.0010.1700.3440.0860.401–0.046 0.001–0.213 0.001–1.082 0.001–0.396 0.001–0.067–0.094 .0690.429–0.044–0.1240.4990.373Cohort (referenceD–/R–)Era (reference pre-DAA)DAA eraInteraction terms(D–/R ) (DAA era)(D /R ) (DAA era)604 Original Article
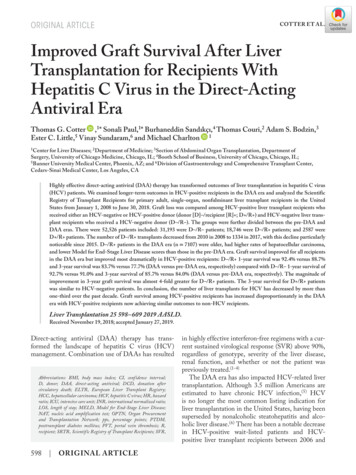
Liver Transplantation, Vol. 25, No. 4, 2019 Cotter et al.Adjusted P valuesD–/R–, Post-DAA Era, non-HCC D–/R–, Post-DAA Era, HCCD–/R , Post-DAA Era, non-HCC D–/R , Post-DAA Era, HCC D /R , Post-DAA Era, non-HCCD–/R–, Post-DAA Era, HCC0.165D–/R , Post-DAA Era, non-HCC0.4000.566D–/R , Post-DAA Era, HCC0.0220.6280.243D /R , Post-DAA Era, non-HCC0.4000.1850.2430.165D /R , Post-DAA Era, HCC0.3400.8820.6030.9310.203FIG. 3. Kaplan-Meier analysis showing no difference in 3-year graft survival among HCV-positive and HCV-negative liver recipientsin the DAA era when separated into HCC and non-HCC subgroups.HCC and Predictors of Graft FailureIn the DAA era, there was no statistically significantdifference in graft survival between recipients withand without HCC among the 3 studied groups (Fig.3). However, in multivariate Cox regression analysisin the DAA era, HCC was independently associatedwith early graft failure (HR, 1.21; 95% CI, 1.09-1.34;P 0.001). Other significant predictors of early graftfailure included donor age; DCD; recipient’s BMI andalbumin; the presence of T2DM, portal vein thrombosis (PVT), and advanced encephalopathy; and beingon a ventilator (Table 3).HCV-POSITIVE LIVERTRANSPLANT RECIPIENTS OFHCV-POSITIVE LIVERS (D /R ):FREQUENCY AND COMPARATIVEDEMOGRAPHICSThere were 2587 D /R patients in the cohort. Thenumber of D /R transplants increased from 148 in2008 to 382 in 2017 (Fig. 1). Recipients of the D /R group in the DAA era (n 1631) compared with thosein the pre-DAA era (n 956) were older (58.8 versus 56.2 years; P 0.001), had a higher rate of HCC(56.8% versus 47.5%; P 0.001), had similar MELDOriginal Article 605
Cotter et al. Liver Transplantation, April 2019TABLE 3. Multivariate Cox Proportional HazardsRegression of Predictors of Graft Failure in Liver TransplantRecipients in the DAA eraCovariateCoefficientHR (95% CI)P Value 0.001DonorAge0.0081.01 (1.01-1.01)BMI–0.0050.99 (0.99-1.00)0.110DCD0.5731.77 (1.54-2.04) 0.001Diabetes0.1471.16 (1.03-1.30)0.011RecipientAge0.0051.00 (1.00-1.01)0.044BMI–0.0110.99 (0.98-1.00)0.002Days on the waiting list0.0001.00 (1.00-1.01)0.624MELD–0.0021.00 (0.99-1.01)0.703Albumin–0.0900.91 (0.86-0.97)0.0020.1891.21 (1.09-1.34) 0.0010.2741.32 (0.94-1.83)0.105HCCDiabetesType 1T2DM0.1671.18 (1.08-1.29) 0.001Dialysis0.0591.06 (0.89-1.26)0.504Life support0.0671.07 (0.85-1.35)0.576Ventilator0.2781.32 (1.02-1.71)0.035ICU0.1231.13 (0.91-1.41)0.276PVT0.2291.26 (1.13-1.40) 0.001History of TIPS–0.0620.94 (0.83-1.07)0.351Grade 3-4encephalopathy0.2681.31 (1.12-1.53) 0.001Moderate ascites–0.0590.94 (0.82-1.08)0.3940.0570.0671.06 (0.97-1.16)1.07 (0.90-1.27)0.2260.455Cohort (reference D–/R–)D–/R D /R scores (17.3 versus 17.8; P 0.119), and had decreasedwait-list times (284.4 versus 316.6 days; P 0.541;Table 1; Supporting Table 1). Donors of the D /R group in the DAA era were younger (38.8 versus42.1 years; P 0.001), had lower BMIs (27.0 versus27.8 kg/m 2; P 0.001), and there was an increasedrate of DCDs (3.3% versus 1.5%; P 0.001) comparedwith those in the pre-DAA era (Table 1).Graft SurvivalGraft survival also improved for D /R patients:1-year survival was 93.3% versus 90.3% and 3-yearsurvival was 84.4% versus 78.0% (DAA versus preDAA era, respectively; P 0.002). Also, there was nodifference in outcomes when compared with D–/R–patients (P 0.980).606 Original ArticleAdditional Posttransplant OutcomesAt 1 year after transplant (mean follow-up of 229 versus 231 days; P 0.866), D /R patients in the DAAera had a similar average creatinine (1.26 versus 1.31mg/dL; P 0.710), lower rates of PTDM (2.3% versus7.7%; P 0.001), lower rates of acute rejection (6.3%versus 10.3%; P 0.001), and lower number of rehospitalizations (1.11 versus 1.22; P 0.001) comparedwith pre-DAA D /R patients (Supporting Table 2).At 3 years after transplant (mean follow-up of 407versus 502 days; P 0.001), these improvements weremaintained in D /R patients in the DAA era, andthe difference in creatinine levels became statisticallysignificant (P 0.002; Supporting Table 2).DiscussionIn this analysis of the SRTR database, there are anumber of important observations. First, the numberof liver transplants for HCV-related cirrhosis continues to decrease, despite the noteworthy increase in D /R transplants. Despite the substantial ( 30%) fall inthe number of transplants performed for patients withHCV, the overall number of transplants has increased,reflecting a more than equal increase in liver transplantation for other indications. More importantly, inthe DAA era, HCV-positive recipients had substantially better graft survival than HCV-positive recipients in the pre-DAA era, with graft survival nowcomparable to that observed in non-HCV recipients.Recipients without HCV infection in the DAA eraalso experienced improved graft survival comparedwith the pre-DAA era, suggesting that the observedimprovements were not solely on the basis of the impact of DAAs. However, the magnitude of improvement in graft survival between these eras was 4-foldgreater in the group of D–/R patients compared withthe D–/R– group (P 0.001).HCV-positive patients who undergo liver transplant experience universal recurrence of HCV. Thepoor efficacy of HCV treatments prior to the DAA eratranslated to graft injury and loss or recurrent cirrhosis.In the pre-DAA era, mortality in HCV patients transplanted from HCV-positive donors has been shownto be 12.5% at 1 year, 24.2% at 3 years, and 33.0% at5 years, with a graft loss rate of 2.2% at 1 year, 4.8% at3 years, and 7.5% at 5 years with no difference notedin those transplanted with HCV-negative donors.(19)
Liver Transplantation, Vol. 25, No. 4, 2019 Cotter et al.Conversely, although access to medication remaineda problem, in the DAA era HCV-positive liver transplant recipients have had improved early graft survivalcompared with those treated in the pre-DAA era.(15)A recent retrospective analysis demonstrated significantly improved 1-year survival rates (91.9% versus89.8%) in HCV-positive patients transplanted in theDAA era compared with the pre-DAA era.(16) Ourresults, on a similar but larger cohort, show that theexcellent graft survival extends to at least 3 years inthis transplant population and is congruent with theimprovement noted in the ELTR study, which demonstrated improved 3-year survival of LT recipients withHCV-related liver disease from 65.1% to 76.9% in theDAA era.(17) Our higher 3-year survival rate of 83.7%may be partly explained by the censoring of technical deaths within 30 days of transplant in our cohort.Although the historical survival gap between D /R patients and non–HCV-infected patients has disappeared in our study (P 0.980), similar to the resultsfrom the ELTR database,(17) a difference still existsbetween D–/R patients and non–HCV-infectedpatients (P 0.041). In comparison to the study fromthe ELTR database,(17) our article provides an additional 1 year of data and includes waiting list data andimportant granular posttransplant data (renal function, PTDM, rehospitalizations, and acute rejection).Moreover, the available donor laboratory data enableddifferentiation of HCV-positive recipients into D and D– groups, an important differentiation.The improved outcomes of D–/R patients in theD
Surgery, University of Chicago Medicine, Chicago, IL; 4Booth School of Business, University of Chicago, Chicago, IL; 5Banner University Medical Center, Phoenix, AZ; and 6Division of Gastroenterology and Comprehensive Transplant Center, . Graft loss was analyzed by the Kaplan-Meier method with log-rank testing. The analysis was adjusted for