Transcription
Analyzing Cacheable Traffic in ISP Access Networks forMicro CDN Applications via Content-Centric NetworkingClaudio ImbrendaLuca MuscarielloOrange LabsOrange Labs38-40, rue du general Leclerc38-40, rue du general Leclerc92130 Issy Les Moulineaux,92130 Issy Les Moulineaux,FranceFranceclaudio.imbrenda@orange.com luca.muscariello@orange.comDario RossiTelecom ParisTech23, Avenue d’Italie75013 Paris 13, Francedario.rossi@enst.frABSTRACT1.Web content coming from outside the ISP is today skyrocketing,causing significant additional infrastructure costs to network operators. The reduced marginal revenues left to ISPs, whose businessis almost entirely based on declining flat rate subscriptions, call forsignificant innovation within the network infrastructure, to supportnew service delivery.In this paper, we suggest the use of micro CDNs in ISP accessand back-haul networks to reduce redundant web traffic within theISP infrastructure while improving user’s QoS. With micro CDNwe refer to a content delivery system composed of (i) a high speedcaching substrate, (ii) a content based routing protocol and (iii) aset of data transfer mechanisms made available by content-centricnetworking.The contribution of this paper is twofold. First, we extensivelyanalyze more than one month of web traffic via continuous monitoring between the access and back-haul network of Orange inFrance. Second, we characterize key properties of monitored traffic, such as content popularity and request cacheability, to infer potential traffic reduction enabled by the introduction of micro CDNs.Based on these findings, we then perform micro CDN dimensioning in terms of memory requirements and provide guidelines ondesign choices.In recent years, we have assisted to significant deployments ofweb-based content delivery solutions within ISP networks, with theaim to deliver a range of services directly managed by the ISP itself.Some examples are video on demand (VoD) and subscriber VoD(SVoD). Broadcast TV, traditionally delivered across IP multicastchannels, has also been made available through web-based portalssupported by various kinds of CDN technologies. The spread ofweb-based content delivery solutions has multiple root causes, e.g.enhanced flexibility and ease of access from a vast set of user terminals, mostly mobile.In particular, today SVoD consumers expect to the able to accessvideo from any device inside and outside the home (TV, HDTV,smart-phones, tablets, media players), and also ask for high levelsof QoS. Traditional IP multicast fails to satisfy such a large set ofrequirements, leading ISPs to build their own video services on topof CDN systems. Further, CDNs usage has been fostered by theskyrocketing growth of Internet traffic volumes, mainly driven byvideo services. In fact, traffic volumes are no more carrying preeminently P2P file sharing applications, but video-based services withsignificant QoS requirements and often based on a third-party (e.g.Netflix) monthly subscription.Today model, relying on third-parties to provide web services,whose quality depends on someone else network infrastructure (oneor multiple ISPs), present various business weaknesses. Indeed, applications like file sharing or VoIP (e.g. Skype) respectively generate elastic flows with soft QoS constraints or negligible traffic, notcreating additional network costs.For video-centric services, the relation between investments andrevenues tends to be unbalanced when third-party content providersdo not recognize any additional revenue to the ISPs which, instead,shoulder investment and operational costs to deliver additional traffic shares at no incremental revenue. The end customer is not eager to pay more to solve the dispute among the two parties if thisrequires to loose Internet access flat rate. The dispute involvingNetflix and Comcast, Verizon and AT&T in the USA is one goodexample displaying the difficulties and frictions in this market [26].In terms of network resource utilization, IP multicast, nowadaysconsidered as obsolete, offers a valuable advantage over web basedsystems for TV broadcasting. In fact, IP multicast operates withinthe network while web based systems are today installed in the PoP(point of presence) and assume to reach the end user via a fullytransparent high capacity network that ISPs have low business incentive to guarantee.In this paper, we propose a novel approach for ISP content delivery, referred to as micro CDN (µCDN), combining the serviceflexibility of web based CDNs with efficient redundant traffic re-Categories and Subject DescriptorsC.2.1 [Computer-Communication Networks]: Network Architecture and Design—Network communicationsKeywordsInformation-Centric Networking; Network Traffic Measurements;Web caching; Content-Delivery Networks; Telco CDNGeneral TermsPerformance; MeasurementPermission to make digital or hard copies of all or part of this work for personal orclassroom use is granted without fee provided that copies are not made or distributedfor profit or commercial advantage and that copies bear this notice and the full citation on the first page. Copyrights for components of this work owned by others thanACM must be honored. Abstracting with credit is permitted. To copy otherwise, or republish, to post on servers or to redistribute to lists, requires prior specific permissionand/or a fee. Request permissions from Permissions@acm.org.ICN’14, September 24–26, 2014, Paris, France.Copyright 2014 ACM 978-1-4503-3206-4/14/09 . INTRODUCTION
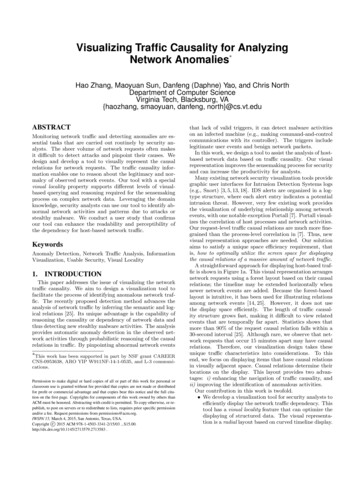
duction of IP multicast. A µCDN makes use of small storage thatcan work at high speed as can take advantage of fast memories.A few technologies suitable to achieve this goal already exist, i.e.JetStream [24], AltoBridge [5] and also Open Connect [27]. However, they suffer from the following limitations: (i) they provide nostandardized architecture, (ii) do not interoperate and (iii) do notsupport all kinds of web content.We believe that a promising candidate to satisfy the aforementioned goals is the content-centric networking (CCN) architecture(a.k.a. NDN) [21]. Indeed, by embedding a service agnostic content caching into the network architecture, CCN may provide acommon underlying network substrate for the deployment of nextgeneration CDN systems.The remainder of the paper is organized as follows. Sec.2 surveys related work. In Sec.3, we introduce the network setup, thedataset and the monitoring tool, HACkSAw, developed to analyzeweb data traffic. In Sec.4, we provide an extensive analysis of thedataset and a thorough statistical characterization of the key performance indicators required to guide µCDN system design. InSec.5, we gather a number of trace driven simulations of differentcaching systems, while Sec.6 presents the general network design,including feasibility considerations tailored to CCN. Finally, Sec.7concludes the paper.2.Figure 1: ISP network fiber access and back-haul.RELATED WORKOther work have measured cache performance for video applications [1], [2] but none of the previous work have considered alsoweb content size which has, however, a significant impact on theamount of required storage to install in the network. Web contentsize is often neglected in previous work as which are based on theanalysis on HTTP requests only, neglecting all HTTP replies. Themost notable exceptions are [32] and [36] which use a measurementmethodology similar to ours and analyze either HTTP request andreplies.In the last few years, a significant body of work has tried to measure the relation between the amount of resources and efforts (pain)to achieve the gains promised by CCN[18, 14]. Most of these worksare based on network simulations in some very specific scenarios,none of them taking into account the ISP infrastructure, but focusing on content placement and caching performance no deeper thanthe PoP.Other recent works, based on network experimentation, haveshown [8] the significant gains of CCN in some relatively downsized network settings. The drawbacks of computer simulation andnetwork experimentation are that, while being valuable, they do notallow to generalize the results for realistic workloads, difficult tomodel and to synthesize in general scenarios. Analytical models ofsuch systems [7, 9] allow to quickly evaluate the relation betweenQoS, network capacity and users’ demand; however, current models either fail to provide reliable performance predictions or mustbe tuned, a posteriori, using a data sample [28],[34].A common assumption to the evaluation of caching systems performance is to assume that content requests are generated under theIRM (Independent Reference Model), with a request distributionfollowing a Zipf law. Considerable measurement efforts have beendevoted to provide input to this workload in static settings, whilevery few consider the catalog dynamics over time. Characterization of video catalogs has especially attracted significant attention,from YouTube crawling [19], to measurement at a campus [38] orISP [28, 34], just to cite a few. Focusing on YouTube traffic, [28],[34] show that IRM assumption may yield to a significant underestimation of the achievable caching gains. However, the main focus of [34] is to propose a fine grained characterization of the data,rather than assessing the impact on the expected CCN gain (even alower bound), as we do in this work.In this paper, we propose a different approach based on networkmeasurements: we install a live web probe on some links betweenthe access and back-haul network serving fiber customers in theOrange network in France. Then, we evaluate the amount of redundant traffic flowing through the back-haul and the required memory to install within customer premise equipments (CPEs) and edgerouter line cards.3.WEB TRAFFIC MONITORINGThis section introduces our traffic monitoring infrastructure, deployed within Orange France ISP network, the dataset under studyand HACkSAw, our monitoring tool.Our methodology is based on deep packet inspection (DPI) ofthe HTTP protocol and does not apply to HTTPs, where all bytestransferred across a TCP connection are encrypted. In our dataset we observed 15% of all traffic on HTTPs and this statistic isexpected to grow in the future as HTTP 2.0 specifies encryptionby default. Considering the highly predominant usage of HTTPover HTTPs in our dataset the results presented in this paper arevaluable to draw significant conclusion about cache performance atthe network edge.3.1The monitoring infrastructureAlong the path between a PoP and the end customer, the monitoring probe can be placed at different network segments, rangingfrom the PoP or the broadband access server (BAS), where one observes the largest user fan-out, to the access network, where trafficis captured at a finer granularity. Our initial choice has been to perform monitoring of web traffic over the network segment betweenaccess and back-haul for fiber to the home users served by a GPON(Gigabit Passive Optical Network).The promising findings over such dataset captured between theaccess and the back-haul have convinced us to permanently installthe probe therein. As shown in Fig.1, each GPON consists of anOLT (optical line terminal), installed within a CO (central office)and accommodating, for instance, 16 line cards in a high density58
Toolnon blocking chassis. Line cards usually have a line rate of 1Gbpsto 10Gbps and each one typically serves up to 64 users connectedto a single optical line by a X64 optical splitter terminated by anONT (optical network terminal) in the home. Each OLT has a backhaul link towards the local loop consisting of a given number of IPedge routers. Our probe (described in Sec.3.3) is installed at twosuch back-haul links in Paris, arriving at the same edge router asdepicted in 033368Memory[GB]0.30.44.25.80-lengthreplies1 128 109N.A.424 355328 465Table 3: Performance of bro, Tstat and HACkSAw.The datasetThe probe captures every packet flowing on the wire and makesL3, L4 and L7 processing to collect a wide set of statistics at thedifferent layers. In the paper we focus on L7, namely HTTP traffic,to obtain the relevant part of the paper’s dataset: all HTTP requestsand corresponding replies.Distinct usersHTTP requestsHTTP data volumeDistinct objectsTotal1478369 238 00037TB174 283 000TCP connection and requests and replies of an HTTP transaction(possibly pipelined in a single TCP connection, i.e. HTTP/1.1).Recent work on web caching within the radio mobile backhaulin New York metropolitan area [32] and in South Korea [36] haveused proprietary tools satisfying the mentioned requirements. Unfortunately, none of these tools is publicly available.Conversely, popular open source tools like bro [29] and Tstat[25] do not satisfy all necessary requirements. Indeed, bro, conceived as an intrusion detection system, is not suitable for highspeed monitoring because it applies regular expressions on eachpacket to detect signatures of known threats, and therefore resultsto be very slow. Tstat, instead, is faster and accurate in analyzing TCP connections, but inaccurate in analyzing HTTP transactions. Consequently, both tools turn out to be not satisfactory forour needs.For this reason, the analysis presented in this paper is based on anovel tool, called HACkSAw and that we developed to accuratelyand continuously monitor web traffic in a modern operational ISPnetwork, at any line rate, for any workload.A comparison of the performance of the different tools is reported in Tab.3, using the same one hour trace as benchmark. Weexperiment with two version of Tstat, since its last version (releasedMay 6th, 2014) addresses some (though not all) shortcomings related to HTTP traffic analysis. bro detects about twice as muchHTTP requests with respect to Tstat (v2.3), using 10 times morememory and running over 20 times slower, whereas HACkSAwmanages to be almost as accurate as bro, and almost as fast as Tstat.Tstat (v2.4) catches most of the transactions, though it still fails tomatch the requests with the reply, and is hence unusable to reportsthe size of the object (at least when the Content-Length header isnot within the first IP packet of the reply, which happens more than30% of the cases in our benchmark). As such, if Tstat (v2.4) addresses shortcomings in terms of HTTP transactions recall, it stillfails to provide a reliable measure of object size.HACkSAw implements L3 packet collection ( and reordering,when needed) and L4 flow matching and reconstruction, so that aTCP connection is properly tracked and analyzed. Scalability isachieved via efficient non-blocking multithreaded design, availablein none of previous tools, enabling deployment of the probe in anyaccess or back-haul link. At flow termination (after a TCP halfclose or an inactivity timeout), the payload stream is handed to oneof the several consumer threads that are in charge of HTTP transactions analysis.Accuracy is, thus, achieved via full payload analysis and fullstream reconstructions (so that memory usage is close to that ofbro). In the network setup previously described, HACkSAw runson an IBM server with 2 quad-core Intel Xeon CPU E5-2643 at3.30GHz with 48GB of RAM each, for a total of 96GB of RAMmemory. The server is equipped with a Endace DAG7.5G4 card,allowing to capture packets from 4 Gigabit links simultaneously,allowing us to monitor 2 full-duplex Gigabit links. HACkSAw logsseveral information for each HTTP transaction namely:Daily Average12188 586 000881GB4 956 000Table 1: Dataset summary: April 18 to May 30 2014.Each detected HTTP request/reply transaction is recorded witha number of fields and associated statistics; namely time-stamp,user ID, object ID, Content-Length[15], and actual transaction lengthover the wire. We collect 42 days of data, from midnight April 18 tomidnight May 30, 2014. Tab.1 reports a summary of such dataset.Details about the methodology used to process captured traffic andto obtain relevant statistics are provided hereafter.Refour sts42 days14 days14 days1 day8 days1 day1 B42TB0.7TB256TB12TB–Table 2: Overview of the dataset in this and related work.Dataset of work inherent to caching or workload characterization, can either be request logs from servers, [37, 4, 14], gatheredvia active crawling techniques of popular portals [19, 11] or viapassive measurement methodology [32, 36] as we do in this work.A comparison of some basic information about the dataset considered in this and related work is given in Tab.3.2, where it can beseen that our dataset has a significant span in terms of time, requests and distinct objects seen.3.3DetectedRequests2 531 2101 348 6422 559 0562 426 391HACkSAw: the monitoring toolWe describe here HACkSAw, the continuous monitoring tool wehave developed to collect our dataset and to process it in order toderive the statistics presented in next sections.We recall that the measurement probe is installed at back-haullinks with line cards ranging from 1Gbps to 10Gbps. Packets onthe wire must be, then, captured and timestamped accurately at anyof such mentioned line rates to prevent malfunctioning of the processing of the different protocol layers: IP, TCP/UDP, HTTP. Theprobe also requires to be installed in a network location guaranteeing symmetric routing, to carefully capture both directions of a59
request timestamp, accurately given by the Endace DAGcard;link over a given time interval as a consequence of content cacheability. Traffic reduction is defined as user identifier, computed as the obfuscated MAC address oftheir home router;R RuRu 1 (2)RRwhere R is the total traffic, and Ru is the uncacheable traffic, bothmeasured in bytes. Before presenting observations from the network probe, we use a simple explanatory model to show that measuring content popularity at a timescale (as an example, over a largetime window), where the IRM assumption does not hold, may leadto wrong predictions in terms of memory requirements.We divide the time axis in windows of size T 0, Wi [iT, iT T ), and assume that, in each time window Wi , objectsin content catalog Ai are requested following a Poisson process ofrate λ, with Ai Aj for all i, j : i 6 j. The average objectsize is σ bytes. Ai is Zipf distributed with parameters α, N , i.e. acontent item of rank k is requested with probability qk ck α ,k {1, . . . , N }, Ai N .By using the modeling framework developed in [7] for an LRUcache of size x in bytes, we know that if T xα g, with 1/g λcσ α Γ(1 1/α)α the cache miss probability for an object of rankk tends to exp{ λqk gxα }.However, if one estimates the content popularity as the time average across m contiguous time windows, the estimated miss probability would be exp{ λqk g(x/m)α }. Indeed, the right cacheperformance measured across m contiguous time windows of sizeT is still exp{ λqk gxα } resulting in an overestimation factor mof the required memory, for the same miss ratio.In this section we estimate the timescale over which the IRMmodel can be used to estimate cache performance without usingcomplex measurement-based models, e.g. [28],[34]. object identifier, calculated as a hash of the full URL concatenated with the ETAG[15], when present; reported object size, from the HTTP Content-Length header,when present or computed from the chunk sub-headers incase of chunked transfer-encoding; actual object size, computed as the actual amount of unique(i.e., excluding TCP retransmissions) bytes on the wire, thatmay be lower than the reported object size in case of abortedtransfer.4.WEB TRAFFIC CHARACTERIZATIONTraffic characterization is an essential prerequisite of traffic engineering: network dimensioning and upgrading lie upon the knowledge of the relation between three entities: traffic demand, networkcapacity and quality of service. What makes traffic characterizationa difficult task is the stochastic nature of Internet traffic, complexto synthesize via simple models.In literature, a wide range of models exist, varying model abstraction and related complexity according to a more microscopicor macroscopic analysis of network dynamics. In this paper, weavoid a detailed representation of a network of caches, which turnsout to be analytically intractable even for a simple tandem cacheand simple workloads [17]. We rather prefer a simple characterization of web traffic, based on key system properties and applicableto general in-network caching systems. Such model abstraction,assuming an independent reference model (IRM), might be leveraged for the dimensioning of a micro CDN. The key factors impacting the performance of an in-network caching system and thatour model takes into account are:O BSERVATION 4.1. In order to exploit a IRM cache networkmodel for system dimensioning, one needs to estimate the smallest timescale, referred to as “cutoff” timescale at which the IRMassumption holds. As a consequence, above the cutoff timescale,every new content request gives a negligible contribution to catalog inference. the timescale at which content popularity may be approximated by an independent reference model (IRM) (Sec.4.1);In Fig.2(a),(b) we plot cacheability and traffic reduction as computed over our dataset at different time windows: from one hour toan entire contiguous week at incremental steps of one hour. Thestatistics are also computed starting at different time instants, delayed by one hour each. We observe that the two statistics have acutoff scale above which they reach a plateau. In Fig.2(c), we reportthe time required for the cacheability to attain percentiles (namely,the 75%, 90%, 95% and 99%) of the long term value: it can be seenthat 90% of the traffic reduction are attained in less than 24 hours,irrespectively of the start time. the content popularity at the given timescale (Sec.4.2).From their characterization, we later infer in Sec.5.1 the minimumuseful amount of memory to embed in the home network and inedge routers in the Micro CDN architecture.4.1Timescale analysisFirst, we define some statistics that will be used throughout thesection: catalog, cacheability, traffic reduction. The catalog is theset of distinct objects requested in a given time interval. As introduced in [2], the cacheability is a statistic indicating the fractionof requests for objects requested more than once in a given timeinterval. The first request of an object is not considered cacheable,whereas all its subsequent requests in the same time interval are.The resulting definition of cacheability isNoNr No 1 NrNrO BSERVATION 4.2. The cutoff scale is hard to be measured asit changes on a daily basis as a function of many factors that cannotbe rigorously quantified. However, we observe that for practicalpurposes aggregate web traffic would benefit for caching no morethan a daily content catalog.In Fig.2(a),(b) we also observe that the cacheability stabilizes atabout 47% while traffic reduction amounts to almost 37%. Thesevalues provide a first rough estimation of the opportunities to cachedata currently available within the ISP network at relatively lowuser fan-out. While statistics just presented provide insights on thepotential gains achievable by caching a daily content catalog, wenow investigate temporal evolution of the catalog.To this aim, we introduce a measure of auto similarity based onthe Jaccard coefficient, that indicates the proportion of objects in(1)where Nr is the number of requests observed in the given timeinterval, and No is the number of unique distinct objects observed(the cardinality of the catalog).We also define the traffic reduction, a statistic measuring themaximum amount of traffic that can be potentially saved across a60
h40h30h20h10h45%40%35%30%25%20%25 May 26 May 27 May 28 May 29 May 30 May15%25 May 26 May 27 May 28 May 29 May 30 May(a) Cacheability(b) Traffic reductioncacheabilitytraffic reduction75%90%95%99%(c) Hours needed to reach some percentiles ofthe cacheability and traffic reduction plateaus,with standard deviations.Figure 2: Cumulative cacheability and traffic reduction, starting from different hours and for various 1%1%0%25 May12 24 36 48 60 72 84 96 108 120 132 144 156 168Figure 3: Jaccard auto correlation function R T (k).common between two given sets: J(A, B) A B A B 1nnX(If A B J(Ci T , Cj T )27 May28 MayFigure 4: Jaccard coefficient, J(Ck0 T , C(k0 k) T ), k0 0, 2, 4, 6, 8.4.2 then J(A, B) , 1. Clearly, 0 J(A, B) 1. We then definethe Jaccard auto correlation function asR T (k) 26 MayContent popularity estimationHereafter, we present a model of content popularity estimatedover 24 hours. According to the observations reported above, thetimescale of interest turns out to be approximately defined by removing the night period, i.e. the off peak phase. This may be acomplex task as the off peak phase changes on a daily basis. Nevertheless, we observe that the off peak phase has statistically weakimpact on the overall distribution as it carries samples in the tail ofthe popularity distribution at low rate, so that 24 hours can be usedas timescale. We test the empirical popularity against various models and find the discrete Weibull to be the best fit with shape around0.24 (long tailed). In Fig.5, we report the empirical popularity distribution with corresponding 95% confidence bands (see [20] forsimilar analysis). We also plot, in red, the model fit to the availablesample with 95% confidence bands. By means of extensive testson this model we assess accuracy over all 24 hours samples on ourdata set. It follows that:(3)i,j: i j kbeing Ci T the content catalog measured over the time windowi T . Fig.3 shows R T (k) for k {0, . . . , 168}, T 1hour,during one working week in May 2014 (showing standard deviationas error bars). An interesting conclusion can be drawn.O BSERVATION 4.3. The catalog is weakly auto-correlated, asR T (k) falls from 100% to less than 5% and it completely regenerates asymptotically, as R T (k) 0 when k . A periodiccomponent with period of about 24 hours is also present as a resultof users’ daily routine.Finally, we show that catalog show a night/day effect in Fig.4,that reports J(Ck0 T , C(k0 k) T ), with T 1hour and k0 k 72, for multiple k0 {0, 2, 4, 6, 8}. The figure shows thatthe catalog has different properties during off peak hours (k0 {0, 2, 4}) than peak hours (k0 {6, 8}). Off-peak hours are characterized by content items that unlikely appears again in the future, while on-peak content items show periodic components of 24hours. for the tail of the distribution, a simple discrete Weibull passesa χ2 goodness of fit test [12], with p-values exceeding 5%significance level, while the good model for the entire distribution turns out to betrimodal with three components: a discrete Weibull for thehead of the distribution, a Zipf for the waist and, a Weibull61
under the more precise Weibull tail fit that we made. More, the cardinality of the catalog, N , is estimated with unbounded confidenceintervals (see Fig.5), whereas all Weibull’s parameters can be estimated with arbitrary low error, by increasing the size of the sample.As a consequence, an overestimation of the catalog size by a givenfactor under the all-Zipf model would lead to memory over-sizingof the same factor for a given target miss ratio.Conversely, the miss ratio under Weibull requests ([23]), e.g. ofan LRU cache, can be estimated with arbitrary precision by increasing the size of the sample to estimate the popularity law. Hence, wederive thatO BSERVATION 4.4. Accurate content popularity characterization is fundamental to drive a correct cache system dimensioning.Approximate models based on (i) all-Zipf assumption, (ii) possiblyfit over long time scales, coupled to (iii) IRM model assumptions,may lead to excessively conservative results, and ultimately to misguided system design choices.5.TRACE DRIVEN SIMULATIONSIn the following, we present some realistic simulations driven byour dataset. The goal is to evaluate the amount of memory requiredwithin the back-haul to absorb cacheable traffic and to assess theaccuracy of the model introduced in previous section for the dimensioning of a micro CDN system.Figure 5: Empirical web content popularity and model fittingwith corresponding confidence bands.5.1Single LRU cache at edge routerThe first set of simulations is based on an LRU cache installedat the probe and driven by real users’ requests. We simulate a LRUcache with different sizes and measure (i) the average hit ratio, (ii)the potential traffic savings over two timescales (1 hour and 1 day).The LRU cache simulates a transparent cache: a web object isstored in chunks, so that in case of a cache miss, only the missing chunk is requested. A following request for a bigger part of anobject partially present in cache generates another miss, but onlyfor the missing part of the object.We consider sizes of 1GB, 10GB, 100GB and 1TB, and neverexplicitly flush cache content. Performance metrics are reportedin Fig.6(a),(d) and compared with two additional systems obtainedby shuffling all the requests on a hourly and daily basis, reportedin Fig.6(b),(e) and Fig.6(c),(f) respectively. Request shuffling isuseful to remove time correlation, which has huge impact on cacheperformance as already discussed in Sec.4 (i.e., shuffling producesa workload closer to that of IRM model).From the simulations we see that if the cache is big enough(1TB), time correlations has not impact on performance. For mediumor small caches instead, time correlation affects significantly performance as hit ratios and saved traffic, twice as much in presenceof temporal locality o
tecture and Design—Network communications Keywords Information-Centric Networking; Network Traffic Measurements; Web caching; Content-Delivery Networks; Telco CDN . Figure 1: ISP network fiber access and back-haul. Other work have measured cache performance for video appli-cations [1], [2] but none of the previous work have considered .